By InvestMacro | COT | Data Tables | COT Leaders | Downloads | COT Newsletter
Here are the latest charts and statistics for the Commitment of Traders (COT) data published by the Commodities Futures Trading Commission (CFTC).
The latest COT data is updated through Tuesday March 15th and shows a quick view of how large traders (for-profit speculators and commercial entities) were positioned in the futures markets. All currency positions are in direct relation to the US dollar where, for example, a bet for the euro is a bet that the euro will rise versus the dollar while a bet against the euro will be a bet that the euro will decline versus the dollar.
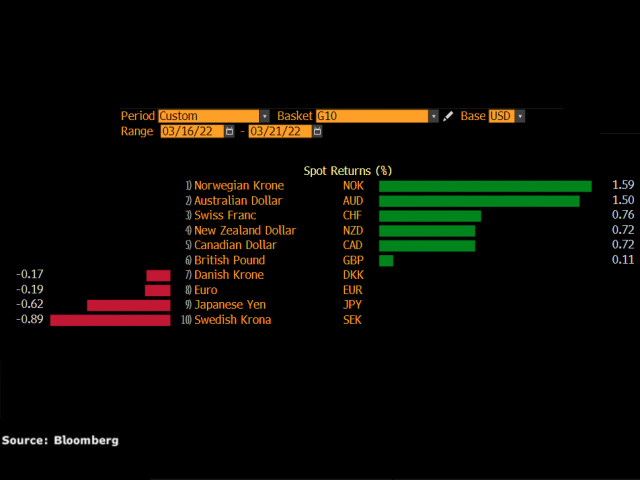
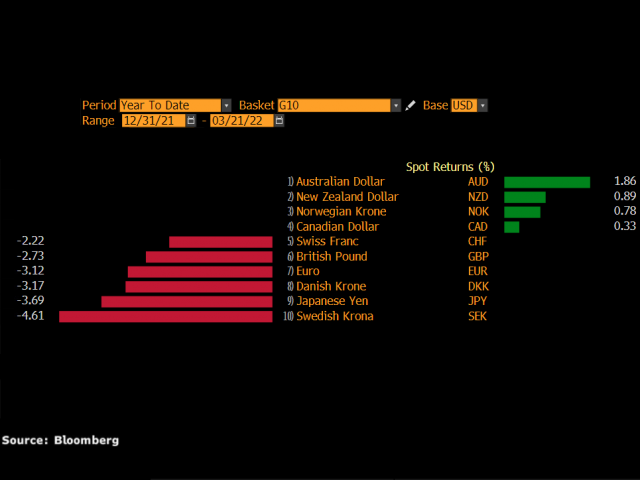
Highlighting the COT currency data was the strong speculator sentiment for the commodity currencies in the currency futures contracts. The Canadian dollar, Australian dollar and the New Zealand dollar all saw boosts in their bets that either pushed their bullish standings higher or sharply reduced their bearish levels this week.
The Australian dollar saw the largest improvement with a huge net gain of over +33,000 contracts this week which marked the largest one-week increase in the past three hundred and sixty-five weeks, dating all the way back to March of 2015. This week’s gain dropped the AUD’s current bearish standing down to -44,856 contracts from approximately -78,000 contracts in the previous week.
The New Zealand dollar contracts saw a one-week gain of +16,032 contracts which marked its largest one-week rise in the past one hundred and seventeen weeks (back to December of 2017). This rise brought the NZD speculator positions out of bearish territory for the first time in fourteen weeks to a very small bullish level of +3,653 contracts.
Finally, the Canadian dollar contracts increased by a net position of +10,094 contracts this week after falling in four out of the previous five weeks. This climb in speculative bets brings the current CAD bullish standing to the best level of the past six weeks.
Overall, the currency markets with higher speculator bets this week were the New Zealand dollar (16,032 contracts), Canadian dollar (10,094 contracts), Swiss franc (4,481 contracts) and the Australian dollar (33,339 contracts).
The currencies with declining bets were the US Dollar Index (-5,664 contracts), Mexican peso (-63,593 contracts), Euro (-40,050 contracts), Japanese yen (-6,484 contracts), Brazil real (-6,333 contracts), British pound sterling (-16,535 contracts), Russian ruble (-263 contracts) and Bitcoin (-75 contracts).
| Mar-15-2022 | OI | OI-Index | Spec-Net | Spec-Index | Com-Net | COM-Index | Smalls-Net | Smalls-Index |
|---|
| USD Index | 47,574 | 62 | 28,380 | 75 | -31,969 | 21 | 3,589 | 56 |
| EUR | 666,010 | 70 | 18,794 | 41 | -42,629 | 64 | 23,835 | 14 |
| GBP | 188,323 | 31 | -29,061 | 53 | 37,279 | 52 | -8,218 | 39 |
| JPY | 215,484 | 65 | -62,340 | 29 | 87,597 | 80 | -25,257 | 0 |
| CHF | 43,356 | 19 | -5,229 | 61 | 17,460 | 50 | -12,231 | 27 |
| CAD | 143,863 | 26 | 17,740 | 65 | -13,145 | 50 | -4,595 | 21 |
| AUD | 124,521 | 25 | -44,856 | 43 | 48,640 | 55 | -3,784 | 43 |
| NZD | 39,200 | 23 | 3,653 | 77 | -1,815 | 28 | -1,838 | 31 |
| MXN | 102,749 | 4 | -10,576 | 23 | 7,848 | 76 | 2,728 | 55 |
| RUB | 20,930 | 4 | 7,543 | 31 | -7,150 | 69 | -393 | 24 |
| BRL | 68,874 | 65 | 44,163 | 94 | -46,800 | 6 | 2,637 | 97 |
| Bitcoin | 10,198 | 53 | 190 | 98 | -453 | 0 | 263 | 19 |
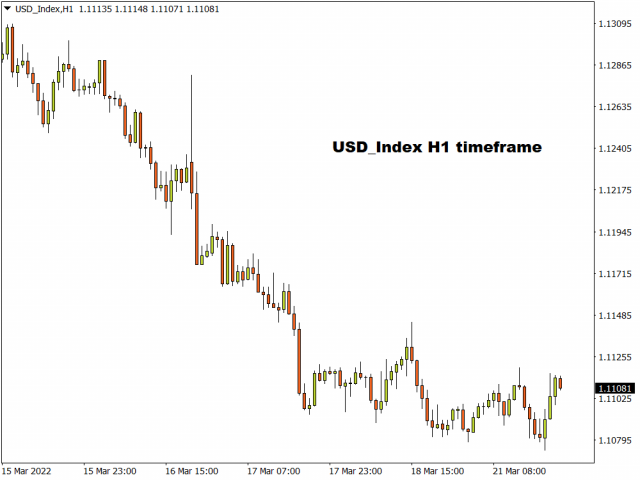
US Dollar Index Futures:
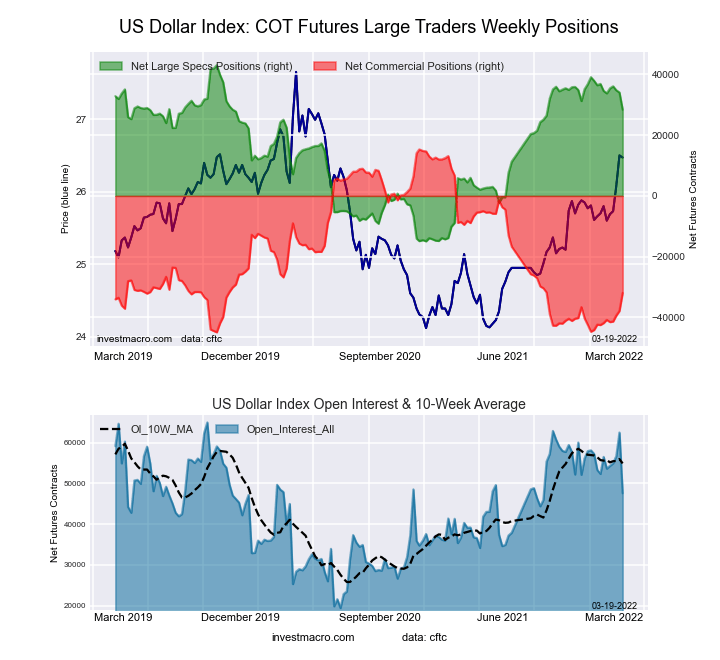 The US Dollar Index large speculator standing this week came in at a net position of 28,380 contracts in the data reported through Tuesday. This was a weekly lowering of -5,664 contracts from the previous week which had a total of 34,044 net contracts.
This week’s current strength score (the trader positioning range over the past three years, measured from 0 to 100) shows the speculators are currently Bullish with a score of 74.7 percent. The commercials are Bearish with a score of 21.5 percent and the small traders (not shown in chart) are Bullish with a score of 55.8 percent.
| US DOLLAR INDEX Statistics | SPECULATORS | COMMERCIALS | SMALL TRADERS |
| – Percent of Open Interest Longs: | 83.6 | 3.1 | 11.0 |
| – Percent of Open Interest Shorts: | 23.9 | 70.3 | 3.5 |
| – Net Position: | 28,380 | -31,969 | 3,589 |
| – Gross Longs: | 39,767 | 1,452 | 5,242 |
| – Gross Shorts: | 11,387 | 33,421 | 1,653 |
| – Long to Short Ratio: | 3.5 to 1 | 0.0 to 1 | 3.2 to 1 |
| NET POSITION TREND: | | | |
| – Strength Index Score (3 Year Range Pct): | 74.7 | 21.5 | 55.8 |
| – Strength Index Reading (3 Year Range): | Bullish | Bearish | Bullish |
| NET POSITION MOVEMENT INDEX: | | | |
| – 6-Week Change in Strength Index: | -10.7 | 16.5 | -40.7 |
Euro Currency Futures:
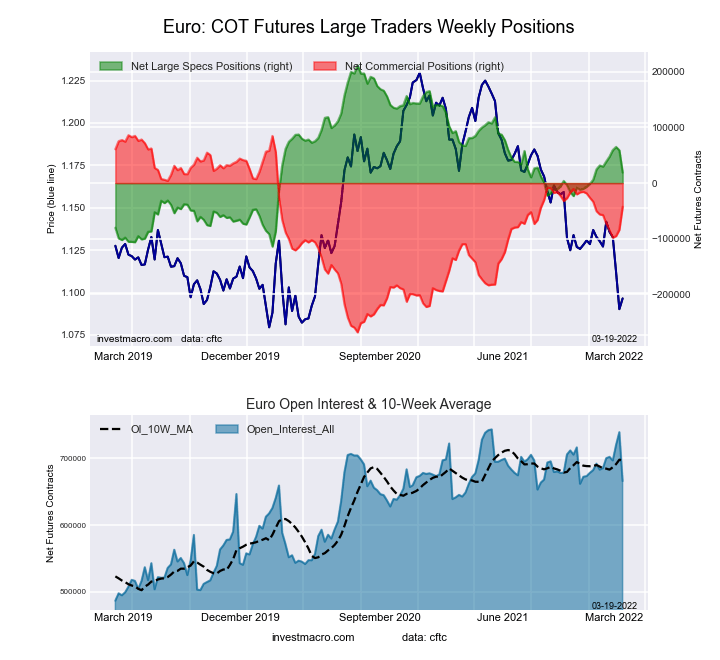 The Euro Currency large speculator standing this week came in at a net position of 18,794 contracts in the data reported through Tuesday. This was a weekly decline of -40,050 contracts from the previous week which had a total of 58,844 net contracts.
This week’s current strength score (the trader positioning range over the past three years, measured from 0 to 100) shows the speculators are currently Bearish with a score of 40.8 percent. The commercials are Bullish with a score of 63.7 percent and the small traders (not shown in chart) are Bearish-Extreme with a score of 13.9 percent.
| EURO Currency Statistics | SPECULATORS | COMMERCIALS | SMALL TRADERS |
| – Percent of Open Interest Longs: | 30.3 | 55.4 | 11.3 |
| – Percent of Open Interest Shorts: | 27.5 | 61.8 | 7.7 |
| – Net Position: | 18,794 | -42,629 | 23,835 |
| – Gross Longs: | 202,040 | 369,253 | 75,191 |
| – Gross Shorts: | 183,246 | 411,882 | 51,356 |
| – Long to Short Ratio: | 1.1 to 1 | 0.9 to 1 | 1.5 to 1 |
| NET POSITION TREND: | | | |
| – Strength Index Score (3 Year Range Pct): | 40.8 | 63.7 | 13.9 |
| – Strength Index Reading (3 Year Range): | Bearish | Bullish | Bearish-Extreme |
| NET POSITION MOVEMENT INDEX: | | | |
| – 6-Week Change in Strength Index: | -3.4 | 4.2 | -6.5 |
British Pound Sterling Futures:
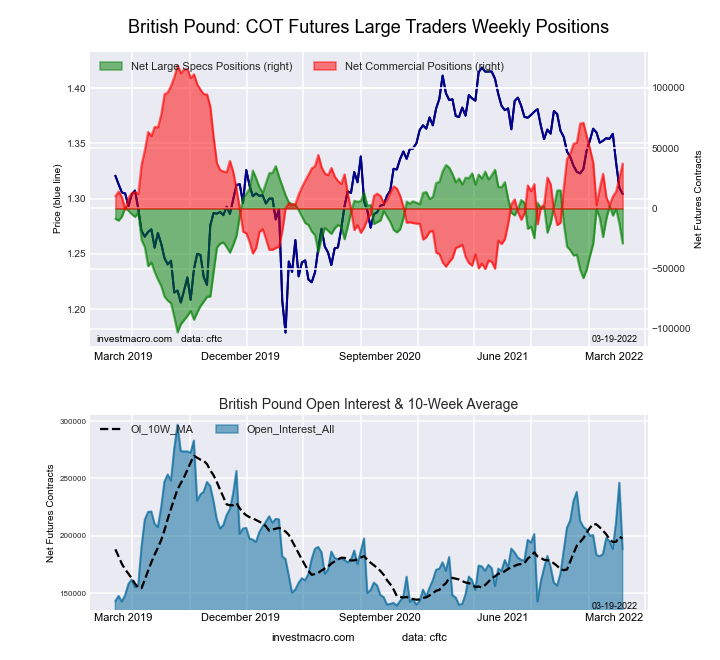 The British Pound Sterling large speculator standing this week came in at a net position of -29,061 contracts in the data reported through Tuesday. This was a weekly decrease of -16,535 contracts from the previous week which had a total of -12,526 net contracts.
This week’s current strength score (the trader positioning range over the past three years, measured from 0 to 100) shows the speculators are currently Bullish with a score of 53.1 percent. The commercials are Bullish with a score of 51.7 percent and the small traders (not shown in chart) are Bearish with a score of 38.6 percent.
| BRITISH POUND Statistics | SPECULATORS | COMMERCIALS | SMALL TRADERS |
| – Percent of Open Interest Longs: | 17.2 | 66.9 | 12.6 |
| – Percent of Open Interest Shorts: | 32.7 | 47.1 | 16.9 |
| – Net Position: | -29,061 | 37,279 | -8,218 |
| – Gross Longs: | 32,442 | 125,994 | 23,650 |
| – Gross Shorts: | 61,503 | 88,715 | 31,868 |
| – Long to Short Ratio: | 0.5 to 1 | 1.4 to 1 | 0.7 to 1 |
| NET POSITION TREND: | | | |
| – Strength Index Score (3 Year Range Pct): | 53.1 | 51.7 | 38.6 |
| – Strength Index Reading (3 Year Range): | Bullish | Bullish | Bearish |
| NET POSITION MOVEMENT INDEX: | | | |
| – 6-Week Change in Strength Index: | -3.9 | 5.0 | -6.1 |
Japanese Yen Futures:
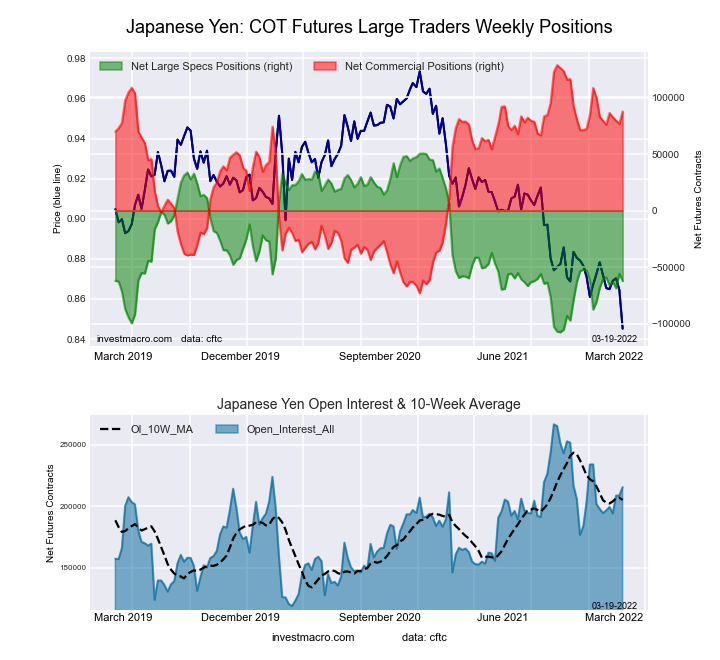 The Japanese Yen large speculator standing this week came in at a net position of -62,340 contracts in the data reported through Tuesday. This was a weekly decrease of -6,484 contracts from the previous week which had a total of -55,856 net contracts.
This week’s current strength score (the trader positioning range over the past three years, measured from 0 to 100) shows the speculators are currently Bearish with a score of 28.6 percent. The commercials are Bullish with a score of 79.7 percent and the small traders (not shown in chart) are Bearish-Extreme with a score of 0.0 percent.
| JAPANESE YEN Statistics | SPECULATORS | COMMERCIALS | SMALL TRADERS |
| – Percent of Open Interest Longs: | 15.8 | 75.7 | 7.2 |
| – Percent of Open Interest Shorts: | 44.7 | 35.0 | 18.9 |
| – Net Position: | -62,340 | 87,597 | -25,257 |
| – Gross Longs: | 34,016 | 163,089 | 15,533 |
| – Gross Shorts: | 96,356 | 75,492 | 40,790 |
| – Long to Short Ratio: | 0.4 to 1 | 2.2 to 1 | 0.4 to 1 |
| NET POSITION TREND: | | | |
| – Strength Index Score (3 Year Range Pct): | 28.6 | 79.7 | 0.0 |
| – Strength Index Reading (3 Year Range): | Bearish | Bullish | Bearish-Extreme |
| NET POSITION MOVEMENT INDEX: | | | |
| – 6-Week Change in Strength Index: | -1.1 | 4.1 | -13.6 |
Swiss Franc Futures:
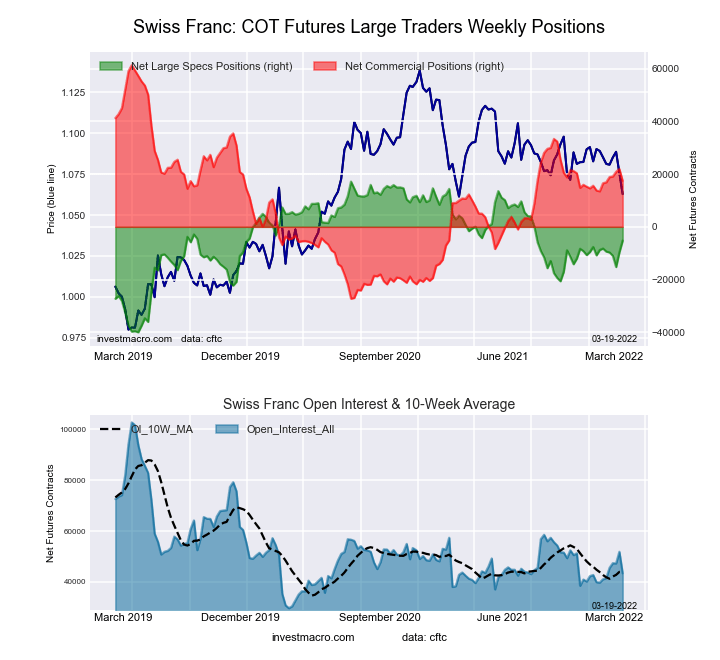 The Swiss Franc large speculator standing this week came in at a net position of -5,229 contracts in the data reported through Tuesday. This was a weekly lift of 4,481 contracts from the previous week which had a total of -9,710 net contracts.
This week’s current strength score (the trader positioning range over the past three years, measured from 0 to 100) shows the speculators are currently Bullish with a score of 60.8 percent. The commercials are Bullish with a score of 50.5 percent and the small traders (not shown in chart) are Bearish with a score of 27.4 percent.
| SWISS FRANC Statistics | SPECULATORS | COMMERCIALS | SMALL TRADERS |
| – Percent of Open Interest Longs: | 13.4 | 66.3 | 20.2 |
| – Percent of Open Interest Shorts: | 25.5 | 26.1 | 48.4 |
| – Net Position: | -5,229 | 17,460 | -12,231 |
| – Gross Longs: | 5,808 | 28,761 | 8,768 |
| – Gross Shorts: | 11,037 | 11,301 | 20,999 |
| – Long to Short Ratio: | 0.5 to 1 | 2.5 to 1 | 0.4 to 1 |
| NET POSITION TREND: | | | |
| – Strength Index Score (3 Year Range Pct): | 60.8 | 50.5 | 27.4 |
| – Strength Index Reading (3 Year Range): | Bullish | Bullish | Bearish |
| NET POSITION MOVEMENT INDEX: | | | |
| – 6-Week Change in Strength Index: | 5.3 | 1.0 | -11.5 |
Canadian Dollar Futures:
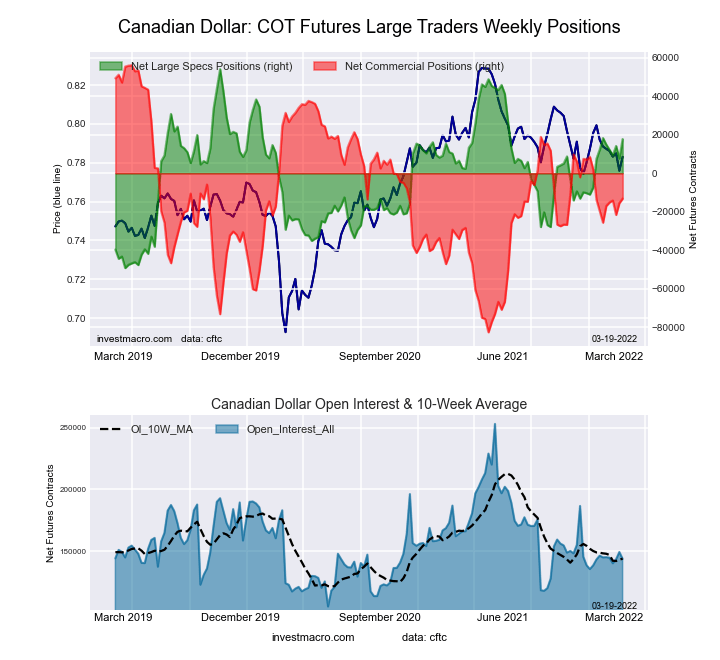 The Canadian Dollar large speculator standing this week came in at a net position of 17,740 contracts in the data reported through Tuesday. This was a weekly boost of 10,094 contracts from the previous week which had a total of 7,646 net contracts.
This week’s current strength score (the trader positioning range over the past three years, measured from 0 to 100) shows the speculators are currently Bullish with a score of 64.9 percent. The commercials are Bullish with a score of 50.0 percent and the small traders (not shown in chart) are Bearish with a score of 20.6 percent.
| CANADIAN DOLLAR Statistics | SPECULATORS | COMMERCIALS | SMALL TRADERS |
| – Percent of Open Interest Longs: | 33.0 | 41.3 | 20.3 |
| – Percent of Open Interest Shorts: | 20.6 | 50.4 | 23.5 |
| – Net Position: | 17,740 | -13,145 | -4,595 |
| – Gross Longs: | 47,406 | 59,344 | 29,213 |
| – Gross Shorts: | 29,666 | 72,489 | 33,808 |
| – Long to Short Ratio: | 1.6 to 1 | 0.8 to 1 | 0.9 to 1 |
| NET POSITION TREND: | | | |
| – Strength Index Score (3 Year Range Pct): | 64.9 | 50.0 | 20.6 |
| – Strength Index Reading (3 Year Range): | Bullish | Bullish | Bearish |
| NET POSITION MOVEMENT INDEX: | | | |
| – 6-Week Change in Strength Index: | -0.5 | 9.0 | -23.8 |
Australian Dollar Futures:
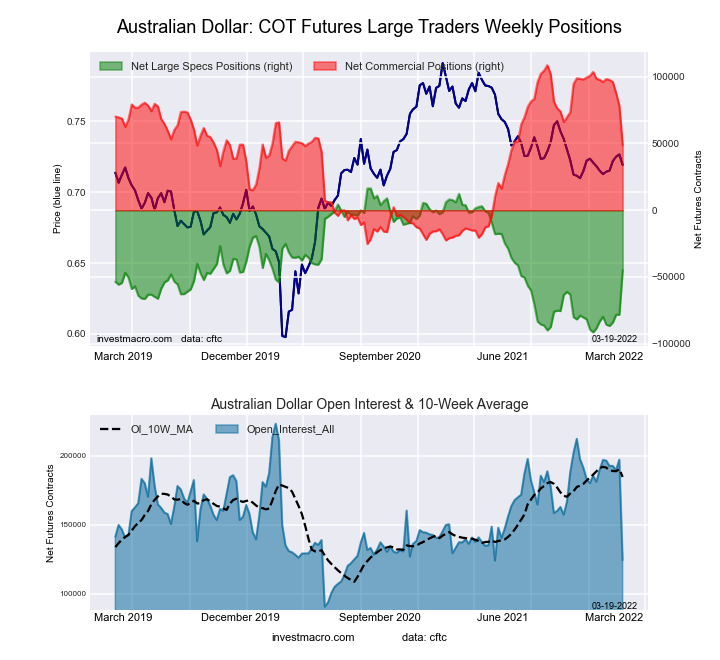 The Australian Dollar large speculator standing this week came in at a net position of -44,856 contracts in the data reported through Tuesday. This was a weekly boost of 33,339 contracts from the previous week which had a total of -78,195 net contracts.
This week’s current strength score (the trader positioning range over the past three years, measured from 0 to 100) shows the speculators are currently Bearish with a score of 43.2 percent. The commercials are Bullish with a score of 55.2 percent and the small traders (not shown in chart) are Bearish with a score of 43.2 percent.
| AUSTRALIAN DOLLAR Statistics | SPECULATORS | COMMERCIALS | SMALL TRADERS |
| – Percent of Open Interest Longs: | 19.5 | 62.3 | 15.6 |
| – Percent of Open Interest Shorts: | 55.5 | 23.3 | 18.6 |
| – Net Position: | -44,856 | 48,640 | -3,784 |
| – Gross Longs: | 24,281 | 77,621 | 19,378 |
| – Gross Shorts: | 69,137 | 28,981 | 23,162 |
| – Long to Short Ratio: | 0.4 to 1 | 2.7 to 1 | 0.8 to 1 |
| NET POSITION TREND: | | | |
| – Strength Index Score (3 Year Range Pct): | 43.2 | 55.2 | 43.2 |
| – Strength Index Reading (3 Year Range): | Bearish | Bullish | Bearish |
| NET POSITION MOVEMENT INDEX: | | | |
| – 6-Week Change in Strength Index: | 32.4 | -35.4 | 30.4 |
New Zealand Dollar Futures:
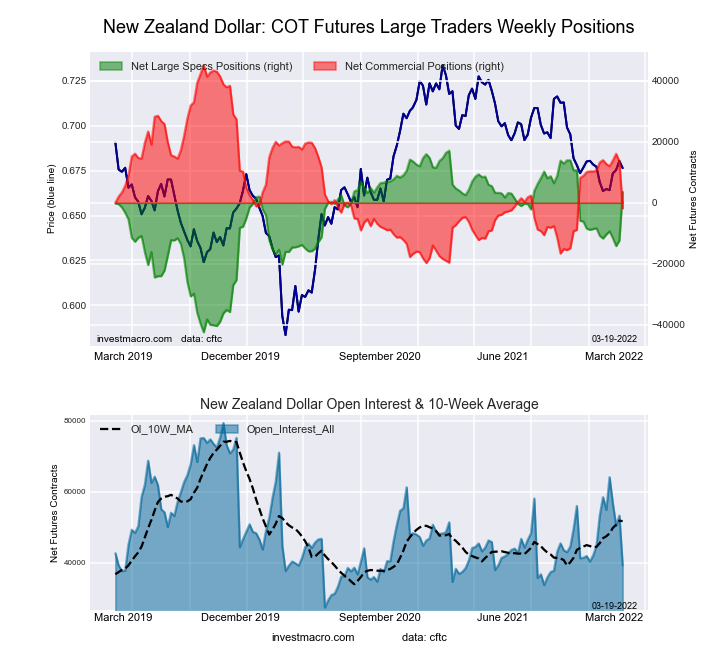 The New Zealand Dollar large speculator standing this week came in at a net position of 3,653 contracts in the data reported through Tuesday. This was a weekly rise of 16,032 contracts from the previous week which had a total of -12,379 net contracts.
This week’s current strength score (the trader positioning range over the past three years, measured from 0 to 100) shows the speculators are currently Bullish with a score of 77.4 percent. The commercials are Bearish with a score of 27.6 percent and the small traders (not shown in chart) are Bearish with a score of 30.8 percent.
| NEW ZEALAND DOLLAR Statistics | SPECULATORS | COMMERCIALS | SMALL TRADERS |
| – Percent of Open Interest Longs: | 54.8 | 37.4 | 6.2 |
| – Percent of Open Interest Shorts: | 45.5 | 42.1 | 10.9 |
| – Net Position: | 3,653 | -1,815 | -1,838 |
| – Gross Longs: | 21,493 | 14,671 | 2,417 |
| – Gross Shorts: | 17,840 | 16,486 | 4,255 |
| – Long to Short Ratio: | 1.2 to 1 | 0.9 to 1 | 0.6 to 1 |
| NET POSITION TREND: | | | |
| – Strength Index Score (3 Year Range Pct): | 77.4 | 27.6 | 30.8 |
| – Strength Index Reading (3 Year Range): | Bullish | Bearish | Bearish |
| NET POSITION MOVEMENT INDEX: | | | |
| – 6-Week Change in Strength Index: | 25.8 | -24.4 | 5.5 |
Mexican Peso Futures:
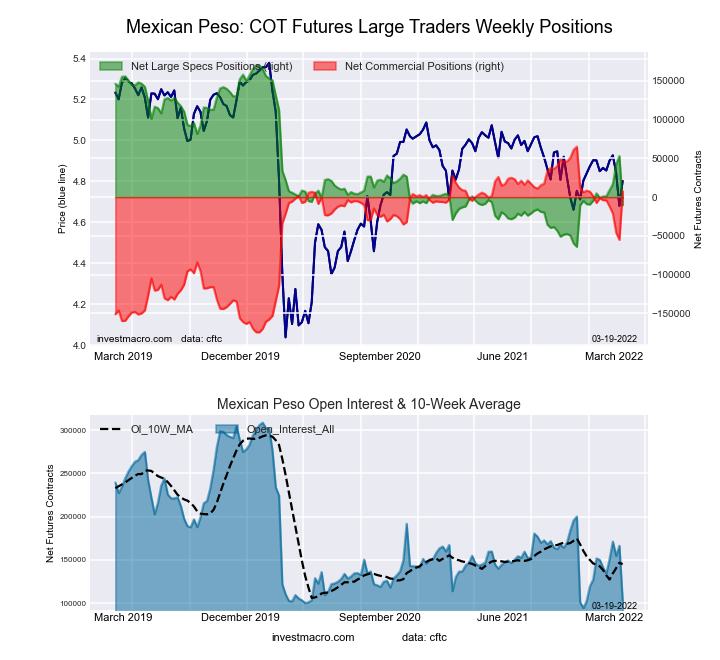 The Mexican Peso large speculator standing this week came in at a net position of -10,576 contracts in the data reported through Tuesday. This was a weekly reduction of -63,593 contracts from the previous week which had a total of 53,017 net contracts.
This week’s current strength score (the trader positioning range over the past three years, measured from 0 to 100) shows the speculators are currently Bearish with a score of 22.8 percent. The commercials are Bullish with a score of 76.1 percent and the small traders (not shown in chart) are Bullish with a score of 54.6 percent.
| MEXICAN PESO Statistics | SPECULATORS | COMMERCIALS | SMALL TRADERS |
| – Percent of Open Interest Longs: | 38.1 | 55.1 | 6.1 |
| – Percent of Open Interest Shorts: | 48.4 | 47.5 | 3.5 |
| – Net Position: | -10,576 | 7,848 | 2,728 |
| – Gross Longs: | 39,164 | 56,610 | 6,302 |
| – Gross Shorts: | 49,740 | 48,762 | 3,574 |
| – Long to Short Ratio: | 0.8 to 1 | 1.2 to 1 | 1.8 to 1 |
| NET POSITION TREND: | | | |
| – Strength Index Score (3 Year Range Pct): | 22.8 | 76.1 | 54.6 |
| – Strength Index Reading (3 Year Range): | Bearish | Bullish | Bullish |
| NET POSITION MOVEMENT INDEX: | | | |
| – 6-Week Change in Strength Index: | -4.8 | 4.9 | -1.7 |
Brazilian Real Futures:
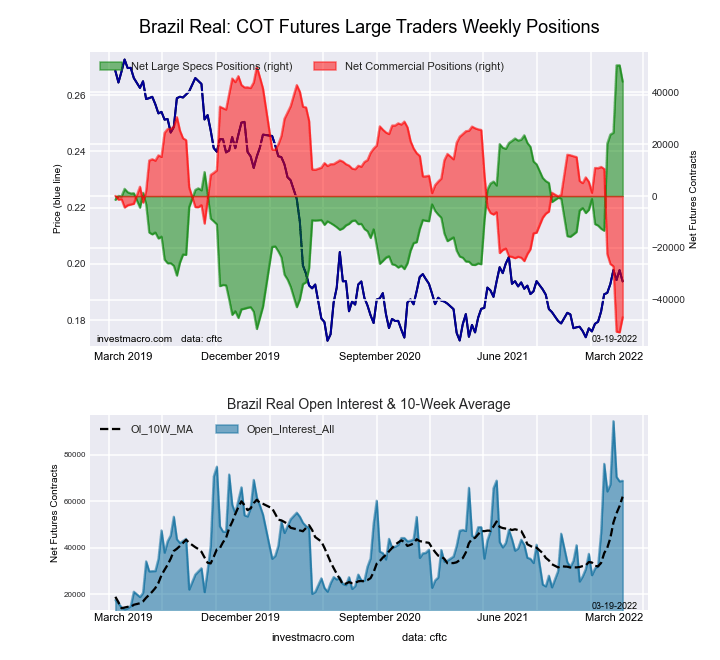 The Brazilian Real large speculator standing this week came in at a net position of 44,163 contracts in the data reported through Tuesday. This was a weekly fall of -6,333 contracts from the previous week which had a total of 50,496 net contracts.
This week’s current strength score (the trader positioning range over the past three years, measured from 0 to 100) shows the speculators are currently Bullish-Extreme with a score of 93.8 percent. The commercials are Bearish-Extreme with a score of 5.6 percent and the small traders (not shown in chart) are Bullish-Extreme with a score of 97.0 percent.
| BRAZIL REAL Statistics | SPECULATORS | COMMERCIALS | SMALL TRADERS |
| – Percent of Open Interest Longs: | 80.1 | 13.7 | 6.2 |
| – Percent of Open Interest Shorts: | 16.0 | 81.7 | 2.3 |
| – Net Position: | 44,163 | -46,800 | 2,637 |
| – Gross Longs: | 55,181 | 9,444 | 4,239 |
| – Gross Shorts: | 11,018 | 56,244 | 1,602 |
| – Long to Short Ratio: | 5.0 to 1 | 0.2 to 1 | 2.6 to 1 |
| NET POSITION TREND: | | | |
| – Strength Index Score (3 Year Range Pct): | 93.8 | 5.6 | 97.0 |
| – Strength Index Reading (3 Year Range): | Bullish-Extreme | Bearish-Extreme | Bullish-Extreme |
| NET POSITION MOVEMENT INDEX: | | | |
| – 6-Week Change in Strength Index: | 56.5 | -55.9 | -3.0 |
Russian Ruble Futures:
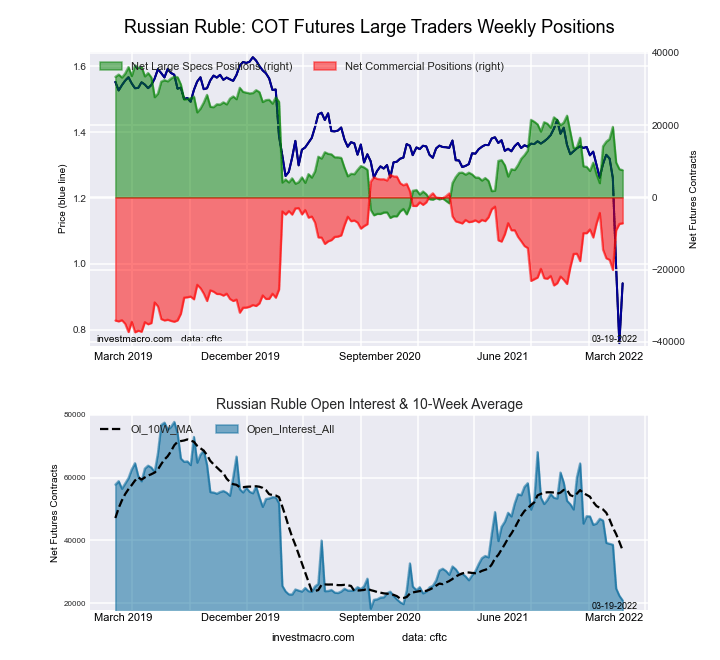 The Russian Ruble large speculator standing this week came in at a net position of 7,543 contracts in the data reported through Tuesday. This was a weekly decline of -263 contracts from the previous week which had a total of 7,806 net contracts.
This week’s current strength score (the trader positioning range over the past three years, measured from 0 to 100) shows the speculators are currently Bearish with a score of 31.2 percent. The commercials are Bullish with a score of 69.1 percent and the small traders (not shown in chart) are Bearish with a score of 23.9 percent.
| RUSSIAN RUBLE Statistics | SPECULATORS | COMMERCIALS | SMALL TRADERS |
| – Percent of Open Interest Longs: | 36.6 | 60.6 | 2.8 |
| – Percent of Open Interest Shorts: | 0.5 | 94.7 | 4.7 |
| – Net Position: | 7,543 | -7,150 | -393 |
| – Gross Longs: | 7,658 | 12,679 | 593 |
| – Gross Shorts: | 115 | 19,829 | 986 |
| – Long to Short Ratio: | 66.6 to 1 | 0.6 to 1 | 0.6 to 1 |
| NET POSITION TREND: | | | |
| – Strength Index Score (3 Year Range Pct): | 31.2 | 69.1 | 23.9 |
| – Strength Index Reading (3 Year Range): | Bearish | Bullish | Bearish |
| NET POSITION MOVEMENT INDEX: | | | |
| – 6-Week Change in Strength Index: | -15.6 | 16.7 | -18.8 |
Bitcoin Futures:
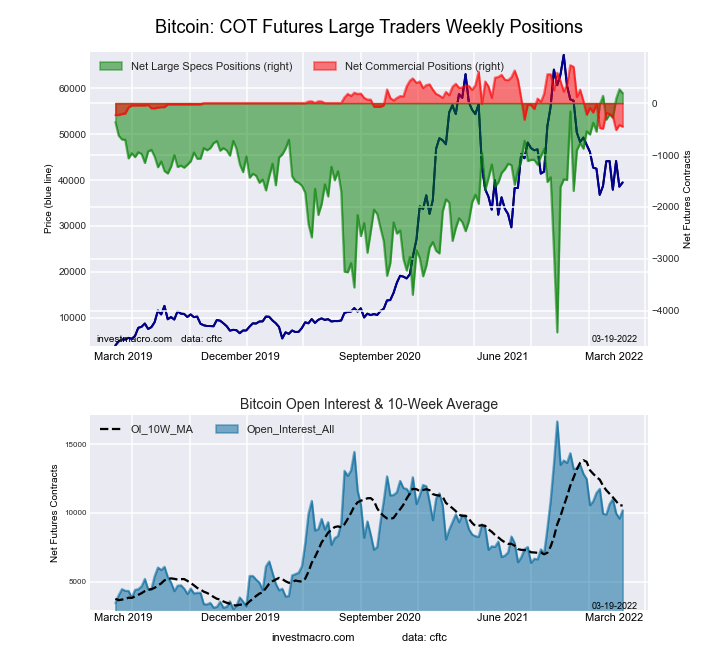 The Bitcoin large speculator standing this week came in at a net position of 190 contracts in the data reported through Tuesday. This was a weekly decline of -75 contracts from the previous week which had a total of 265 net contracts.
This week’s current strength score (the trader positioning range over the past three years, measured from 0 to 100) shows the speculators are currently Bullish-Extreme with a score of 98.4 percent. The commercials are Bearish-Extreme with a score of 5.1 percent and the small traders (not shown in chart) are Bearish-Extreme with a score of 18.9 percent.
| BITCOIN Statistics | SPECULATORS | COMMERCIALS | SMALL TRADERS |
| – Percent of Open Interest Longs: | 78.3 | 2.7 | 10.1 |
| – Percent of Open Interest Shorts: | 76.5 | 7.2 | 7.5 |
| – Net Position: | 190 | -453 | 263 |
| – Gross Longs: | 7,989 | 279 | 1,029 |
| – Gross Shorts: | 7,799 | 732 | 766 |
| – Long to Short Ratio: | 1.0 to 1 | 0.4 to 1 | 1.3 to 1 |
| NET POSITION TREND: | | | |
| – Strength Index Score (3 Year Range Pct): | 98.4 | 5.1 | 18.9 |
| – Strength Index Reading (3 Year Range): | Bullish-Extreme | Bearish-Extreme | Bearish-Extreme |
| NET POSITION MOVEMENT INDEX: | | | |
| – 6-Week Change in Strength Index: | 1.0 | 3.0 | -2.0 |
Article By InvestMacro – Receive our weekly COT Reports by Email
*COT Report: The COT data, released weekly to the public each Friday, is updated through the most recent Tuesday (data is 3 days old) and shows a quick view of how large speculators or non-commercials (for-profit traders) were positioned in the futures markets.
The CFTC categorizes trader positions according to commercial hedgers (traders who use futures contracts for hedging as part of the business), non-commercials (large traders who speculate to realize trading profits) and nonreportable traders (usually small traders/speculators) as well as their open interest (contracts open in the market at time of reporting).See CFTC criteria here.


