by JustForex
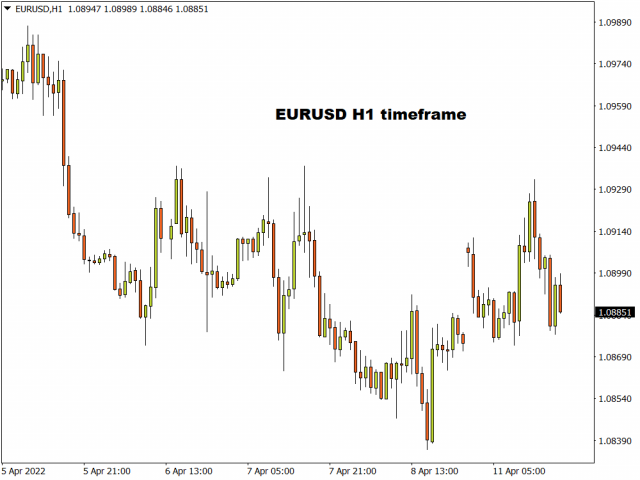
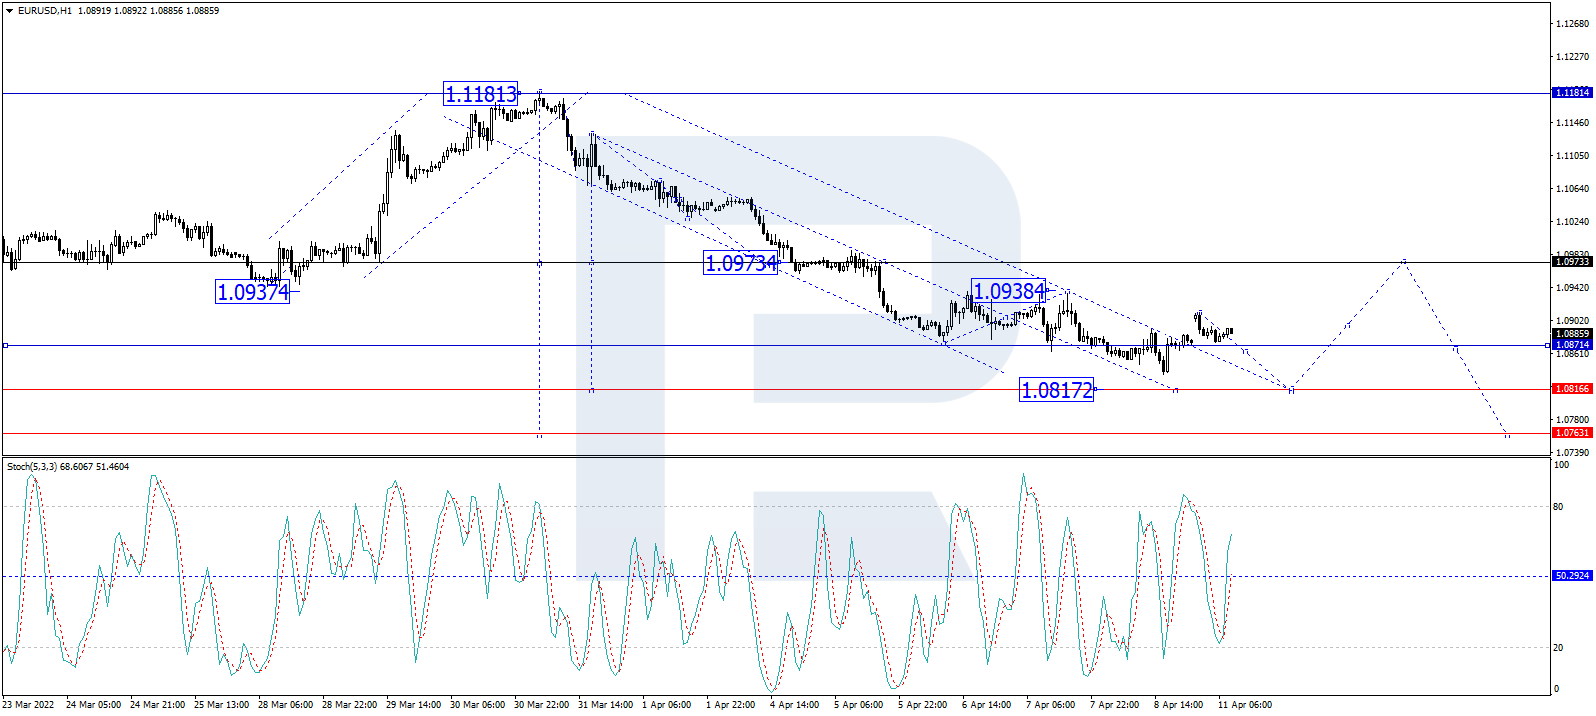
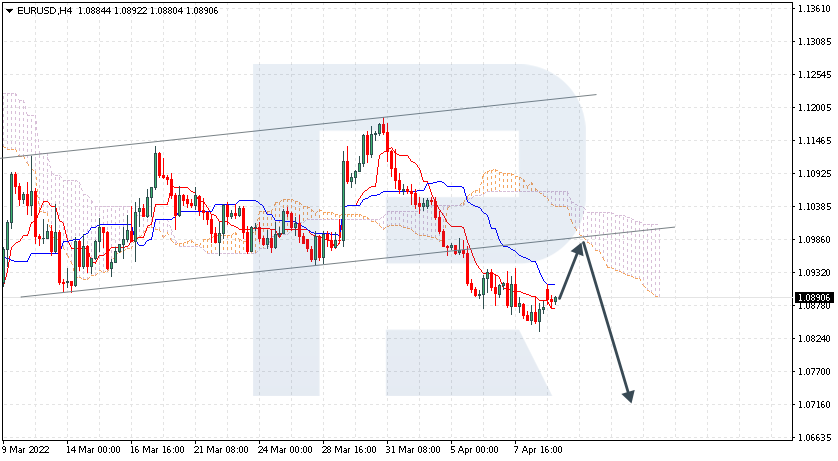
The EUR/USD currency pair
- Prev Open: 1.0882
- Prev Close: 1.0825
- % chg. over the last day: -0.52%
In December 1981, the interest rate on bonds was 13%, and today it is only 0.33%. This means that the real federal funds rate is -8.2%. The US Fed must be aggressive in its monetary policy. FOMC spokesman Brainard said yesterday that the Fed is considering a balance sheet reduction starting in June.
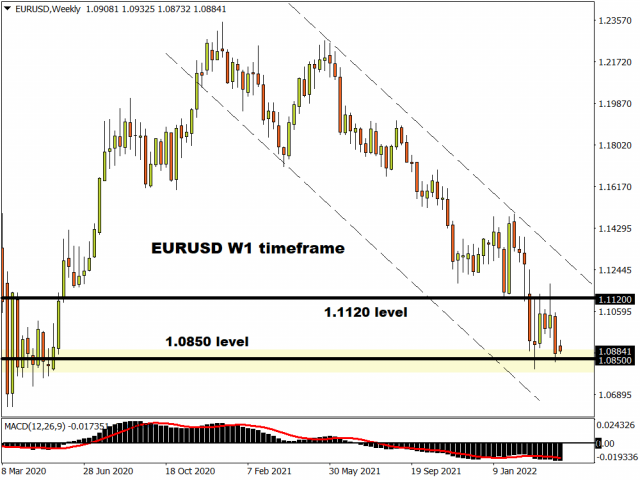
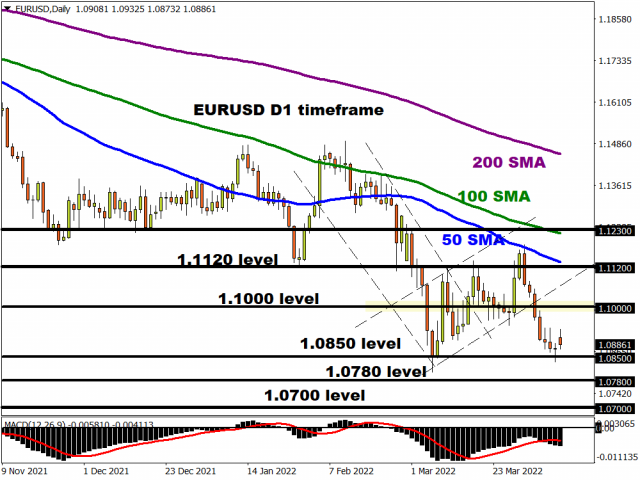
- Support levels: 1.0823, 1.0633
- Resistance levels: 1.0865, 1.0946, 1.0958, 1.1027, 1.1075, 1.1135, 1.1196, 1.1291
From the technical point of view, the trend on the EUR/USD currency pair in the hourly time frame is bearish. The price has adopted a more flat structure. The MACD indicator is in the negative zone, but signs of divergence are increasing. Under such market conditions, it is possible to look for buy trades on intraday timeframes from the support level of 1.0823, but only with short targets and confirmation. Sell trades should be considered from the resistance level of 1.0865 or 1.0945, but only after the additional confirmation.
Alternative scenario: if the price breaks out through the 1.1075 resistance level and fixes above, the uptrend will likely resume.

- – Eurozone Industrial Production (m/m) at 12:00 (GMT+3);
- – US Producer Price Index (m/m) at 15:30 (GMT+3).
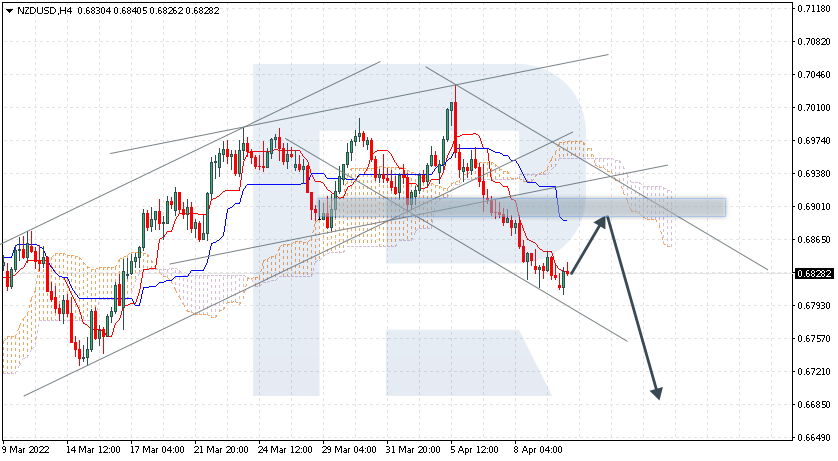
The GBP/USD currency pair
- Prev Open: 1.3030
- Prev Close: 1.3000
- % chg. over the last day: -0.23%
The annual UK consumer price index rose to 7.0%, and inflation rose by +0.8% over the last month. The core inflation index, excluding food and energy prices, also jumped from 5.2% to 5.7% year on year. Such a jump in consumer prices undoubtedly requires actions by the Bank of England.
- Support levels: 1.2976, 1.2863
- Resistance levels: 1.3060, 1.3107, 1.3144, 1.3181, 1.3244, 1.3274
On the hourly time frame, the GBP/USD currency pair trend is bearish. The price has taken a more flat structure. The MACD indicator has become inactive. Under such market conditions, sell trades should be looked for from the resistance level of 1.3060, but with confirmation. For buy deals, traders may consider the level of 1.2976 if the price shows bullish initiative.
Alternative scenario: if the price breaks down through the 1.3181 resistance level and fixes above, the mid-term uptrend will likely be resumed.

- – UK Consumer Price Index (m/m) at 09:00 (GMT+3);
- – UK Producer Price Index (m/m) at 09:00 (GMT+3).
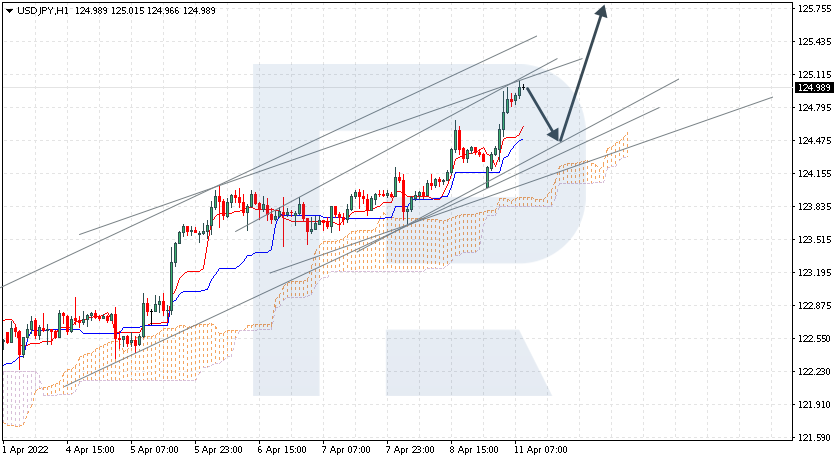
The USD/JPY currency pair
- Prev Open: 125.35
- Prev Close: 125.39
- % chg. over the last day: +0.03%
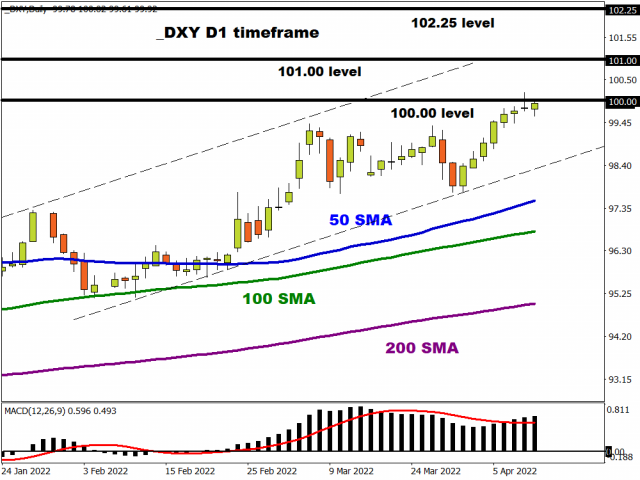
The fundamental picture for the Japanese yen remains unchanged. The Bank of Japan keeps government bond yields near zero, while US government bonds are rising. The monetary policy of the Bank of Japan is now “ultra-soft” and aims to decrease the national currency rate (USD/JPY growth). The US Fed will tighten monetary policy more aggressively. The dollar index rose to its highest level in almost two years. The medium-term forecast remains unchanged – analysts see a continuation of the uptrend, as the monetary policies of the central banks in the United States and Japan are now opposed.
- Support levels: 124.66, 124.24, 122.97, 122.63, 121.81
- Resistance levels: 125.82
The medium-term trend on the USD/JPY currency pair is bullish. The MACD indicator has become inactive, and buyer pressure is decreasing. But the price has deviated very much from the moving averages. Under such market conditions, it is best to look for buy deals, expecting the continuation of the uptrend, but after the price makes a pullback to the average lines. First of all, it is worth considering the support level of 124.66 or 124.24, but with additional confirmation. A resistance level of 125.82 may be considered for sell deals, but only after the seller’s initiative and only with short targets.
Alternative scenario: If the price fixes below 121.81, the uptrend will likely be broken.

- – Japan BOJ Gov Kuroda’s Speech at 09:15 (GMT+3).
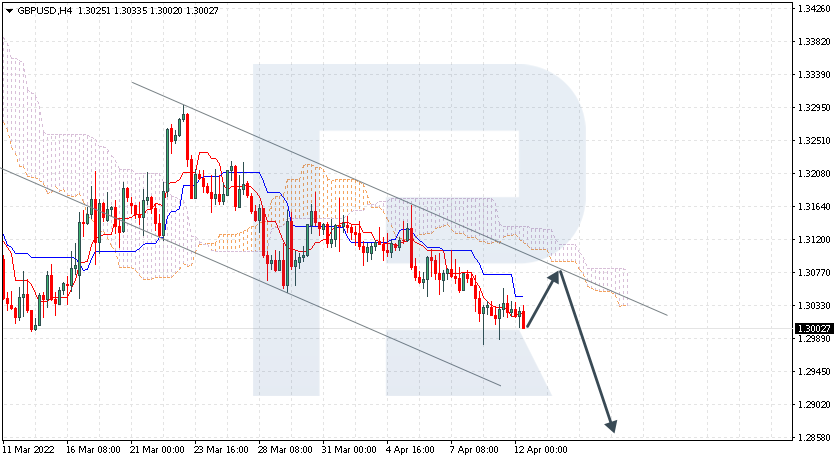
The USD/CAD currency pair
- Prev Open: 1.2627
- Prev Close: 1.2641
- % chg. over the last day: +0.11%
Central Bank of Canada’s interest rate meeting will take place today. Analysts expect to see the steepest rate hike in 22 years as policymakers worldwide begin to step up efforts to curb rising price pressures. The Canadian dollar is a commodity currency and is also highly dependent on changes in oil prices and the dollar index. Oil prices rose back above $100 a barrel on Tuesday as Shanghai’s efforts to ease some Covid-19 quarantine measures eased concerns about the impact on global demand.
- Support levels: 1.2560, 1.2476, 1.2430
- Resistance levels: 1.2631, 1.2713, 1.2754, 1.2851
In terms of technical analysis, the USD/CAD currency pair is bullish. The MACD indicator has become inactive. There are the first signs of sellers’ strength. Trade is worth it only with short targets because, fundamentally, there are no prerequisites for the medium-term trend on the USD/CAD currency pair. Under such market conditions, it is better to look for buy trades on the lower timeframes from the support level of 1.2560, but it is better with additional confirmation. For sell deals, it is better to consider the resistance level of 1.2631, but it is better with confirmation.
Alternative scenario: if the price breaks through and consolidates below 1.2430, the downtrend will likely be resumed.

- – Canada BoC Interest Rate Decision at 17:00 (GMT+3);
- – Canada BoC Monetary Policy Report at 17:00 (GMT+3);
- – US Crude Oil Reserves (w/w) at 17:30 (GMT+3);
- – Canada BoC Press Conference at 18:00 (GMT+3).
by JustForex
This article reflects a personal opinion and should not be interpreted as an investment advice, and/or offer, and/or a persistent request for carrying out financial transactions, and/or a guarantee, and/or a forecast of future events.