By InvestMacro | COT | Data Tables | COT Leaders | Downloads | COT Newsletter
Here are the latest charts and statistics for the Commitment of Traders (COT) data published by the Commodities Futures Trading Commission (CFTC).
The latest COT data is updated through Tuesday April 5th and shows a quick view of how large traders (for-profit speculators and commercial entities) were positioned in the futures markets. All currency positions are in direct relation to the US dollar where, for example, a bet for the euro is a bet that the euro will rise versus the dollar while a bet against the euro will be a bet that the euro will decline versus the dollar.
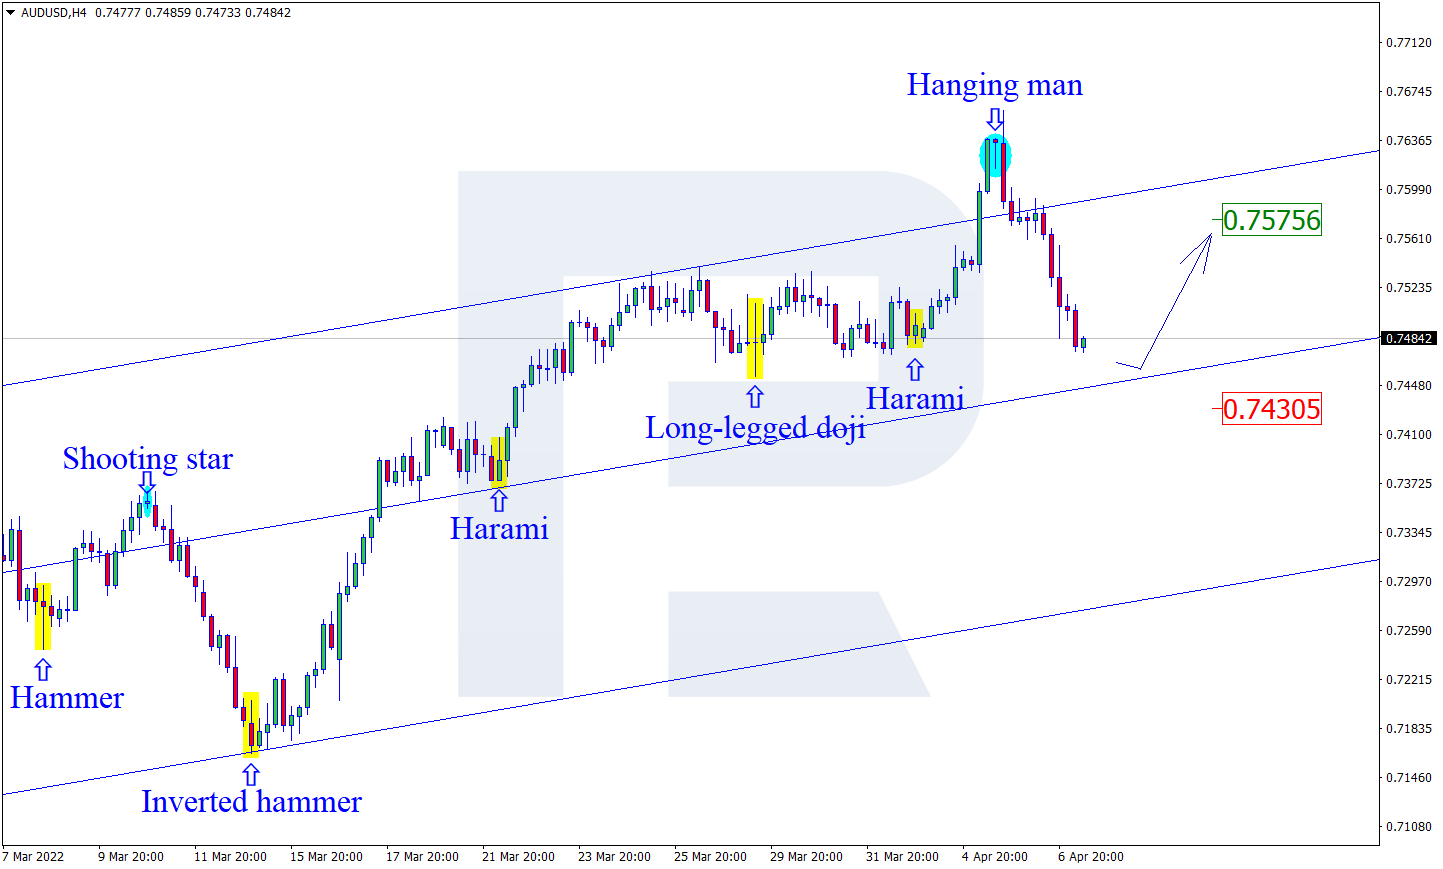
Highlighting the COT currency data was the further retreat of bearish bets in the Australian currency futures contracts. Australian dollar speculators reduced their bearish bets for a second straight week this week and for the sixth time in the past seven weeks. Over this seven-week time-frame, Aussie bets have improved by a total of +49,181 contracts, going from -86,694 net positions on February 15th to -37,513 net positions this week. This improvement in speculator sentiment has brought the current net position (-37,513 contracts) to the least bearish level of the past thirty-seven weeks, dating back to July 20th when the net position totaled -35,690 contracts. The speculator level for the Aussie has not registered a bullish or positive net weekly position since May 18th of 2021, a span of forty-seven weeks. Despite the bearish level of speculators, the AUD has been one of the stronger currencies over the past month and has been helped along by the outlook that the Reserve Bank of Australia will start to raise interest rates for the first time since 2010.
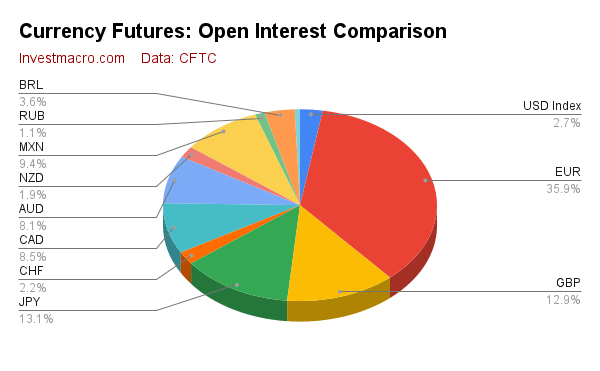
The currencies with higher speculator bets this week were the US Dollar Index (911 contracts), Australian dollar (12,093 contracts), Mexican peso (9,157 contracts), Euro (5,996 contracts), Brazil real (2,910 contracts), Canadian dollar (8,458 contracts) and Bitcoin (27 contracts).
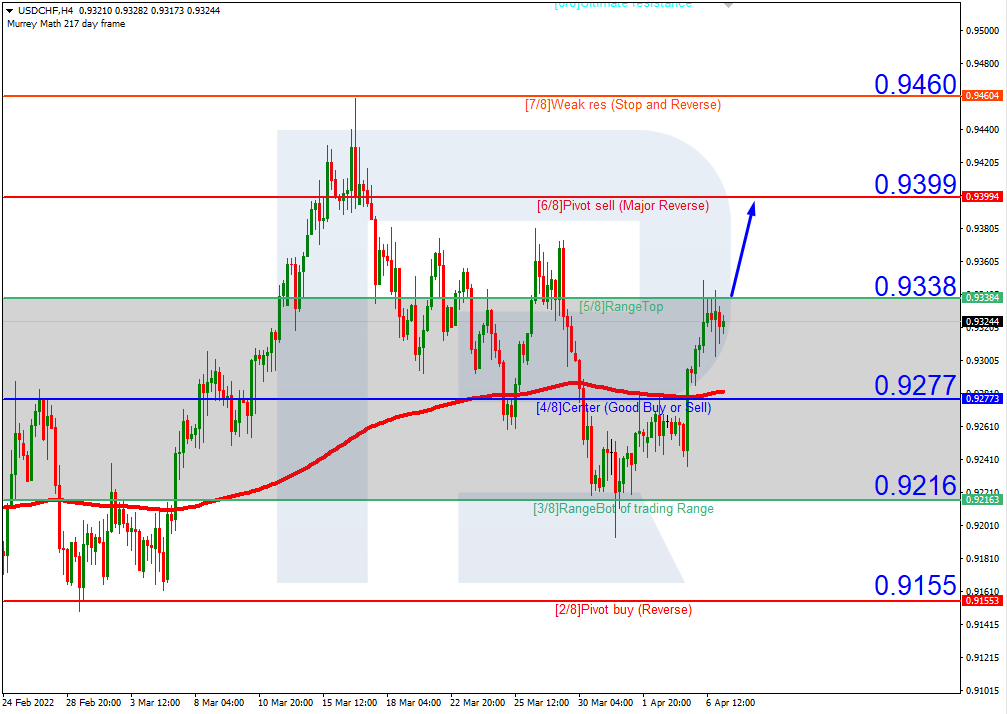
The currencies with declining bets were the Japanese yen (-1,698 contracts), Swiss franc (-814 contracts), British pound sterling (-1,688 contracts), New Zealand dollar (-702 contracts) and the Russian ruble (-263 contracts).
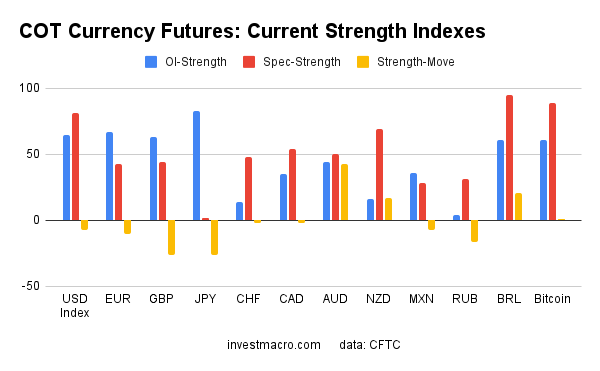 Speculator strength standings for each currency where strength index is current net position compared to past three years, above 80 is bullish extreme, below 20 is bearish extreme
OI Strength = Current Open Interest level compared to last 3 years range
Spec Strength = Current Net Speculator level compared to last 3 years range
Strength Move = Six week change of Spec Strength
| Apr-05-2022 | OI | OI-Index | Spec-Net | Spec-Index | Com-Net | COM-Index | Smalls-Net | Smalls-Index |
|---|
| USD Index | 49,049 | 65 | 31,852 | 81 | -35,194 | 16 | 3,342 | 53 |
| EUR | 663,589 | 67 | 27,370 | 43 | -49,617 | 62 | 22,247 | 11 |
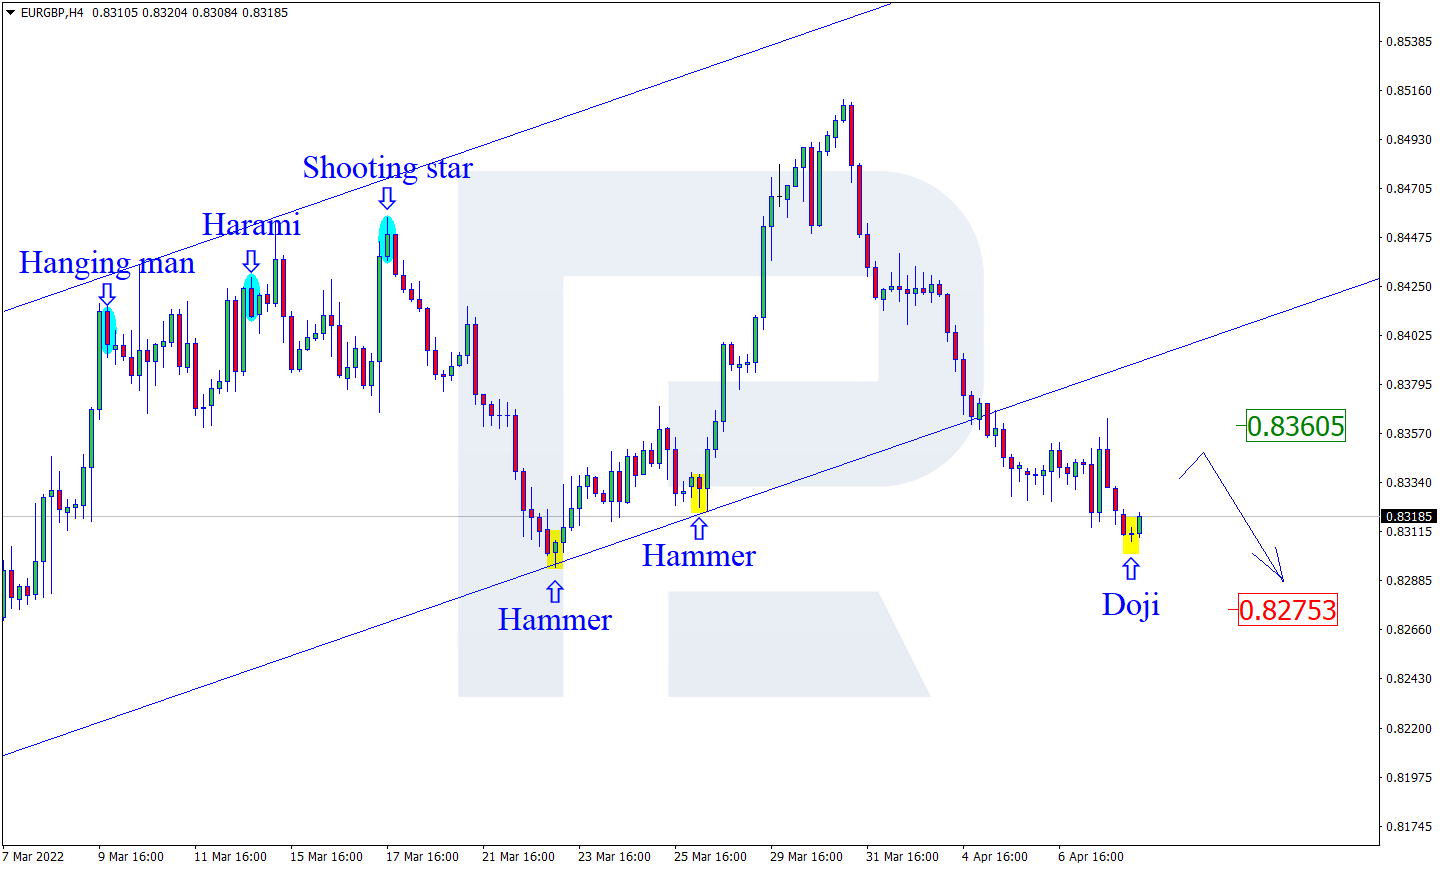
| GBP | 238,266 | 63 | -41,758 | 44 | 57,779 | 64 | -16,021 | 22 |
| JPY | 242,217 | 83 | -103,829 | 2 | 125,224 | 98 | -21,395 | 10 |
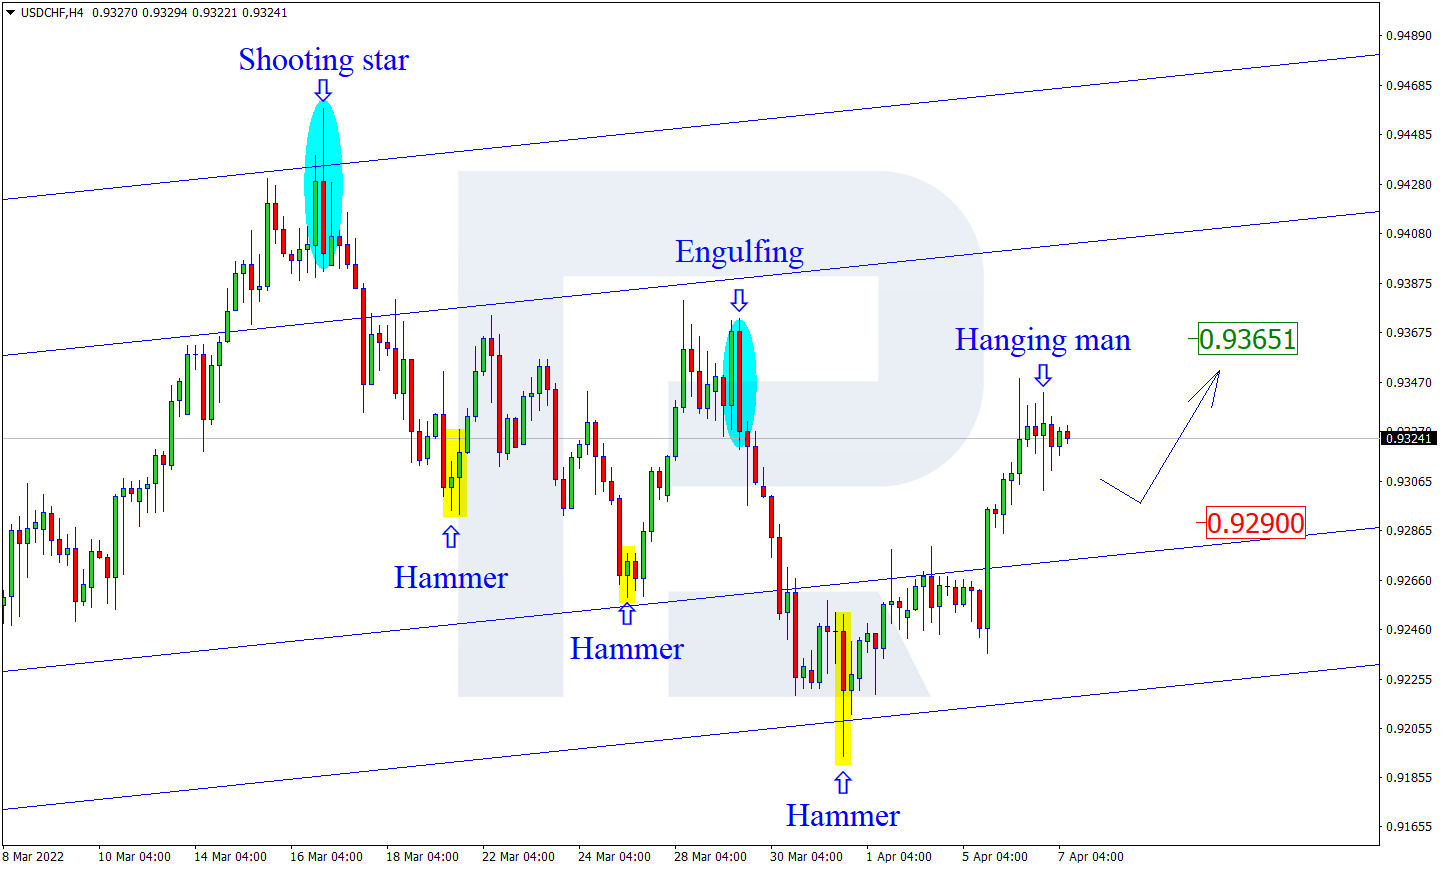
| CHF | 40,005 | 14 | -12,393 | 48 | 20,743 | 54 | -8,350 | 39 |
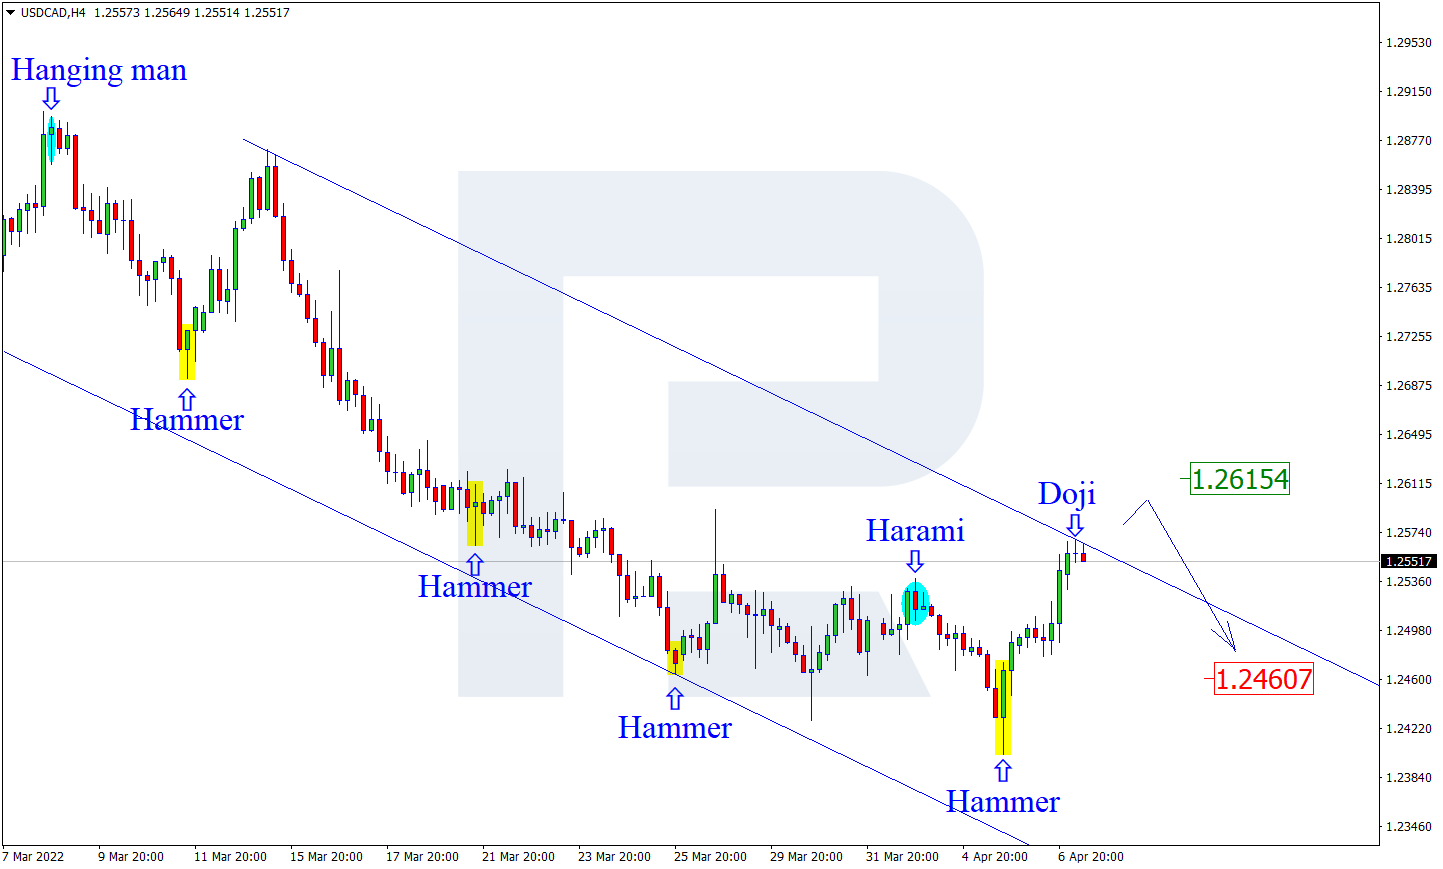
| CAD | 157,562 | 35 | 6,923 | 54 | -30,414 | 38 | 23,491 | 77 |
| AUD | 148,898 | 44 | -37,513 | 50 | 22,332 | 36 | 15,181 | 89 |
| NZD | 35,788 | 16 | -1,569 | 69 | 171 | 31 | 1,398 | 68 |
| MXN | 172,712 | 36 | 910 | 28 | -5,778 | 70 | 4,868 | 64 |
| RUB | 20,930 | 4 | 7,543 | 31 | -7,150 | 69 | -393 | 24 |
| BRL | 65,870 | 61 | 45,526 | 95 | -47,961 | 4 | 2,435 | 93 |
| Bitcoin | 11,374 | 61 | -244 | 89 | -397 | 0 | 641 | 28 |
US Dollar Index Futures:
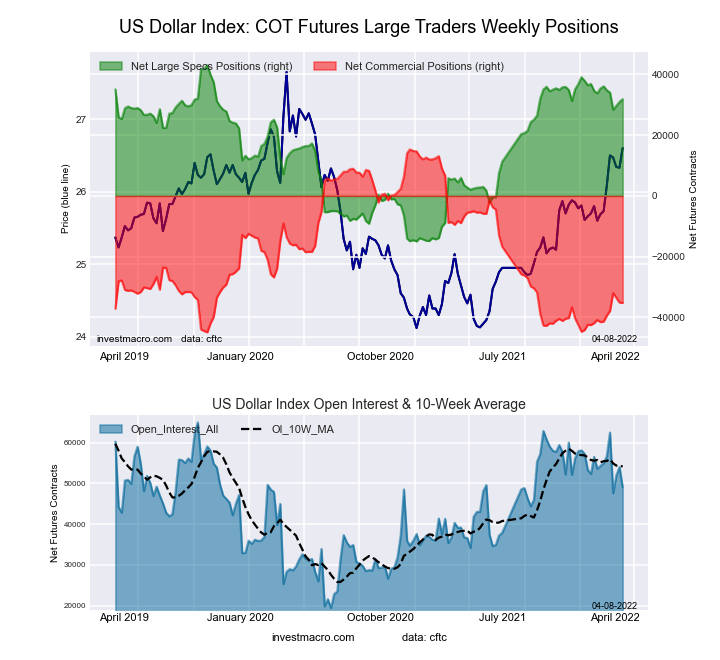 The US Dollar Index large speculator standing this week recorded a net position of 31,852 contracts in the data reported through Tuesday. This was a weekly boost of 911 contracts from the previous week which had a total of 30,941 net contracts.
This week’s current strength score (the trader positioning range over the past three years, measured from 0 to 100) shows the speculators are currently Bullish-Extreme with a score of 80.7 percent. The commercials are Bearish-Extreme with a score of 16.1 percent and the small traders (not shown in chart) are Bullish with a score of 53.1 percent.
| US DOLLAR INDEX Statistics | SPECULATORS | COMMERCIALS | SMALL TRADERS |
| – Percent of Open Interest Longs: | 83.7 | 2.9 | 10.7 |
| – Percent of Open Interest Shorts: | 18.7 | 74.6 | 3.9 |
| – Net Position: | 31,852 | -35,194 | 3,342 |
| – Gross Longs: | 41,038 | 1,417 | 5,243 |
| – Gross Shorts: | 9,186 | 36,611 | 1,901 |
| – Long to Short Ratio: | 4.5 to 1 | 0.0 to 1 | 2.8 to 1 |
| NET POSITION TREND: | | | |
| – Strength Index Score (3 Year Range Pct): | 80.7 | 16.1 | 53.1 |
| – Strength Index Reading (3 Year Range): | Bullish-Extreme | Bearish-Extreme | Bullish |
| NET POSITION MOVEMENT INDEX: | | | |
| – 6-Week Change in Strength Index: | -7.3 | 10.3 | -21.2 |
Euro Currency Futures:
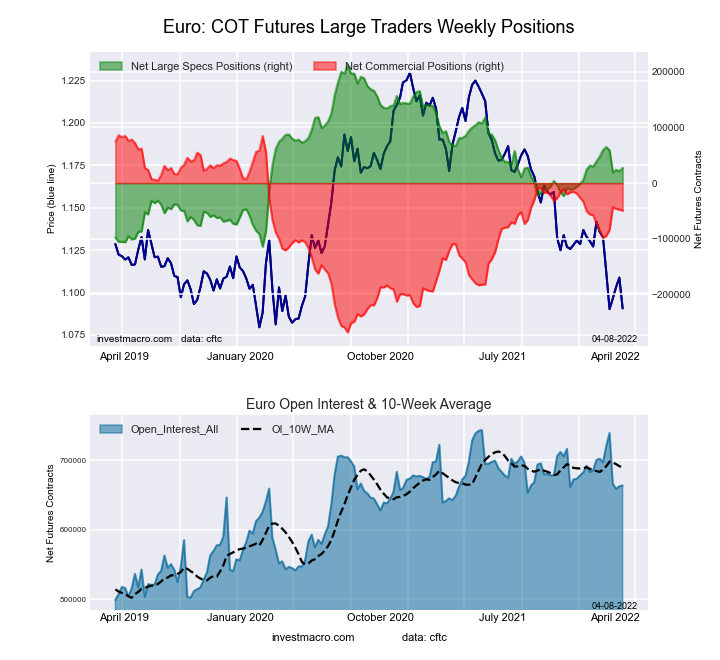 The Euro Currency large speculator standing this week recorded a net position of 27,370 contracts in the data reported through Tuesday. This was a weekly boost of 5,996 contracts from the previous week which had a total of 21,374 net contracts.
This week’s current strength score (the trader positioning range over the past three years, measured from 0 to 100) shows the speculators are currently Bearish with a score of 43.4 percent. The commercials are Bullish with a score of 61.7 percent and the small traders (not shown in chart) are Bearish-Extreme with a score of 11.3 percent.
| EURO Currency Statistics | SPECULATORS | COMMERCIALS | SMALL TRADERS |
| – Percent of Open Interest Longs: | 31.8 | 53.8 | 11.7 |
| – Percent of Open Interest Shorts: | 27.7 | 61.3 | 8.4 |
| – Net Position: | 27,370 | -49,617 | 22,247 |
| – Gross Longs: | 210,914 | 357,140 | 77,946 |
| – Gross Shorts: | 183,544 | 406,757 | 55,699 |
| – Long to Short Ratio: | 1.1 to 1 | 0.9 to 1 | 1.4 to 1 |
| NET POSITION TREND: | | | |
| – Strength Index Score (3 Year Range Pct): | 43.4 | 61.7 | 11.3 |
| – Strength Index Reading (3 Year Range): | Bearish | Bullish | Bearish-Extreme |
| NET POSITION MOVEMENT INDEX: | | | |
| – 6-Week Change in Strength Index: | -9.8 | 13.7 | -27.3 |
British Pound Sterling Futures:
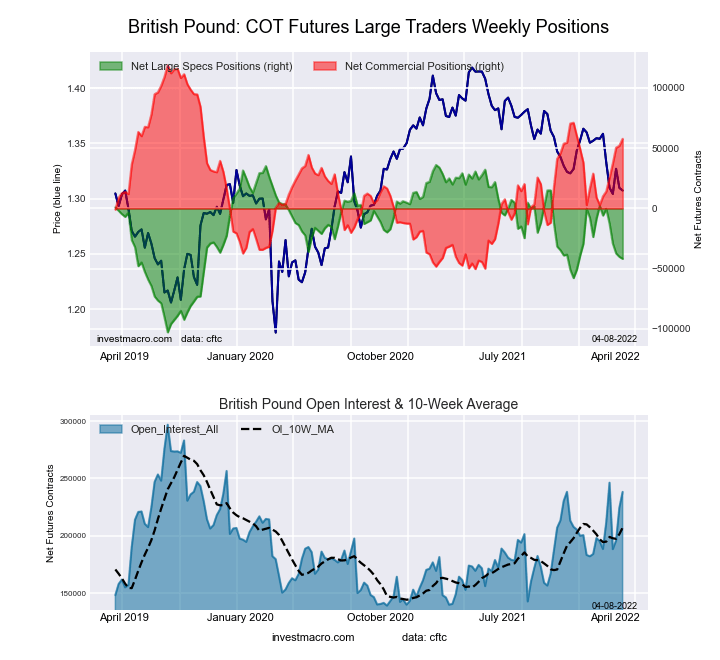 The British Pound Sterling large speculator standing this week recorded a net position of -41,758 contracts in the data reported through Tuesday. This was a weekly lowering of -1,688 contracts from the previous week which had a total of -40,070 net contracts.
This week’s current strength score (the trader positioning range over the past three years, measured from 0 to 100) shows the speculators are currently Bearish with a score of 43.9 percent. The commercials are Bullish with a score of 63.9 percent and the small traders (not shown in chart) are Bearish with a score of 22.4 percent.
| BRITISH POUND Statistics | SPECULATORS | COMMERCIALS | SMALL TRADERS |
| – Percent of Open Interest Longs: | 15.1 | 73.6 | 8.4 |
| – Percent of Open Interest Shorts: | 32.6 | 49.4 | 15.1 |
| – Net Position: | -41,758 | 57,779 | -16,021 |
| – Gross Longs: | 35,873 | 175,429 | 19,923 |
| – Gross Shorts: | 77,631 | 117,650 | 35,944 |
| – Long to Short Ratio: | 0.5 to 1 | 1.5 to 1 | 0.6 to 1 |
| NET POSITION TREND: | | | |
| – Strength Index Score (3 Year Range Pct): | 43.9 | 63.9 | 22.4 |
| – Strength Index Reading (3 Year Range): | Bearish | Bullish | Bearish |
| NET POSITION MOVEMENT INDEX: | | | |
| – 6-Week Change in Strength Index: | -25.9 | 28.2 | -24.4 |
Japanese Yen Futures:
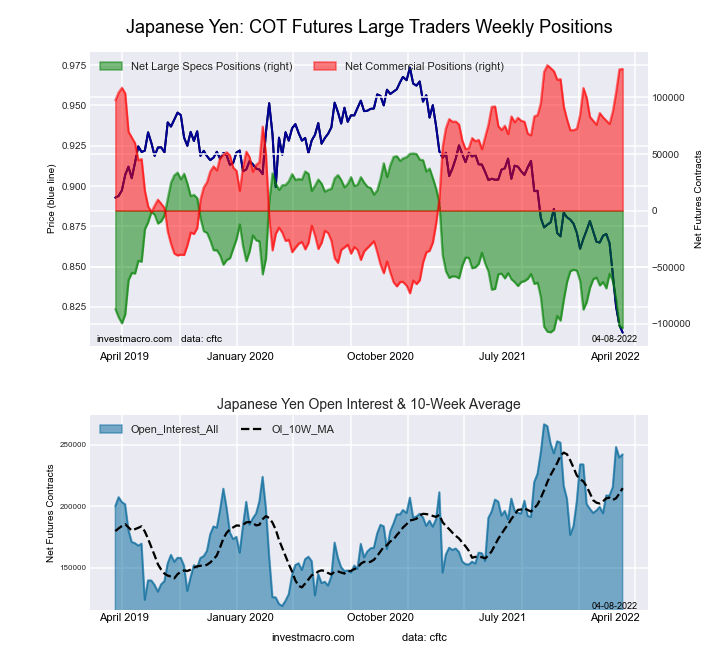 The Japanese Yen large speculator standing this week recorded a net position of -103,829 contracts in the data reported through Tuesday. This was a weekly reduction of -1,698 contracts from the previous week which had a total of -102,131 net contracts.
This week’s current strength score (the trader positioning range over the past three years, measured from 0 to 100) shows the speculators are currently Bearish-Extreme with a score of 2.4 percent. The commercials are Bullish-Extreme with a score of 98.4 percent and the small traders (not shown in chart) are Bearish-Extreme with a score of 10.0 percent.
| JAPANESE YEN Statistics | SPECULATORS | COMMERCIALS | SMALL TRADERS |
| – Percent of Open Interest Longs: | 6.0 | 84.7 | 7.9 |
| – Percent of Open Interest Shorts: | 48.9 | 33.0 | 16.8 |
| – Net Position: | -103,829 | 125,224 | -21,395 |
| – Gross Longs: | 14,583 | 205,209 | 19,190 |
| – Gross Shorts: | 118,412 | 79,985 | 40,585 |
| – Long to Short Ratio: | 0.1 to 1 | 2.6 to 1 | 0.5 to 1 |
| NET POSITION TREND: | | | |
| – Strength Index Score (3 Year Range Pct): | 2.4 | 98.4 | 10.0 |
| – Strength Index Reading (3 Year Range): | Bearish-Extreme | Bullish-Extreme | Bearish-Extreme |
| NET POSITION MOVEMENT INDEX: | | | |
| – 6-Week Change in Strength Index: | -25.7 | 21.2 | -4.3 |
Swiss Franc Futures:
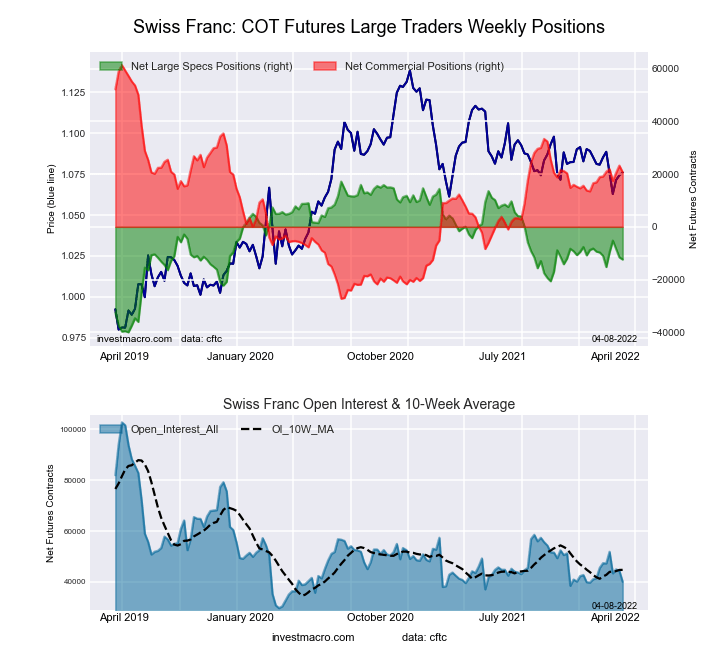 The Swiss Franc large speculator standing this week recorded a net position of -12,393 contracts in the data reported through Tuesday. This was a weekly reduction of -814 contracts from the previous week which had a total of -11,579 net contracts.
This week’s current strength score (the trader positioning range over the past three years, measured from 0 to 100) shows the speculators are currently Bearish with a score of 48.3 percent. The commercials are Bullish with a score of 54.2 percent and the small traders (not shown in chart) are Bearish with a score of 38.8 percent.
| SWISS FRANC Statistics | SPECULATORS | COMMERCIALS | SMALL TRADERS |
| – Percent of Open Interest Longs: | 4.6 | 73.5 | 21.7 |
| – Percent of Open Interest Shorts: | 35.6 | 21.6 | 42.6 |
| – Net Position: | -12,393 | 20,743 | -8,350 |
| – Gross Longs: | 1,860 | 29,392 | 8,694 |
| – Gross Shorts: | 14,253 | 8,649 | 17,044 |
| – Long to Short Ratio: | 0.1 to 1 | 3.4 to 1 | 0.5 to 1 |
| NET POSITION TREND: | | | |
| – Strength Index Score (3 Year Range Pct): | 48.3 | 54.2 | 38.8 |
| – Strength Index Reading (3 Year Range): | Bearish | Bullish | Bearish |
| NET POSITION MOVEMENT INDEX: | | | |
| – 6-Week Change in Strength Index: | -2.5 | 1.8 | -0.7 |
Canadian Dollar Futures:
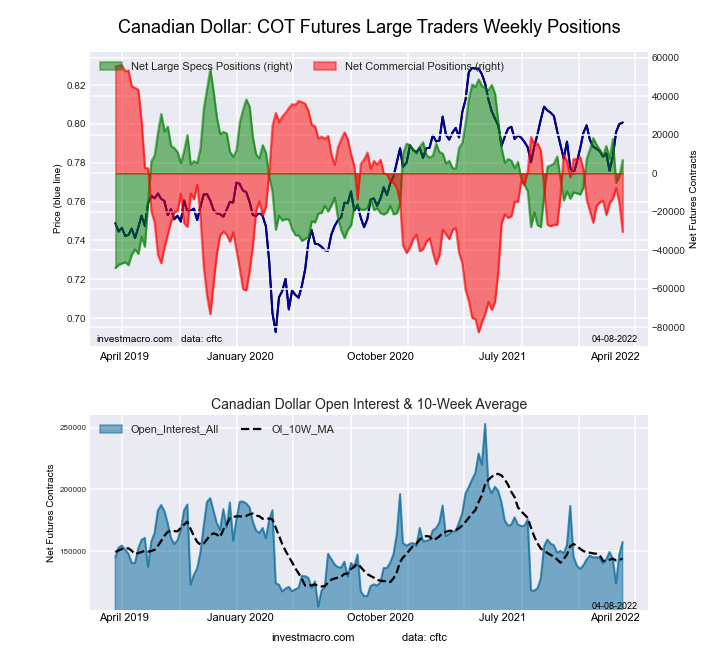 The Canadian Dollar large speculator standing this week recorded a net position of 6,923 contracts in the data reported through Tuesday. This was a weekly increase of 8,458 contracts from the previous week which had a total of -1,535 net contracts.
This week’s current strength score (the trader positioning range over the past three years, measured from 0 to 100) shows the speculators are currently Bullish with a score of 54.4 percent. The commercials are Bearish with a score of 37.6 percent and the small traders (not shown in chart) are Bullish with a score of 76.6 percent.
| CANADIAN DOLLAR Statistics | SPECULATORS | COMMERCIALS | SMALL TRADERS |
| – Percent of Open Interest Longs: | 23.7 | 49.4 | 26.0 |
| – Percent of Open Interest Shorts: | 19.3 | 68.7 | 11.1 |
| – Net Position: | 6,923 | -30,414 | 23,491 |
| – Gross Longs: | 37,325 | 77,906 | 40,906 |
| – Gross Shorts: | 30,402 | 108,320 | 17,415 |
| – Long to Short Ratio: | 1.2 to 1 | 0.7 to 1 | 2.3 to 1 |
| NET POSITION TREND: | | | |
| – Strength Index Score (3 Year Range Pct): | 54.4 | 37.6 | 76.6 |
| – Strength Index Reading (3 Year Range): | Bullish | Bearish | Bullish |
| NET POSITION MOVEMENT INDEX: | | | |
| – 6-Week Change in Strength Index: | -2.3 | -11.7 | 37.0 |
Australian Dollar Futures:
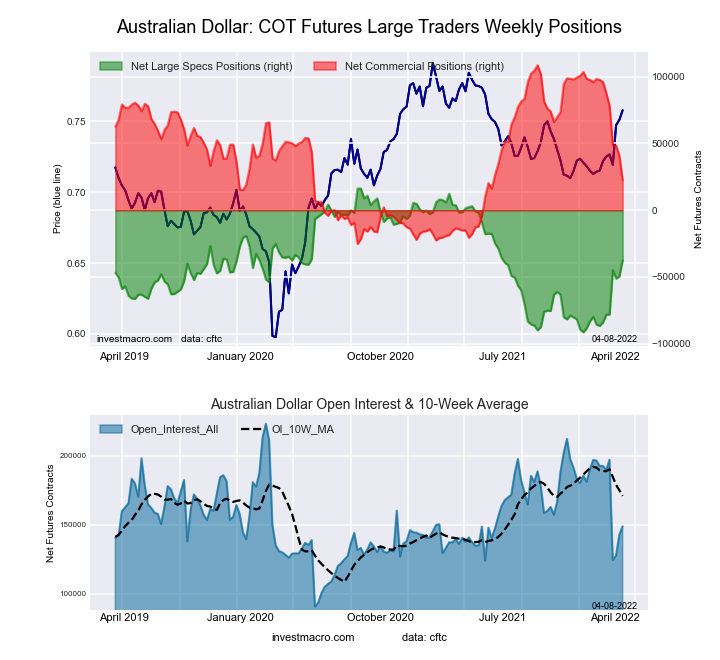 The Australian Dollar large speculator standing this week recorded a net position of -37,513 contracts in the data reported through Tuesday. This was a weekly advance of 12,093 contracts from the previous week which had a total of -49,606 net contracts.
This week’s current strength score (the trader positioning range over the past three years, measured from 0 to 100) shows the speculators are currently Bullish with a score of 50.1 percent. The commercials are Bearish with a score of 35.5 percent and the small traders (not shown in chart) are Bullish-Extreme with a score of 89.5 percent.
| AUSTRALIAN DOLLAR Statistics | SPECULATORS | COMMERCIALS | SMALL TRADERS |
| – Percent of Open Interest Longs: | 23.4 | 53.9 | 21.7 |
| – Percent of Open Interest Shorts: | 48.6 | 38.9 | 11.5 |
| – Net Position: | -37,513 | 22,332 | 15,181 |
| – Gross Longs: | 34,871 | 80,207 | 32,313 |
| – Gross Shorts: | 72,384 | 57,875 | 17,132 |
| – Long to Short Ratio: | 0.5 to 1 | 1.4 to 1 | 1.9 to 1 |
| NET POSITION TREND: | | | |
| – Strength Index Score (3 Year Range Pct): | 50.1 | 35.5 | 89.5 |
| – Strength Index Reading (3 Year Range): | Bullish | Bearish | Bullish-Extreme |
| NET POSITION MOVEMENT INDEX: | | | |
| – 6-Week Change in Strength Index: | 43.2 | -55.1 | 66.3 |
New Zealand Dollar Futures:
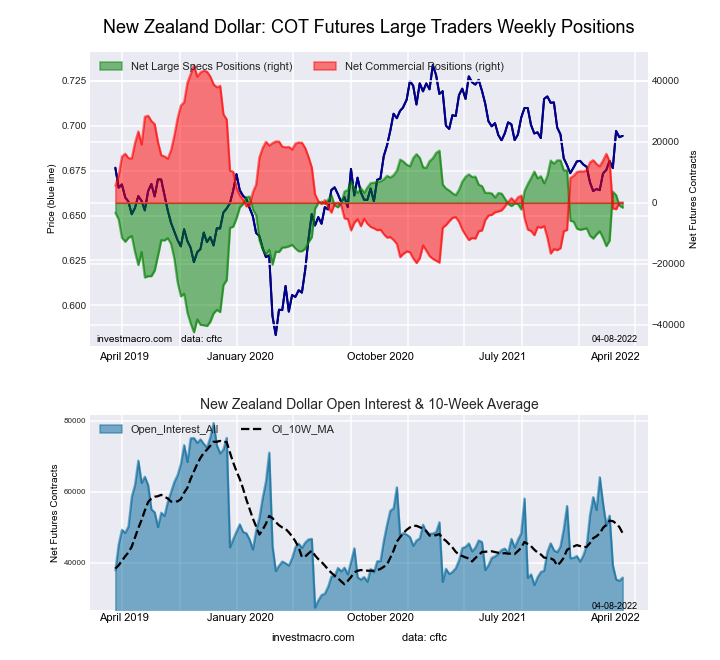 The New Zealand Dollar large speculator standing this week recorded a net position of -1,569 contracts in the data reported through Tuesday. This was a weekly decline of -702 contracts from the previous week which had a total of -867 net contracts.
This week’s current strength score (the trader positioning range over the past three years, measured from 0 to 100) shows the speculators are currently Bullish with a score of 68.6 percent. The commercials are Bearish with a score of 30.7 percent and the small traders (not shown in chart) are Bullish with a score of 67.8 percent.
| NEW ZEALAND DOLLAR Statistics | SPECULATORS | COMMERCIALS | SMALL TRADERS |
| – Percent of Open Interest Longs: | 43.1 | 44.3 | 12.0 |
| – Percent of Open Interest Shorts: | 47.5 | 43.8 | 8.1 |
| – Net Position: | -1,569 | 171 | 1,398 |
| – Gross Longs: | 15,428 | 15,863 | 4,311 |
| – Gross Shorts: | 16,997 | 15,692 | 2,913 |
| – Long to Short Ratio: | 0.9 to 1 | 1.0 to 1 | 1.5 to 1 |
| NET POSITION TREND: | | | |
| – Strength Index Score (3 Year Range Pct): | 68.6 | 30.7 | 67.8 |
| – Strength Index Reading (3 Year Range): | Bullish | Bearish | Bullish |
| NET POSITION MOVEMENT INDEX: | | | |
| – 6-Week Change in Strength Index: | 16.7 | -21.2 | 43.0 |
Mexican Peso Futures:
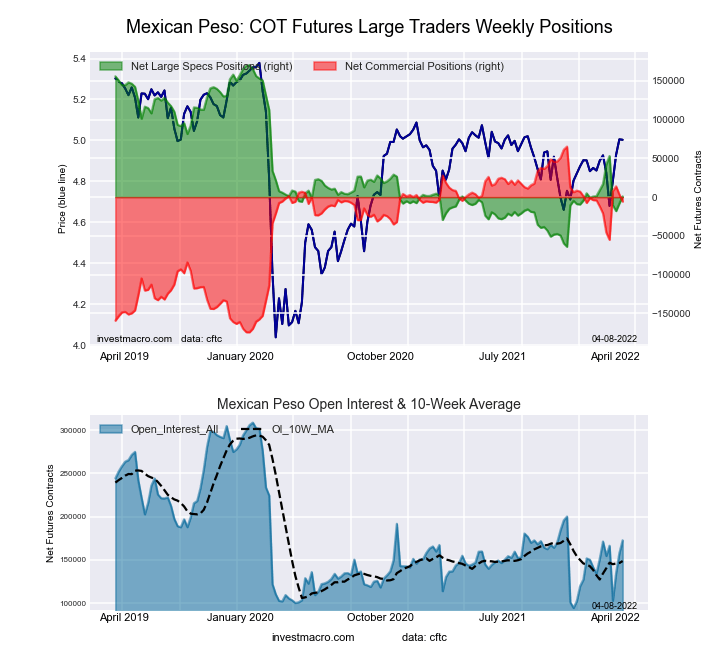 The Mexican Peso large speculator standing this week recorded a net position of 910 contracts in the data reported through Tuesday. This was a weekly advance of 9,157 contracts from the previous week which had a total of -8,247 net contracts.
This week’s current strength score (the trader positioning range over the past three years, measured from 0 to 100) shows the speculators are currently Bearish with a score of 27.7 percent. The commercials are Bullish with a score of 70.4 percent and the small traders (not shown in chart) are Bullish with a score of 63.7 percent.
| MEXICAN PESO Statistics | SPECULATORS | COMMERCIALS | SMALL TRADERS |
| – Percent of Open Interest Longs: | 45.6 | 49.6 | 4.5 |
| – Percent of Open Interest Shorts: | 45.1 | 53.0 | 1.6 |
| – Net Position: | 910 | -5,778 | 4,868 |
| – Gross Longs: | 78,728 | 85,690 | 7,698 |
| – Gross Shorts: | 77,818 | 91,468 | 2,830 |
| – Long to Short Ratio: | 1.0 to 1 | 0.9 to 1 | 2.7 to 1 |
| NET POSITION TREND: | | | |
| – Strength Index Score (3 Year Range Pct): | 27.7 | 70.4 | 63.7 |
| – Strength Index Reading (3 Year Range): | Bearish | Bullish | Bullish |
| NET POSITION MOVEMENT INDEX: | | | |
| – 6-Week Change in Strength Index: | -6.8 | 6.4 | 2.8 |
Brazilian Real Futures:
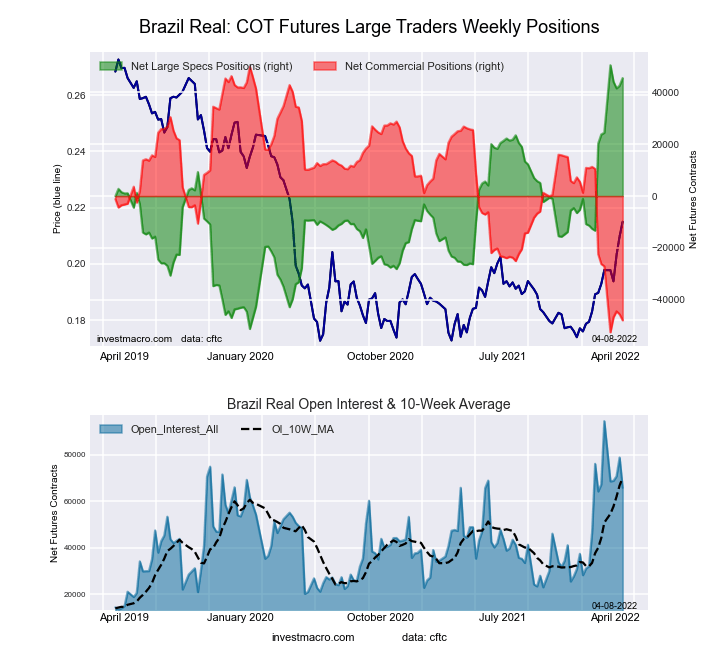 The Brazilian Real large speculator standing this week recorded a net position of 45,526 contracts in the data reported through Tuesday. This was a weekly lift of 2,910 contracts from the previous week which had a total of 42,616 net contracts.
This week’s current strength score (the trader positioning range over the past three years, measured from 0 to 100) shows the speculators are currently Bullish-Extreme with a score of 95.1 percent. The commercials are Bearish-Extreme with a score of 4.5 percent and the small traders (not shown in chart) are Bullish-Extreme with a score of 93.3 percent.
| BRAZIL REAL Statistics | SPECULATORS | COMMERCIALS | SMALL TRADERS |
| – Percent of Open Interest Longs: | 76.7 | 16.4 | 6.6 |
| – Percent of Open Interest Shorts: | 7.6 | 89.2 | 2.9 |
| – Net Position: | 45,526 | -47,961 | 2,435 |
| – Gross Longs: | 50,518 | 10,795 | 4,319 |
| – Gross Shorts: | 4,992 | 58,756 | 1,884 |
| – Long to Short Ratio: | 10.1 to 1 | 0.2 to 1 | 2.3 to 1 |
| NET POSITION TREND: | | | |
| – Strength Index Score (3 Year Range Pct): | 95.1 | 4.5 | 93.3 |
| – Strength Index Reading (3 Year Range): | Bullish-Extreme | Bearish-Extreme | Bullish-Extreme |
| NET POSITION MOVEMENT INDEX: | | | |
| – 6-Week Change in Strength Index: | 20.7 | -20.4 | -2.4 |
Russian Ruble Futures:
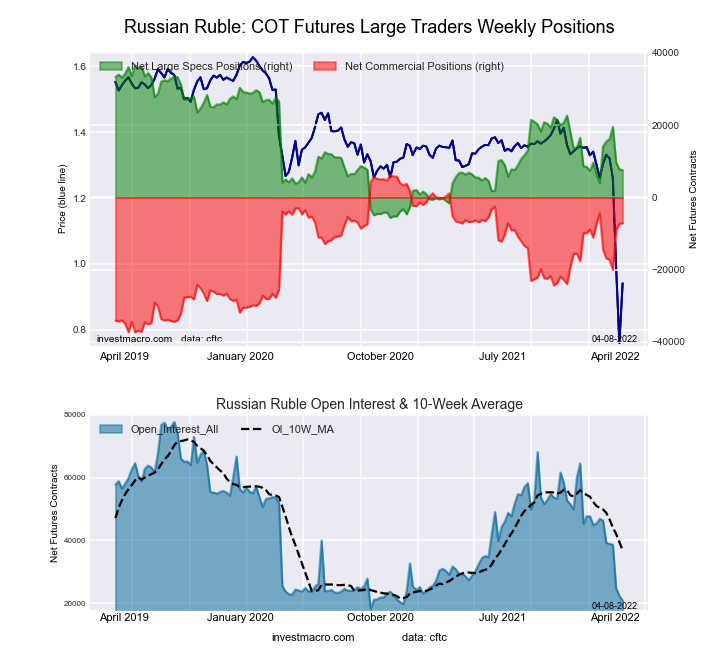 The Russian Ruble large speculator standing this week recorded a net position of 7,543 contracts in the data reported through Tuesday. This was a weekly fall of -263 contracts from the previous week which had a total of 7,806 net contracts.
This week’s current strength score (the trader positioning range over the past three years, measured from 0 to 100) shows the speculators are currently Bearish with a score of 31.2 percent. The commercials are Bullish with a score of 69.1 percent and the small traders (not shown in chart) are Bearish with a score of 23.9 percent.
| RUSSIAN RUBLE Statistics | SPECULATORS | COMMERCIALS | SMALL TRADERS |
| – Percent of Open Interest Longs: | 36.6 | 60.6 | 2.8 |
| – Percent of Open Interest Shorts: | 0.5 | 94.7 | 4.7 |
| – Net Position: | 7,543 | -7,150 | -393 |
| – Gross Longs: | 7,658 | 12,679 | 593 |
| – Gross Shorts: | 115 | 19,829 | 986 |
| – Long to Short Ratio: | 66.6 to 1 | 0.6 to 1 | 0.6 to 1 |
| NET POSITION TREND: | | | |
| – Strength Index Score (3 Year Range Pct): | 31.2 | 69.1 | 23.9 |
| – Strength Index Reading (3 Year Range): | Bearish | Bullish | Bearish |
| NET POSITION MOVEMENT INDEX: | | | |
| – 6-Week Change in Strength Index: | -15.6 | 16.7 | -18.8 |
Bitcoin Futures:
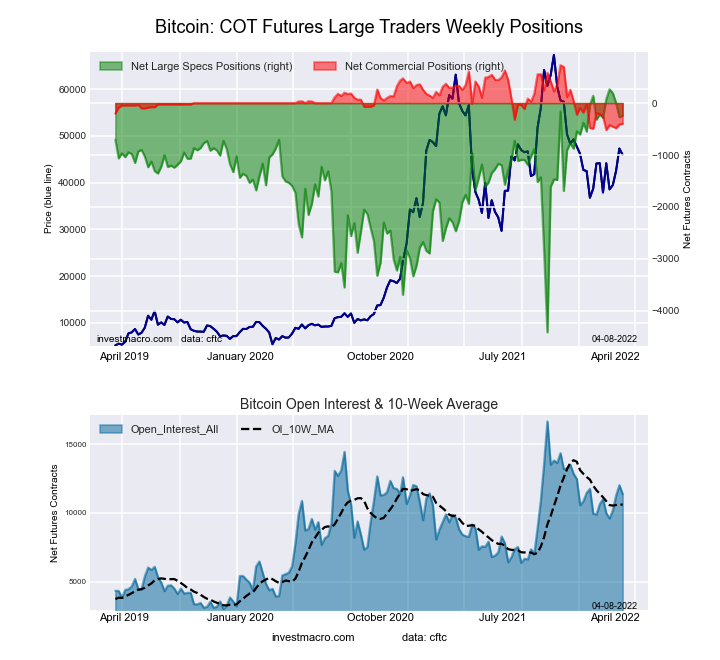 The Bitcoin large speculator standing this week recorded a net position of -244 contracts in the data reported through Tuesday. This was a weekly lift of 27 contracts from the previous week which had a total of -271 net contracts.
This week’s current strength score (the trader positioning range over the past three years, measured from 0 to 100) shows the speculators are currently Bullish-Extreme with a score of 89.1 percent. The commercials are Bearish-Extreme with a score of 9.6 percent and the small traders (not shown in chart) are Bearish with a score of 27.5 percent.
| BITCOIN Statistics | SPECULATORS | COMMERCIALS | SMALL TRADERS |
| – Percent of Open Interest Longs: | 77.5 | 3.8 | 11.6 |
| – Percent of Open Interest Shorts: | 79.6 | 7.3 | 6.0 |
| – Net Position: | -244 | -397 | 641 |
| – Gross Longs: | 8,811 | 437 | 1,322 |
| – Gross Shorts: | 9,055 | 834 | 681 |
| – Long to Short Ratio: | 1.0 to 1 | 0.5 to 1 | 1.9 to 1 |
| NET POSITION TREND: | | | |
| – Strength Index Score (3 Year Range Pct): | 89.1 | 9.6 | 27.5 |
| – Strength Index Reading (3 Year Range): | Bullish-Extreme | Bearish-Extreme | Bearish |
| NET POSITION MOVEMENT INDEX: | | | |
| – 6-Week Change in Strength Index: | 0.8 | -11.3 | 2.3 |
Article By InvestMacro – Receive our weekly COT Reports by Email
*COT Report: The COT data, released weekly to the public each Friday, is updated through the most recent Tuesday (data is 3 days old) and shows a quick view of how large speculators or non-commercials (for-profit traders) were positioned in the futures markets.
The CFTC categorizes trader positions according to commercial hedgers (traders who use futures contracts for hedging as part of the business), non-commercials (large traders who speculate to realize trading profits) and nonreportable traders (usually small traders/speculators) as well as their open interest (contracts open in the market at time of reporting).See CFTC criteria here.


