By InvestMacro | COT | Data Tables | COT Leaders | Downloads | COT Newsletter

Here are the latest charts and statistics for this week’s Commitment of Traders (COT) data published by the Commodities Futures Trading Commission (CFTC).
The latest COT data is updated through Tuesday May 10th and shows a quick view of how large traders (for-profit speculators and commercial entities) were positioned in the futures markets. All currency positions are in direct relation to the US dollar where, for example, a bet for the euro is a bet that the euro will rise versus the dollar while a bet against the euro will be a bet that the euro will decline versus the dollar.
Highlighting the COT currency data this week was the rise in bearish bets for the British pound sterling currency futures contracts. Pound speculators have raised their bearish bets for a tenth consecutive week this week and for the eleventh time out of the past twelve weeks. Over the past ten-week time-frame, pound bets have dropped by a total of -79,261 contracts, going from -337 net positions on March 1st to a total of -79,598 net positions this week. The deterioration in speculator sentiment has now pushed the pound net position to the most bearish standing of the past one hundred and thirty-seven weeks, dating back to September 24th of 2019.
Pound sterling sentiment has been hit by a recent slowing economy as the UK GDP declined by 0.1 percent in March after flat growth in February. Also, weighing on the UK economy is the war in Ukraine that has sharply raised inflation in the country (and elsewhere) and which could see the UK economy with the lowest growth rate among G7 countries in 2023, according to the IMF.
Overall, the currencies with higher speculator bets this week were the Euro (22,907 contracts), US Dollar Index (1,705 contracts), Bitcoin (315 contracts) and the Mexican peso (2,102 contracts).
The currencies with declining bets were the Japanese yen (-9,660 contracts), Australian dollar (-13,198 contracts), Brazil real (-1,010 contracts), Swiss franc (-1,856 contracts), British pound sterling (-5,785 contracts), New Zealand dollar (-6,386 contracts), Canadian dollar (-14,436 contracts), Russian ruble (-263 contracts) and the Mexican peso (2,102 contracts).

Speculator strength standings for each Commodity where strength index is current net position compared to past three years, above 80 is bullish extreme, below 20 is bearish extreme OI Strength = Current Open Interest level compared to last 3 years range Spec Strength = Current Net Speculator level compared to last 3 years range Strength Move = Six week change of Spec Strength
| May-10-2022 | OI | OI-Index | Spec-Net | Spec-Index | Com-Net | COM-Index | Smalls-Net | Smalls-Index |
|---|
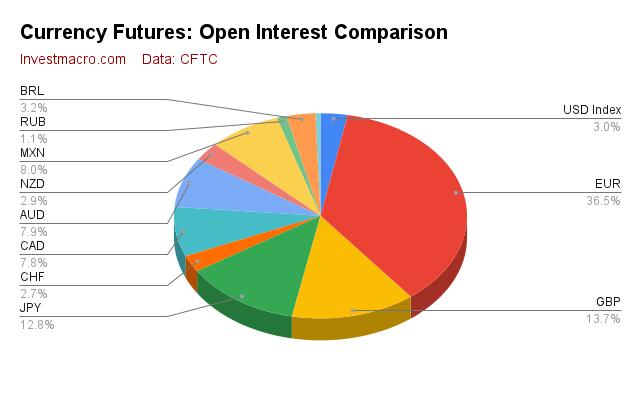
| USD Index | 57,556 | 84 | 34,776 | 86 | -37,174 | 13 | 2,398 | 43 |
| EUR | 705,046 | 84 | 16,529 | 40 | -43,026 | 64 | 26,497 | 18 |
| GBP | 264,594 | 80 | -79,598 | 17 | 95,245 | 86 | -15,647 | 23 |
| JPY | 247,278 | 87 | -110,454 | 1 | 124,927 | 97 | -14,473 | 24 |
| CHF | 51,282 | 37 | -15,763 | 40 | 29,819 | 69 | -14,056 | 16 |
| CAD | 151,009 | 31 | -5,407 | 38 | 2,939 | 67 | 2,468 | 35 |
| AUD | 153,209 | 47 | -41,714 | 46 | 47,126 | 54 | -5,412 | 39 |
| NZD | 56,235 | 56 | -12,996 | 49 | 16,874 | 56 | -3,878 | 7 |
| MXN | 153,858 | 28 | 16,725 | 34 | -20,866 | 64 | 4,141 | 61 |
| RUB | 20,930 | 4 | 7,543 | 31 | -7,150 | 69 | -393 | 24 |
| BRL | 61,450 | 55 | 40,778 | 90 | -42,031 | 10 | 1,253 | 79 |
| Bitcoin | 10,841 | 57 | 703 | 100 | -789 | 0 | 86 | 15 |
Open Interest is the amount of contracts that were live in the marketplace at time of data.
US Dollar Index Futures:
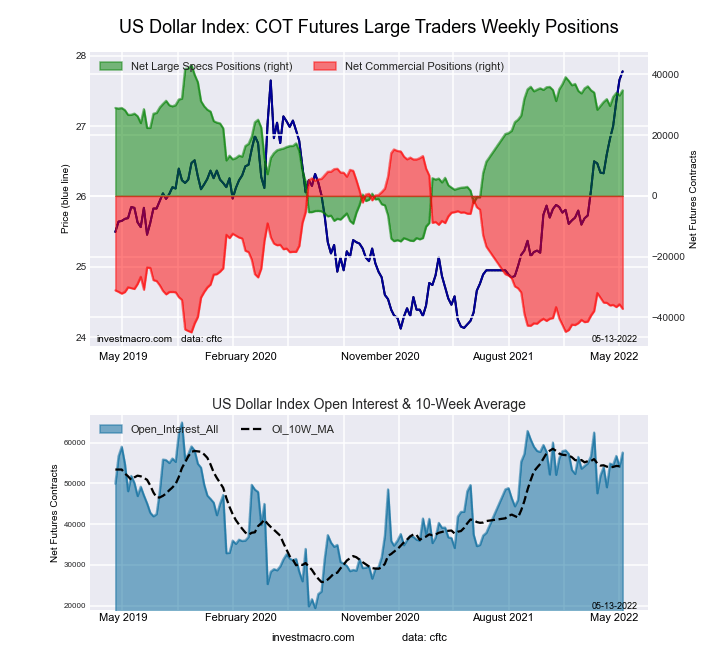 The US Dollar Index large speculator standing this week came in at a net position of 34,776 contracts in the data reported through Tuesday. This was a weekly lift of 1,705 contracts from the previous week which had a total of 33,071 net contracts.
This week’s current strength score (the trader positioning range over the past three years, measured from 0 to 100) shows the speculators are currently Bullish-Extreme with a score of 85.8 percent. The commercials are Bearish-Extreme with a score of 12.8 percent and the small traders (not shown in chart) are Bearish with a score of 42.8 percent.
| US DOLLAR INDEX Statistics | SPECULATORS | COMMERCIALS | SMALL TRADERS |
| – Percent of Open Interest Longs: | 86.6 | 3.2 | 8.6 |
| – Percent of Open Interest Shorts: | 26.2 | 67.8 | 4.5 |
| – Net Position: | 34,776 | -37,174 | 2,398 |
| – Gross Longs: | 49,864 | 1,837 | 4,970 |
| – Gross Shorts: | 15,088 | 39,011 | 2,572 |
| – Long to Short Ratio: | 3.3 to 1 | 0.0 to 1 | 1.9 to 1 |
| NET POSITION TREND: | | | |
| – Strength Index Score (3 Year Range Pct): | 85.8 | 12.8 | 42.8 |
| – Strength Index Reading (3 Year Range): | Bullish-Extreme | Bearish-Extreme | Bearish |
| NET POSITION MOVEMENT INDEX: | | | |
| – 6-Week Change in Strength Index: | 6.6 | -3.4 | -19.3 |
Euro Currency Futures:
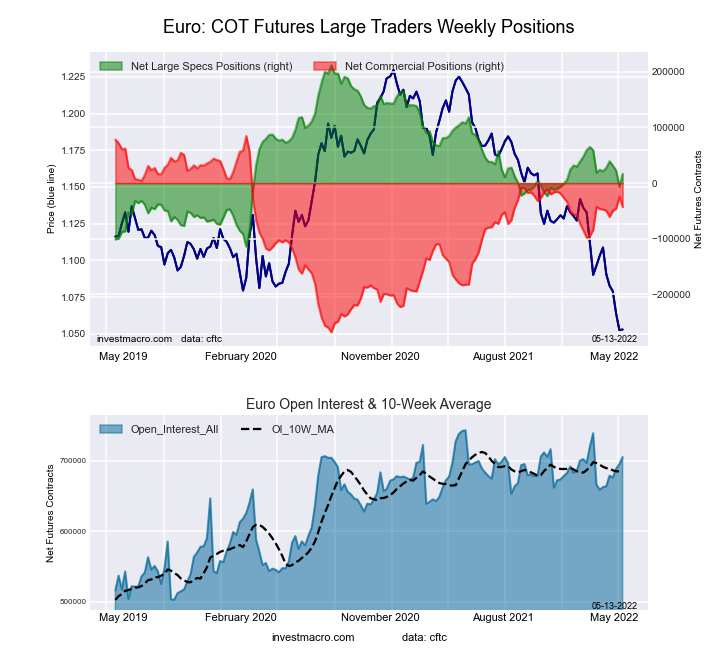 The Euro Currency large speculator standing this week came in at a net position of 16,529 contracts in the data reported through Tuesday. This was a weekly increase of 22,907 contracts from the previous week which had a total of -6,378 net contracts.
This week’s current strength score (the trader positioning range over the past three years, measured from 0 to 100) shows the speculators are currently Bearish with a score of 40.1 percent. The commercials are Bullish with a score of 63.8 percent and the small traders (not shown in chart) are Bearish-Extreme with a score of 18.3 percent.
| EURO Currency Statistics | SPECULATORS | COMMERCIALS | SMALL TRADERS |
| – Percent of Open Interest Longs: | 32.4 | 53.3 | 12.0 |
| – Percent of Open Interest Shorts: | 30.0 | 59.4 | 8.3 |
| – Net Position: | 16,529 | -43,026 | 26,497 |
| – Gross Longs: | 228,230 | 376,043 | 84,921 |
| – Gross Shorts: | 211,701 | 419,069 | 58,424 |
| – Long to Short Ratio: | 1.1 to 1 | 0.9 to 1 | 1.5 to 1 |
| NET POSITION TREND: | | | |
| – Strength Index Score (3 Year Range Pct): | 40.1 | 63.8 | 18.3 |
| – Strength Index Reading (3 Year Range): | Bearish | Bullish | Bearish-Extreme |
| NET POSITION MOVEMENT INDEX: | | | |
| – 6-Week Change in Strength Index: | -1.5 | 1.2 | 0.9 |
British Pound Sterling Futures:
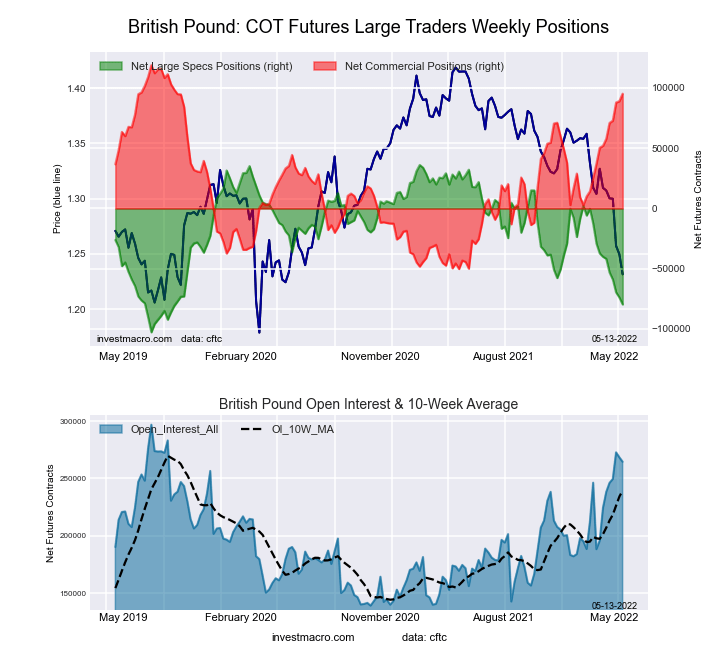 The British Pound Sterling large speculator standing this week came in at a net position of -79,598 contracts in the data reported through Tuesday. This was a weekly fall of -5,785 contracts from the previous week which had a total of -73,813 net contracts.
This week’s current strength score (the trader positioning range over the past three years, measured from 0 to 100) shows the speculators are currently Bearish-Extreme with a score of 16.6 percent. The commercials are Bullish-Extreme with a score of 86.0 percent and the small traders (not shown in chart) are Bearish with a score of 23.2 percent.
| BRITISH POUND Statistics | SPECULATORS | COMMERCIALS | SMALL TRADERS |
| – Percent of Open Interest Longs: | 11.1 | 79.6 | 7.6 |
| – Percent of Open Interest Shorts: | 41.2 | 43.6 | 13.5 |
| – Net Position: | -79,598 | 95,245 | -15,647 |
| – Gross Longs: | 29,469 | 210,627 | 20,157 |
| – Gross Shorts: | 109,067 | 115,382 | 35,804 |
| – Long to Short Ratio: | 0.3 to 1 | 1.8 to 1 | 0.6 to 1 |
| NET POSITION TREND: | | | |
| – Strength Index Score (3 Year Range Pct): | 16.6 | 86.0 | 23.2 |
| – Strength Index Reading (3 Year Range): | Bearish-Extreme | Bullish-Extreme | Bearish |
| NET POSITION MOVEMENT INDEX: | | | |
| – 6-Week Change in Strength Index: | -28.5 | 25.6 | -7.7 |
Japanese Yen Futures:

The Japanese Yen large speculator standing this week came in at a net position of -110,454 contracts in the data reported through Tuesday. This was a weekly decline of -9,660 contracts from the previous week which had a total of -100,794 net contracts.
This week’s current strength score (the trader positioning range over the past three years, measured from 0 to 100) shows the speculators are currently Bearish-Extreme with a score of 0.8 percent. The commercials are Bullish-Extreme with a score of 96.6 percent and the small traders (not shown in chart) are Bearish with a score of 24.0 percent.
| JAPANESE YEN Statistics | SPECULATORS | COMMERCIALS | SMALL TRADERS |
| – Percent of Open Interest Longs: | 4.5 | 86.2 | 8.0 |
| – Percent of Open Interest Shorts: | 49.2 | 35.7 | 13.9 |
| – Net Position: | -110,454 | 124,927 | -14,473 |
| – Gross Longs: | 11,196 | 213,084 | 19,811 |
| – Gross Shorts: | 121,650 | 88,157 | 34,284 |
| – Long to Short Ratio: | 0.1 to 1 | 2.4 to 1 | 0.6 to 1 |
| NET POSITION TREND: | | | |
| – Strength Index Score (3 Year Range Pct): | 0.8 | 96.6 | 24.0 |
| – Strength Index Reading (3 Year Range): | Bearish-Extreme | Bullish-Extreme | Bearish |
| NET POSITION MOVEMENT INDEX: | | | |
| – 6-Week Change in Strength Index: | -5.1 | 0.0 | 16.7 |
Swiss Franc Futures:

The Swiss Franc large speculator standing this week came in at a net position of -15,763 contracts in the data reported through Tuesday. This was a weekly fall of -1,856 contracts from the previous week which had a total of -13,907 net contracts.
This week’s current strength score (the trader positioning range over the past three years, measured from 0 to 100) shows the speculators are currently Bearish with a score of 39.8 percent. The commercials are Bullish with a score of 69.2 percent and the small traders (not shown in chart) are Bearish-Extreme with a score of 15.5 percent.
| SWISS FRANC Statistics | SPECULATORS | COMMERCIALS | SMALL TRADERS |
| – Percent of Open Interest Longs: | 9.2 | 74.6 | 16.1 |
| – Percent of Open Interest Shorts: | 40.0 | 16.5 | 43.5 |
| – Net Position: | -15,763 | 29,819 | -14,056 |
| – Gross Longs: | 4,727 | 38,258 | 8,271 |
| – Gross Shorts: | 20,490 | 8,439 | 22,327 |
| – Long to Short Ratio: | 0.2 to 1 | 4.5 to 1 | 0.4 to 1 |
| NET POSITION TREND: | | | |
| – Strength Index Score (3 Year Range Pct): | 39.8 | 69.2 | 15.5 |
| – Strength Index Reading (3 Year Range): | Bearish | Bullish | Bearish-Extreme |
| NET POSITION MOVEMENT INDEX: | | | |
| – 6-Week Change in Strength Index: | -7.7 | 8.0 | -7.6 |
Canadian Dollar Futures:
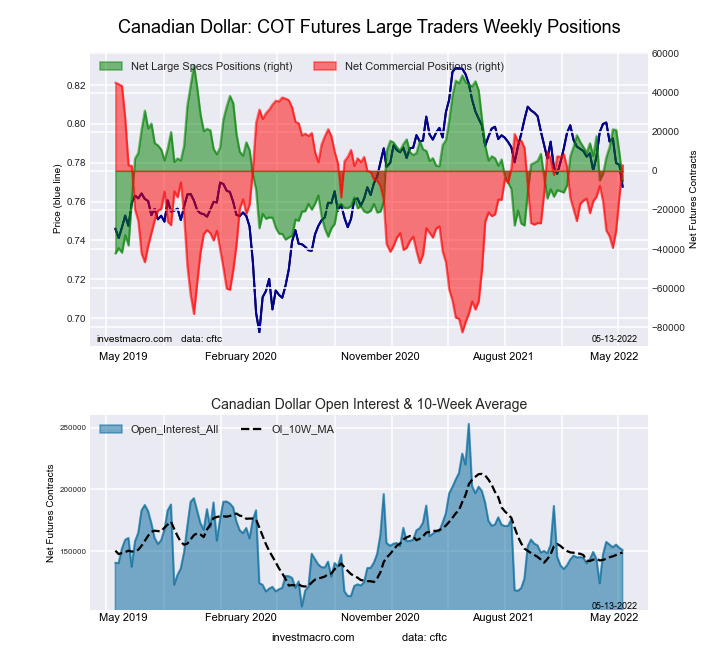 The Canadian Dollar large speculator standing this week came in at a net position of -5,407 contracts in the data reported through Tuesday. This was a weekly fall of -14,436 contracts from the previous week which had a total of 9,029 net contracts.
This week’s current strength score (the trader positioning range over the past three years, measured from 0 to 100) shows the speculators are currently Bearish with a score of 38.3 percent. The commercials are Bullish with a score of 66.9 percent and the small traders (not shown in chart) are Bearish with a score of 34.7 percent.
| CANADIAN DOLLAR Statistics | SPECULATORS | COMMERCIALS | SMALL TRADERS |
| – Percent of Open Interest Longs: | 25.6 | 49.8 | 21.8 |
| – Percent of Open Interest Shorts: | 29.2 | 47.9 | 20.1 |
| – Net Position: | -5,407 | 2,939 | 2,468 |
| – Gross Longs: | 38,679 | 75,215 | 32,880 |
| – Gross Shorts: | 44,086 | 72,276 | 30,412 |
| – Long to Short Ratio: | 0.9 to 1 | 1.0 to 1 | 1.1 to 1 |
| NET POSITION TREND: | | | |
| – Strength Index Score (3 Year Range Pct): | 38.3 | 66.9 | 34.7 |
| – Strength Index Reading (3 Year Range): | Bearish | Bullish | Bearish |
| NET POSITION MOVEMENT INDEX: | | | |
| – 6-Week Change in Strength Index: | -4.0 | 14.5 | -29.0 |
Australian Dollar Futures:
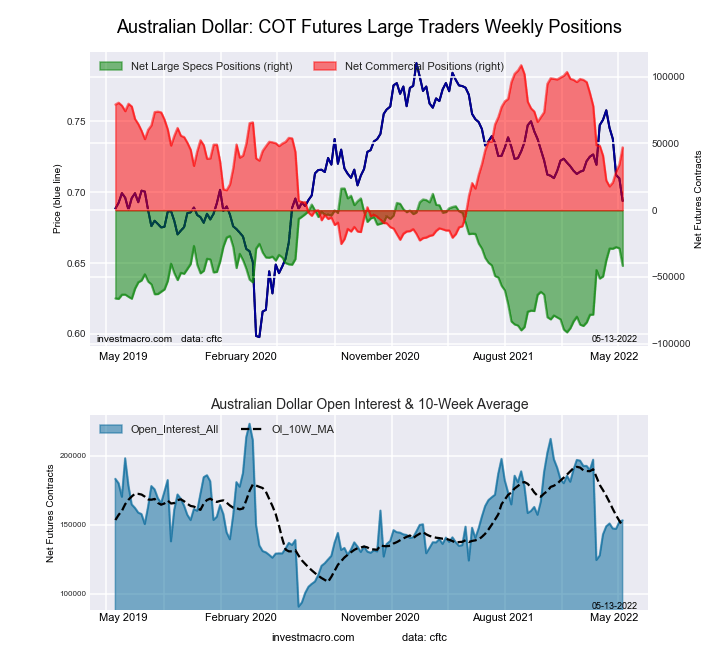 The Australian Dollar large speculator standing this week came in at a net position of -41,714 contracts in the data reported through Tuesday. This was a weekly decrease of -13,198 contracts from the previous week which had a total of -28,516 net contracts.
This week’s current strength score (the trader positioning range over the past three years, measured from 0 to 100) shows the speculators are currently Bearish with a score of 46.2 percent. The commercials are Bullish with a score of 54.0 percent and the small traders (not shown in chart) are Bearish with a score of 39.2 percent.
| AUSTRALIAN DOLLAR Statistics | SPECULATORS | COMMERCIALS | SMALL TRADERS |
| – Percent of Open Interest Longs: | 24.1 | 59.9 | 13.1 |
| – Percent of Open Interest Shorts: | 51.3 | 29.1 | 16.7 |
| – Net Position: | -41,714 | 47,126 | -5,412 |
| – Gross Longs: | 36,869 | 91,731 | 20,131 |
| – Gross Shorts: | 78,583 | 44,605 | 25,543 |
| – Long to Short Ratio: | 0.5 to 1 | 2.1 to 1 | 0.8 to 1 |
| NET POSITION TREND: | | | |
| – Strength Index Score (3 Year Range Pct): | 46.2 | 54.0 | 39.2 |
| – Strength Index Reading (3 Year Range): | Bearish | Bullish | Bearish |
| NET POSITION MOVEMENT INDEX: | | | |
| – 6-Week Change in Strength Index: | 7.3 | 4.7 | -34.4 |
New Zealand Dollar Futures:
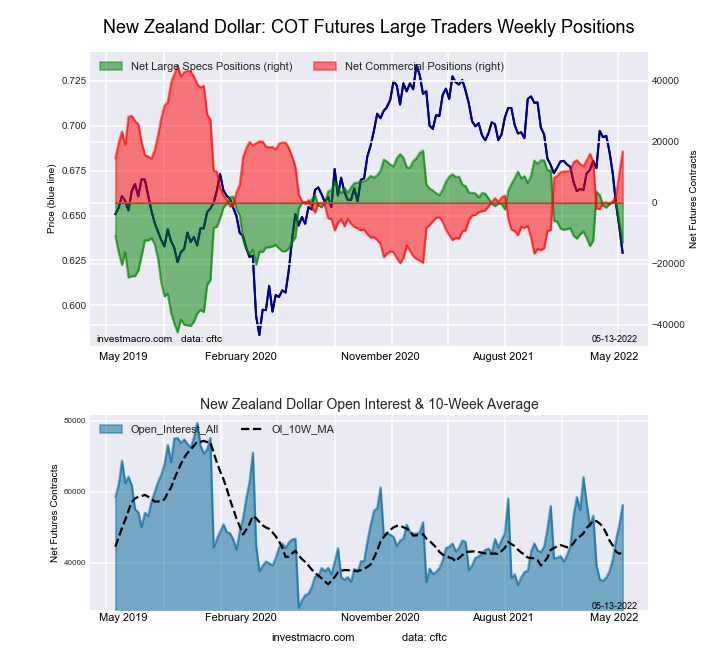 The New Zealand Dollar large speculator standing this week came in at a net position of -12,996 contracts in the data reported through Tuesday. This was a weekly fall of -6,386 contracts from the previous week which had a total of -6,610 net contracts.
This week’s current strength score (the trader positioning range over the past three years, measured from 0 to 100) shows the speculators are currently Bearish with a score of 49.5 percent. The commercials are Bullish with a score of 56.4 percent and the small traders (not shown in chart) are Bearish-Extreme with a score of 7.4 percent.
| NEW ZEALAND DOLLAR Statistics | SPECULATORS | COMMERCIALS | SMALL TRADERS |
| – Percent of Open Interest Longs: | 27.0 | 68.5 | 3.9 |
| – Percent of Open Interest Shorts: | 50.1 | 38.5 | 10.8 |
| – Net Position: | -12,996 | 16,874 | -3,878 |
| – Gross Longs: | 15,203 | 38,541 | 2,216 |
| – Gross Shorts: | 28,199 | 21,667 | 6,094 |
| – Long to Short Ratio: | 0.5 to 1 | 1.8 to 1 | 0.4 to 1 |
| NET POSITION TREND: | | | |
| – Strength Index Score (3 Year Range Pct): | 49.5 | 56.4 | 7.4 |
| – Strength Index Reading (3 Year Range): | Bearish | Bullish | Bearish-Extreme |
| NET POSITION MOVEMENT INDEX: | | | |
| – 6-Week Change in Strength Index: | -20.4 | 26.0 | -54.4 |
Mexican Peso Futures:
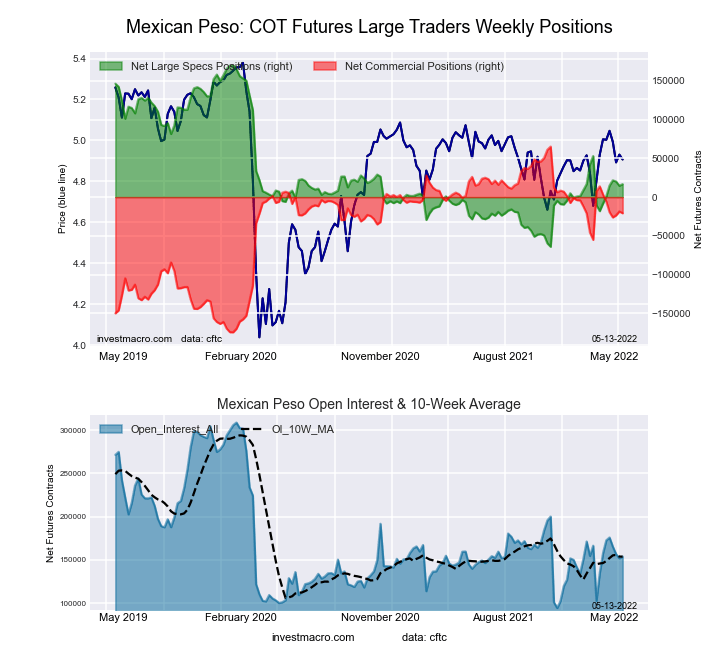 The Mexican Peso large speculator standing this week came in at a net position of 16,725 contracts in the data reported through Tuesday. This was a weekly advance of 2,102 contracts from the previous week which had a total of 14,623 net contracts.
This week’s current strength score (the trader positioning range over the past three years, measured from 0 to 100) shows the speculators are currently Bearish with a score of 34.5 percent. The commercials are Bullish with a score of 64.1 percent and the small traders (not shown in chart) are Bullish with a score of 60.6 percent.
| MEXICAN PESO Statistics | SPECULATORS | COMMERCIALS | SMALL TRADERS |
| – Percent of Open Interest Longs: | 41.5 | 53.1 | 4.2 |
| – Percent of Open Interest Shorts: | 30.7 | 66.7 | 1.5 |
| – Net Position: | 16,725 | -20,866 | 4,141 |
| – Gross Longs: | 63,921 | 81,735 | 6,467 |
| – Gross Shorts: | 47,196 | 102,601 | 2,326 |
| – Long to Short Ratio: | 1.4 to 1 | 0.8 to 1 | 2.8 to 1 |
| NET POSITION TREND: | | | |
| – Strength Index Score (3 Year Range Pct): | 34.5 | 64.1 | 60.6 |
| – Strength Index Reading (3 Year Range): | Bearish | Bullish | Bullish |
| NET POSITION MOVEMENT INDEX: | | | |
| – 6-Week Change in Strength Index: | 10.6 | -10.1 | -3.5 |
Brazilian Real Futures:
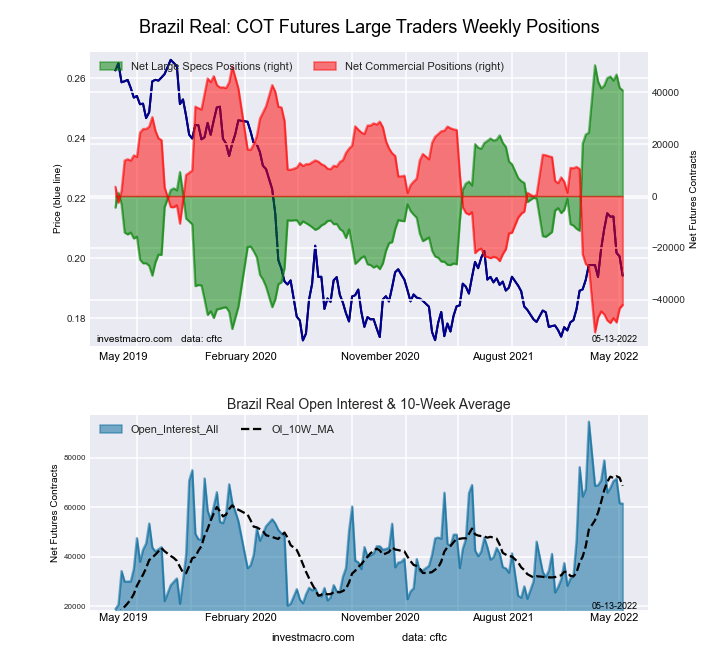 The Brazilian Real large speculator standing this week came in at a net position of 40,778 contracts in the data reported through Tuesday. This was a weekly lowering of -1,010 contracts from the previous week which had a total of 41,788 net contracts.
This week’s current strength score (the trader positioning range over the past three years, measured from 0 to 100) shows the speculators are currently Bullish-Extreme with a score of 90.5 percent. The commercials are Bearish-Extreme with a score of 10.3 percent and the small traders (not shown in chart) are Bullish with a score of 79.4 percent.
| BRAZIL REAL Statistics | SPECULATORS | COMMERCIALS | SMALL TRADERS |
| – Percent of Open Interest Longs: | 79.5 | 15.4 | 5.0 |
| – Percent of Open Interest Shorts: | 13.1 | 83.8 | 3.0 |
| – Net Position: | 40,778 | -42,031 | 1,253 |
| – Gross Longs: | 48,835 | 9,454 | 3,070 |
| – Gross Shorts: | 8,057 | 51,485 | 1,817 |
| – Long to Short Ratio: | 6.1 to 1 | 0.2 to 1 | 1.7 to 1 |
| NET POSITION TREND: | | | |
| – Strength Index Score (3 Year Range Pct): | 90.5 | 10.3 | 79.4 |
| – Strength Index Reading (3 Year Range): | Bullish-Extreme | Bearish-Extreme | Bullish |
| NET POSITION MOVEMENT INDEX: | | | |
| – 6-Week Change in Strength Index: | -1.8 | 3.5 | -20.6 |
Russian Ruble Futures:
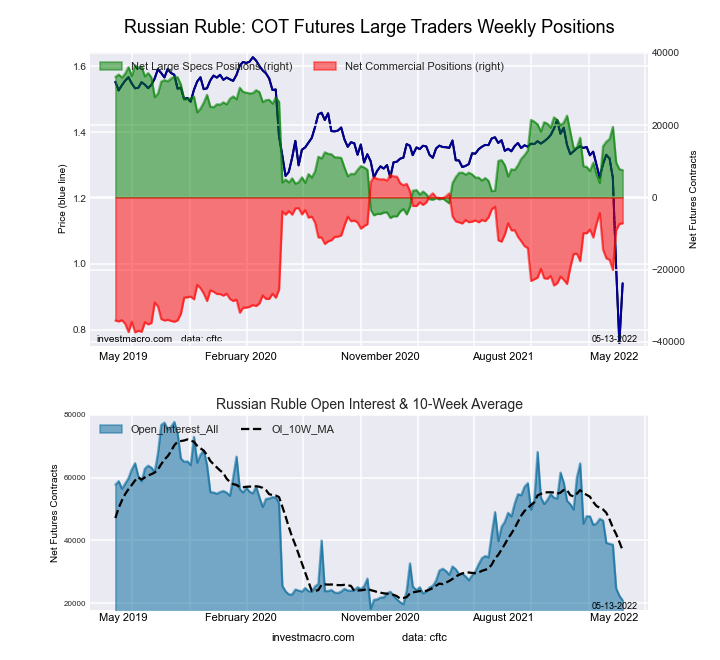 The Russian Ruble large speculator standing this week came in at a net position of 7,543 contracts in the data reported through Tuesday. This was a weekly fall of -263 contracts from the previous week which had a total of 7,806 net contracts.
This week’s current strength score (the trader positioning range over the past three years, measured from 0 to 100) shows the speculators are currently Bearish with a score of 31.2 percent. The commercials are Bullish with a score of 69.1 percent and the small traders (not shown in chart) are Bearish with a score of 23.9 percent.
| RUSSIAN RUBLE Statistics | SPECULATORS | COMMERCIALS | SMALL TRADERS |
| – Percent of Open Interest Longs: | 36.6 | 60.6 | 2.8 |
| – Percent of Open Interest Shorts: | 0.5 | 94.7 | 4.7 |
| – Net Position: | 7,543 | -7,150 | -393 |
| – Gross Longs: | 7,658 | 12,679 | 593 |
| – Gross Shorts: | 115 | 19,829 | 986 |
| – Long to Short Ratio: | 66.6 to 1 | 0.6 to 1 | 0.6 to 1 |
| NET POSITION TREND: | | | |
| – Strength Index Score (3 Year Range Pct): | 31.2 | 69.1 | 23.9 |
| – Strength Index Reading (3 Year Range): | Bearish | Bullish | Bearish |
| NET POSITION MOVEMENT INDEX: | | | |
| – 6-Week Change in Strength Index: | -15.6 | 16.7 | -18.8 |
Bitcoin Futures:
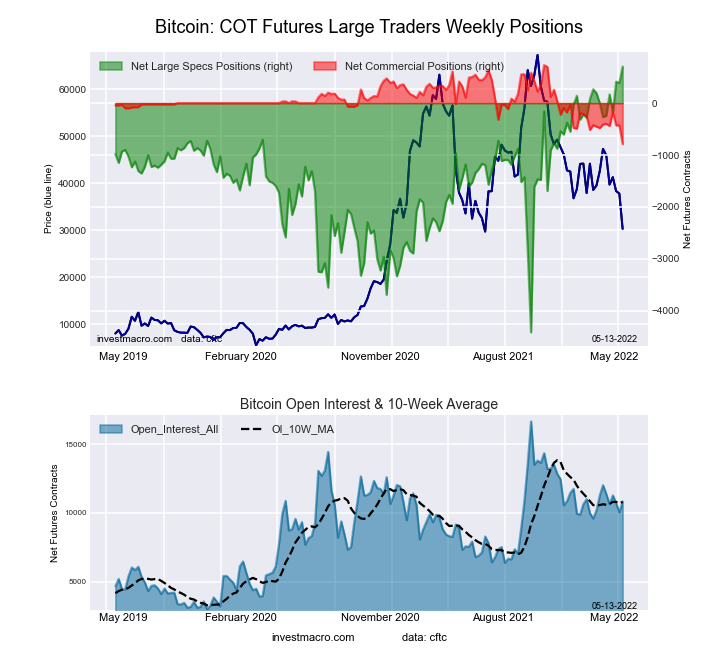 The Bitcoin large speculator standing this week came in at a net position of 703 contracts in the data reported through Tuesday. This was a weekly gain of 315 contracts from the previous week which had a total of 388 net contracts.
This week’s current strength score (the trader positioning range over the past three years, measured from 0 to 100) shows the speculators are currently Bullish-Extreme with a score of 100.0 percent. The commercials are Bearish-Extreme with a score of 0.0 percent and the small traders (not shown in chart) are Bearish-Extreme with a score of 14.9 percent.
| BITCOIN Statistics | SPECULATORS | COMMERCIALS | SMALL TRADERS |
| – Percent of Open Interest Longs: | 81.1 | 2.1 | 9.1 |
| – Percent of Open Interest Shorts: | 74.6 | 9.4 | 8.3 |
| – Net Position: | 703 | -789 | 86 |
| – Gross Longs: | 8,789 | 227 | 989 |
| – Gross Shorts: | 8,086 | 1,016 | 903 |
| – Long to Short Ratio: | 1.1 to 1 | 0.2 to 1 | 1.1 to 1 |
| NET POSITION TREND: | | | |
| – Strength Index Score (3 Year Range Pct): | 100.0 | 0.0 | 14.9 |
| – Strength Index Reading (3 Year Range): | Bullish-Extreme | Bearish-Extreme | Bearish-Extreme |
| NET POSITION MOVEMENT INDEX: | | | |
| – 6-Week Change in Strength Index: | 19.0 | -24.9 | -13.6 |
Article By InvestMacro – Receive our weekly COT Reports by Email
*COT Report: The COT data, released weekly to the public each Friday, is updated through the most recent Tuesday (data is 3 days old) and shows a quick view of how large speculators or non-commercials (for-profit traders) were positioned in the futures markets.
The CFTC categorizes trader positions according to commercial hedgers (traders who use futures contracts for hedging as part of the business), non-commercials (large traders who speculate to realize trading profits) and nonreportable traders (usually small traders/speculators) as well as their open interest (contracts open in the market at time of reporting).See CFTC criteria here.


