On H4, the quotes are above the 200-days Moving Average, which means prevalence of the uptrend. A test of 2/8 is expected, followed by a breakaway and growth to the resistance level of 3/8. The scenario can be cancelled by a breakaway of the support level at 1/8 downwards. In this case, the quotes might return to 0/8.
On M15, a breakaway of the upper line of VoltyChannel will be a signal of the price growth.
XAUUSD, “Gold vs US Dollar”
On H4, the quotes have escaped the oversold area and are now trading above 1/8. Currently, we should expect further price growth that might end in a breakaway upwards of 2/8 and test the resistance level of 1/8, returning the quotes to the oversold area.
On M15, the upper line of VoltyChannel is broken, increasing the probability of further price growth.
Attention! Forecasts presented in this section only reflect the author’s private opinion and should not be considered as guidance for trading. RoboForex LP bears no responsibility for trading results based on trading recommendations described in these analytical reviews.
The Federal Reserve raised its target interest rate by three-quarters of a percentage point and expected the economy to slow and US unemployment to rise in the coming months. Earlier economic data on Wednesday showed that US retail sales unexpectedly fell by 0.3% in May, the first decline in 5 months. As a result, the dollar index fell sharply, sending the EURUSD currency pair higher. In her speech yesterday, ECB head Christine Lagarde hinted that the ECB needs to be consistent in its policy, not aggressive. Traders likely should not expect the ECB to raise its rate by 0.5% in July aggressively. France’s inflation rate increased by 0.7% in May to 5.2% y/y.
Trading recommendations
Support levels: 1.0408, 1.0379
Resistance levels: 1.0503, 1.0570, 1.0611, 1.0680
From the technical point of view, the trend on the EUR/USD currency pair on the hourly time frame is bearish. The price is clearly forming a flat structure. The MACD indicator has become inactive. Under such market conditions, sell deals can be considered from the resistance level 1.0503 or 1.0570, but only after the additional confirmation. Buy trades are best to look for on intraday time frames from the support level of 1.0408, but only with confirmation and short targets.
Alternative scenario: if the price breaks out through the 1.0570 resistance level and fixes above, the uptrend will likely resume.
News feed for 2022.06.16:
– Eurozone Italian Consumer Price Index (m/m) at 11:00 (GMT+3);
– US Initial Jobless Claims (w/w) at 15:30 (GMT+3);
– US Building Permits (m/m) at 15:30 (GMT+3);
– US Philadelphia Fed Manufacturing Index (m/m) at 15:30 (GMT+3).
The GBP/USD currency pair
Technical indicators of the currency pair:
Prev Open: 1.1993
Prev Close: 1.2172
% chg. over the last day: +1.49%
The Bank of England will hold its monetary policy meeting today. The Bank of England is expected to raise interest rates for the fifth time to suppress inflationary growth amid slowing growth and a weakening currency. Some market participants call for the Monetary Policy Committee to implement a 50 basis point hike, but analysts are leaning more toward a 25 basis point move. The Organization for Economic Cooperation and Development predicts that Britain will be the weakest G-7 next year as higher interest rates, taxes, shrinking trade, and soaring food and energy prices will weigh on households.
From the technical point of view, the trend on the GBP/USD currency pair on the hourly time frame is bearish. But an initiative of buyers appeared. The MACD indicator has become positive, and the price has corrected to the average values. Under such market conditions, sell deals can be considered from the resistance level of 1.2199, but only after the additional confirmation. Buy trades are best to look for on intraday time frames from the support level of 1.2104, but only with confirmation and short targets.
Alternative scenario: if the price breaks out through the 1.2363 resistance level and fixes above, the uptrend will likely resume.
News feed for 2022.06.16:
– UK BoE Interest Rate Decision at 14:00 (GMT+3);
– UK BoE Monetary Policy Statement at 14:00 (GMT+3).
The USD/JPY currency pair
Technical indicators of the currency pair:
Prev Open: 135.45
Prev Close: 133.82
% chg. over the last day: -1.44%
After the Fed meeting yesterday, investors are now turning their attention to the Bank of Japan, which has increased its bond purchases this week in an attempt to limit the rise in yields. The Central Bank is expected to stick to all of its key policy parameters when it concludes its meeting on Friday. In this case, the Bank of Japan risks putting more pressure on yields, accelerating the yen’s fall and increasing public concern over rising prices.
The medium-term trend on the USD/JPY currency pair is bullish. The price started to form a wide range, and the MACD indicator became negative. It is best to wait for a slight correction, as the price strongly deviates from the average values. Buy trades can be considered from the support level of 132.85, but with confirmation. A resistance level of 135.16 is good for sell deals, but only with additional confirmation in the form of a reverse initiative and short targets.
Alternative scenario: If the price fixes below 132.00, the downtrend will likely resume.
There is no news feed for today.
The USD/CAD currency pair
Technical indicators of the currency pair:
Prev Open: 1.2928
Prev Close: 1.2891
% chg. over the last day: -0.28%
The Canadian dollar rose sharply yesterday amid a decline in the dollar index, which led to a decline in the USD/CAD quotes. The sharp decline in oil prices did not significantly impact the Canadian currency. The fundamental picture now is that both the US Fed and the Bank of Canada are on the way to raising the interest rates, so the confidence in this currency pair will often shift from one currency to the other.
Trading recommendations
Support levels: 1.2815, 1.2709, 1.2618, 1.2578, 1.2510
Resistance levels: 1.2917, 1.2991
In terms of technical analysis, the trend on the USD/CAD currency pair is bullish. The price reached the resistance level and started to correct. The MACD indicator became negative, and sellers were slightly pressured. Under such market conditions, it is better to look for buy deals in the lower time frames from the support level of 1.2815. For sell deals, it is better to consider the resistance level of 1.2917, but it is also better with confirmation and short targets.
Alternative scenario: if the price breaks through and consolidates below the 1.2709 support level, the downtrend will likely resume.
This article reflects a personal opinion and should not be interpreted as an investment advice, and/or offer, and/or a persistent request for carrying out financial transactions, and/or a guarantee, and/or a forecast of future events.
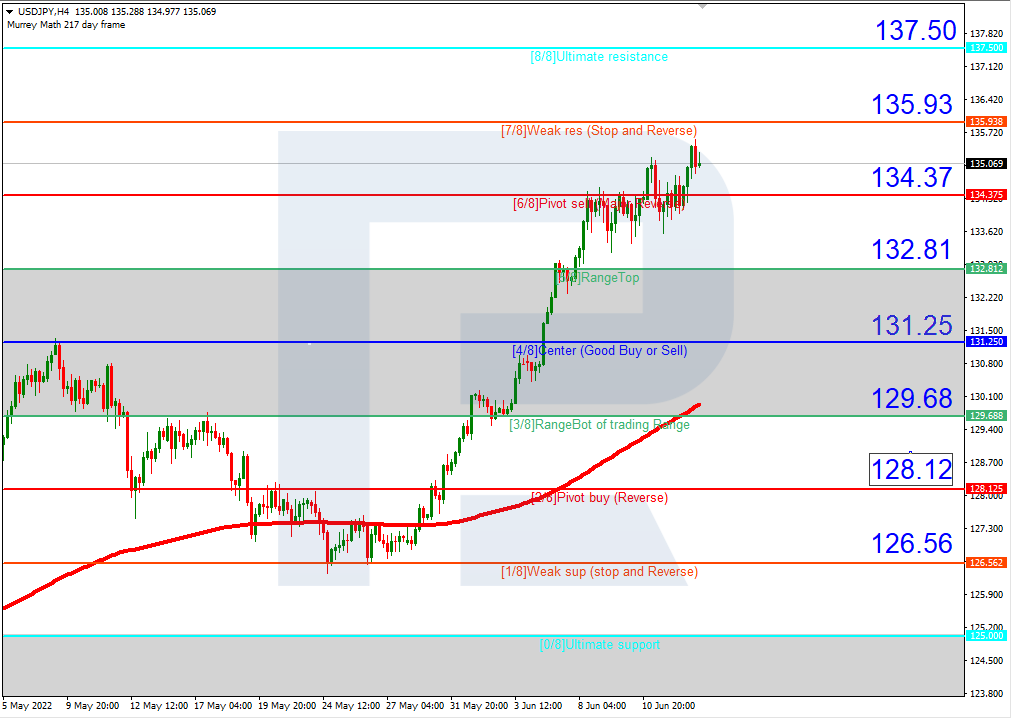
On H4, the pair rests above the 200-days Moving Average, demonstrating an uptrend. The pair is likely to rise over 7/8 and reach the resistance level of 8/8. The scenario can be cancelled by a breakaway of the support level at 6/8 downwards, in which case the quotes can correct to 5/8.
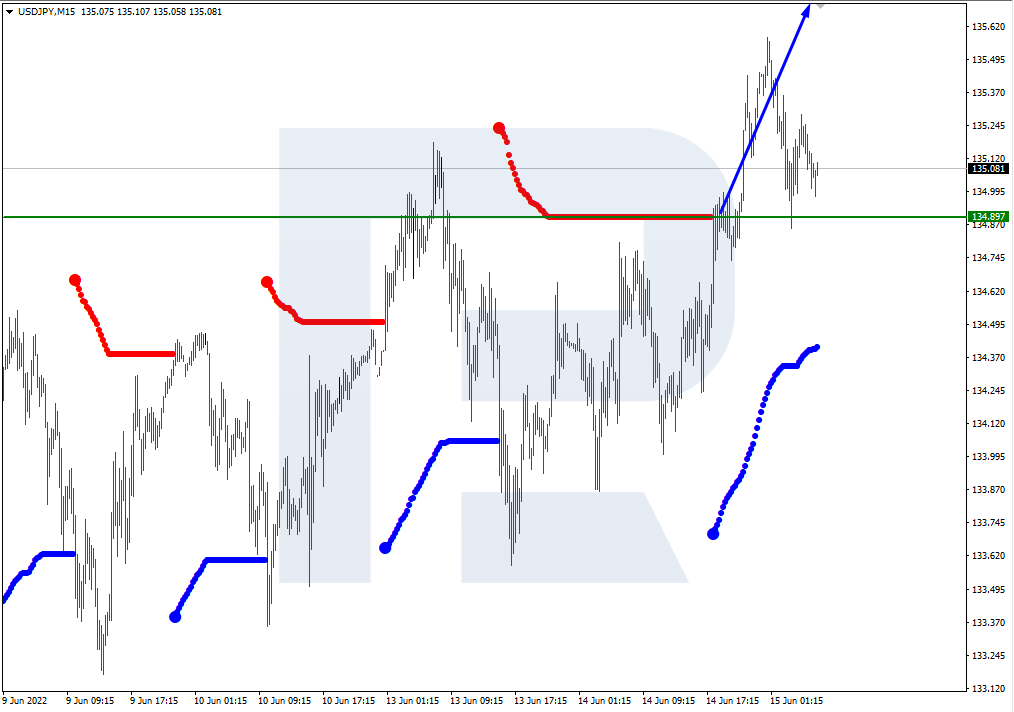
On M15, the upper line of VoltyChannel is broken away, confirming an uptrend and a high probability of further growth of the price.
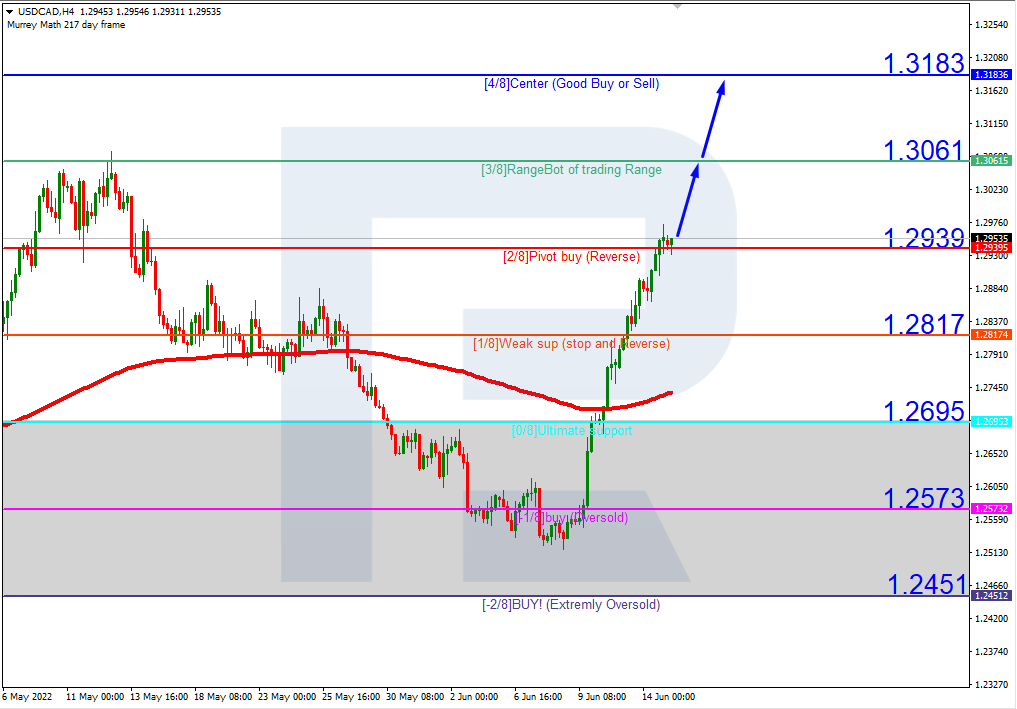
USDCAD, “US Dollar vs Canadian Dollar”
On H4, the quotes have broken through the 200-days Moving Average and are resting above it, indicating possible development of an uptrend. The price is likely to test 3/8, break through it, and rise to the resistance level of 4/8. The scenario can be cancelled by a breakaway downwards of the support level at 2/8. This can lead to further falling to 1/8.
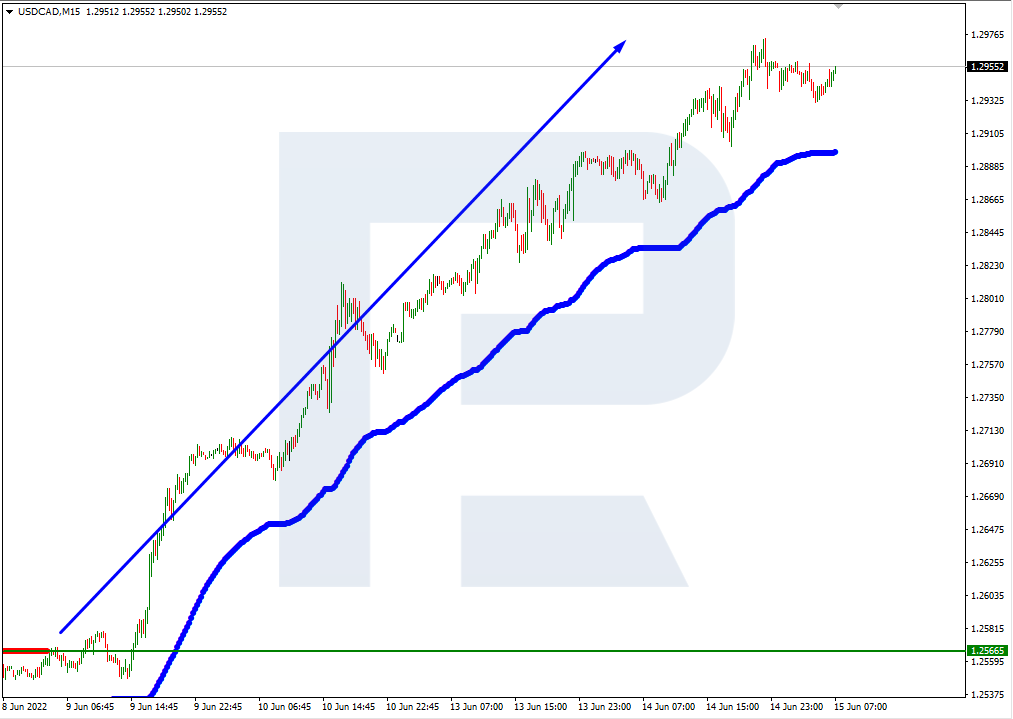
On M15, the upper line of VoltyChannel is broken away, increasing the probability of further growth.
Attention! Forecasts presented in this section only reflect the author’s private opinion and should not be considered as guidance for trading. RoboForex LP bears no responsibility for trading results based on trading recommendations described in these analytical reviews.
The past few days have been incredibly eventful for global markets as concerns over soaring inflation and slowing economic growth sparked explosive levels of volatility!
There was plenty of action across stock, currency, and commodity markets as investors braced for the Federal Reserve (Fed) rate decision on Wednesday evening. After last Friday’s red hot inflation figures, markets are pricing in a 75 basis point US rate hike this month – the biggest hike since 1994. Such an aggressive move from the Fed is likely to turbocharge the dollar, which has already appreciated every single G10 currency this week.
Ahead of the Fed meeting, our attention will be directed towards major currency pairs which could be influenced by the rate decision and Powell’s press conference.
EURUSD shaky and tired
Euro bulls were injected with fresh confidence this morning after the European Central Bank (ECB) announced an emergency meeting to discuss the market turmoil.
Nevertheless, the trend remains bearish on the daily timeframe with 1.0500 acting as resistance. Sustained weakness below this level could encourage a decline towards 1.0350. If bulls are able to close above 1.0500, the next key level of interest can be found at 1.0630 and 1.0780, respectively.
GBPUSD descends deeper into the abyss
The past few days have certainly not been kind to the GBPUSD.
Yesterday, prices tumbled to levels not seen since March 2020 as traders eyed the widening rate differentials between the Fed and BoE. Prices are heavily bearish on the daily charts as there have been consistently lower lows and lower highs. The candlesticks are trading within a downwards channel and below the 50, 100, and 200-day Simple Moving Average. If bears can secure a daily close below 1.1950 opening the doors towards 1.1700. A move back above 1.2150 may signal an incline towards 1.2300.
USDJPY bulls still in control
We expect the USDJPY to remain bullish with a breakout opening the doors to further upside.
Key levels of interest will be 135.00 and 134.00. A solid move towards 136.00 will take prices to levels not seen since 1998 and could trigger an incline higher towards 138.00. Alternatively, a selloff below 134.00 may inspire bears to attack 131.00. There is a classic breakout/down opportunity on the USDJPY with a fresh directional catalyst needed to spark the move up or down.
AUDUSD gearing to sink lower?
After experiencing five consecutive days of losses, the AUDUSD is attempting to rebound with prices trading around 0.6950 as of writing. The trend remains heavily bearish as there have been consistently lower lows and lower highs. However, there could be a minor rebound before bears attack again. A technical bounce towards 0.7050 could invite sellers back into the game. If the current price jump proves short-lived, the AUDUSD could descend back towards 0.6850.
Bonus outlook: Gold
It’s been a rollercoaster trading week for gold so far thanks to the dollar and Treasury yields.
After taking a real beating on Monday and sulking on Tuesday, the precious metal fought back on Wednesday ahead of the Fed meeting. The precious metal could be in store for more pain if Jerome Powell strikes a hawkish tone or signals that the Fed will maintain its aggressive approach toward raising rates.
Looking at the technical picture, prices are trading below the 50, 100, and 200-day Simple Moving Average while the MACD trades below zero. A solid daily close below $1800 could signal a decline back towards recent lows at $1785. Should $1850 prove to be reliable support, a move towards $1870 and $1900 could be on the cards.
Germany’s inflation rate increased by 0.9% last month to 7.9% annually (the highest level since 1973). The main reason for the high inflation is still rising energy prices. At the same time, the ZEW economic sentiment indicator for Germany rose over the past month. The report indicates that financial market experts are less pessimistic about the economy. However, the economy is still exposed to numerous risks, such as the effects of sanctions against Russia, the unclear pandemic situation in China, and the gradual change in the ECB’s monetary policy. The report also indicates that inflation expectations in the Eurozone have declined again. Still, ECB officials clearly state that rising inflation across the EU is of great concern to policymakers.
Trading recommendations
Support levels: 1.0379
Resistance levels: 1.0509, 1.0563, 1.0611, 1.0680
From the technical point of view, the trend on the EUR/USD currency pair on the hourly time frame is bearish. There are signs that the fall has slowed down and turned into a flat structure. The MACD indicator is in the negative zone but without any signs of sellers’ pressure. Under such market conditions, it is better to wait for a small pullback, as the price has strongly deviated from the averages. Sell deals can be considered from the resistance level 1.0509 or 1.0563, but only after the additional confirmation. Buy trades are best to look for on intraday time frames from the support level of 1.0379, but only with confirmation and short targets.
Alternative scenario: if the price breaks out through the 1.0680 resistance level and fixes above, the uptrend will likely resume.
News feed for 2022.06.15:
– Eurozone French Consumer Price Index (m/m) at 09:45 (GMT+3);
– Eurozone Industrial Production (m/m) at 12:00 (GMT+3);
– US Retail Sales (m/m) at 15:30 (GMT+3);
– US Empire State Manufacturing Index (m/m) at 15:30 (GMT+3);
– Eurozone ECB President Lagarde Speaks at 19:20 (GMT+3);
– US Fed Interest Rate Decision at 21:00 (GMT+3);
– US FOMC Monetary Policy Statement at 21:00 (GMT+3);
– US FOMC Economic Projection at 21:00 (GMT+3);
– US FOMC Press Conference at 21:30 (GMT+3).
The GBP/USD currency pair
Technical indicators of the currency pair:
Prev Open: 1.2131
Prev Close: 1.1997
% chg. over the last day: -1.11%
The UK-US government bond yield spread is renewing multi-year lows, signaling the continuation of this currency pair’s downtrend. At the same time, tighter monetary policy from the US Federal Reserve strengthens the dollar index, which is negative for the British currency. Economic indicators also are not encouraging. The British unemployment rate increased from 3.7% to 3.8% last month.
From the technical point of view, the trend on the GBP/USD currency pair on the hourly time frame is bearish. The MACD indicator is in the negative zone with signs of oversold and divergence. Under such market conditions, it is better to wait for a small pullback, as the price has strongly deviated from the averages. Sell deals can be considered from the resistance level of 1.2127, but only after the additional confirmation. Buy trades are best to look for on intraday time frames from the support level of 1.1974, but only with confirmation and short targets.
Alternative scenario: if the price breaks out through the 1.2422 resistance level and fixes above, the uptrend will likely resume.
News feed for 2022.06.15:
– US Fed Interest Rate Decision at 21:00 (GMT+3);
– US FOMC Monetary Policy Statement at 21:00 (GMT+3);
– US FOMC Economic Projection at 21:00 (GMT+3);
– US FOMC Press Conference at 21:30 (GMT+3).
The USD/JPY currency pair
Technical indicators of the currency pair:
Prev Open: 134.43
Prev Close: 135.45
% chg. over the last day: +0.75%
The Bank of Japan stepped up its policy defense yesterday, unveiling a new set of unscheduled purchases, including purchases with much longer maturities. These sharp moves reflect the Bank of Japan’s desire to defend its yield curve adjustment policy, even if it would cause the yen to fall further as the Federal Reserve accelerates the pace of rate hikes. Governor Haruhiko Kuroda insists that it is too early for Japan to retreat from ultra-low rates, as the economy is still recovering from the pandemic and inflation is largely driven by rising energy prices. The majority of economists surveyed expect the Bank to stick with its policy this week.
Trading recommendations
Support levels: 132.85, 132.00, 131.00, 130.12, 129.48, 128.76, 128.10, 127.64
Resistance levels: 135.16
The medium-term trend on the USD/JPY currency pair is bullish. But there are signs of slowing, and divergence on the MACD indicator is already observed in several time frames. It is best to wait for a slight correction, as the price has deviated strongly from the average lines. Buy trades can be considered from the support level of 132.85, but with confirmation. A resistance level of 135.16 is good for sell deals, but only with additional confirmation in the form of a reverse initiative and short targets.
Alternative scenario: If the price fixes below 132.00, the downtrend will likely resume.
News feed for 2022.06.15:
– US Fed Interest Rate Decision at 21:00 (GMT+3);
– US FOMC Monetary Policy Statement at 21:00 (GMT+3);
– US FOMC Economic Projection at 21:00 (GMT+3);
– US FOMC Press Conference at 21:30 (GMT+3).
The USD/CAD currency pair
Technical indicators of the currency pair:
Prev Open: 1.2891
Prev Close: 1.2954
% chg. over the last day: +0.49%
The bets of a major interest rate hike by the Bank of Canada next month are rising rapidly amid expectations of a rate hike by the Federal Reserve. There is now an 80% probability of a 0.75% rate hike at the Canadian central bank’s July 13 meeting, bringing the interest rate to 2.25%. Last week, traders estimated a roughly 50% chance of such a hike. The growth of the dollar index provokes the growth of USD/CAD quotes even though oil prices remain at their highs.
Trading recommendations
Support levels: 1.2881, 1.2815, 1.2709, 1.2618, 1.2578, 1.2510
Resistance levels: 1.2991
In terms of technical analysis, the trend on the USD/CAD currency pair is bullish. The price is growing steadily, but there are signs of a slowdown. The MACD indicator shows overbought and there are signs of divergence. Under such market conditions, it is better to look for buy deals in the lower time frames from the support level of 1.2881. For sell deals, it is better to consider the resistance level of 1.2991, but it is also better with confirmation and short targets.
Alternative scenario: if the price breaks through and consolidates below the 1.2709 support level, the downtrend will likely resume.
News feed for 2022.06.15:
– US Crude Oil Reserves (w/w) at 17:30 (GMT+3);
– US Fed Interest Rate Decision at 21:00 (GMT+3);
– US FOMC Monetary Policy Statement at 21:00 (GMT+3);
This article reflects a personal opinion and should not be interpreted as an investment advice, and/or offer, and/or a persistent request for carrying out financial transactions, and/or a guarantee, and/or a forecast of future events.
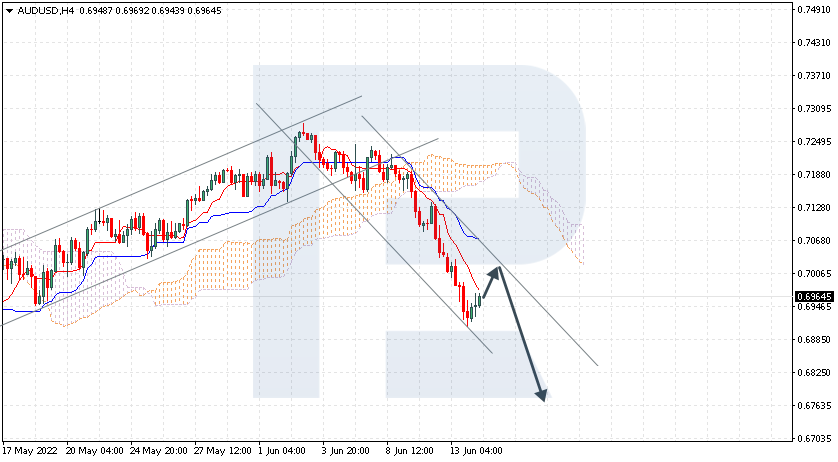
The currency pair is continuing decent falling under the Ichimoku Cloud, suggesting a downtrend. A test of the Tenkan-Sen of the indicator at 0.7005 is expected, followed by falling to 0.6765. An additional signal confirming the decline might become a bounce off the upper border of the bearish channel. The scenario can be canceled by a breakaway of the upper border of the Cloud and securing above 0.7215, which will mean further growth to 0.7315.
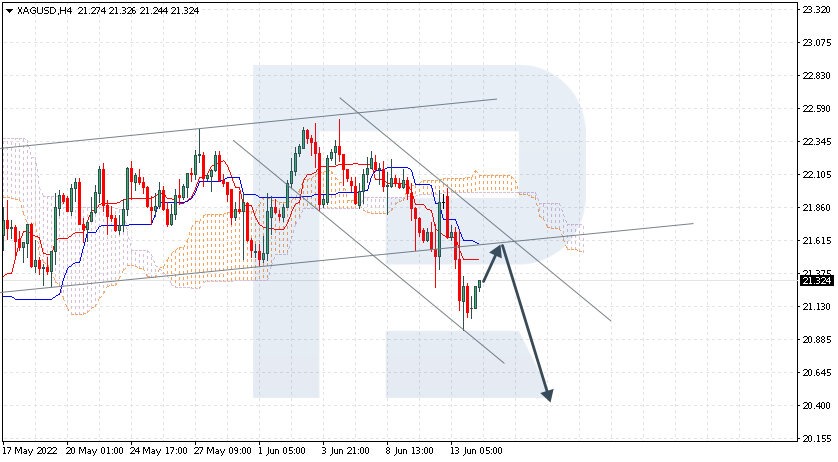
XAGUSD, “Silver vs US Dollar”
Silver has secured under the lower border of the bearish channel and the Ichimoku Cloud, suggesting a downtrend. A test of the Kijun-Sen line of the indicator at 21.60 is expected, followed by falling to 20.40. The decline can be additionally confirmed by a bounce off the lower border of the bullish channel. The scenario can be canceled by a breakaway of the upper border of the Cloud and securing above 22.25, which will entail further growth to 23.15.
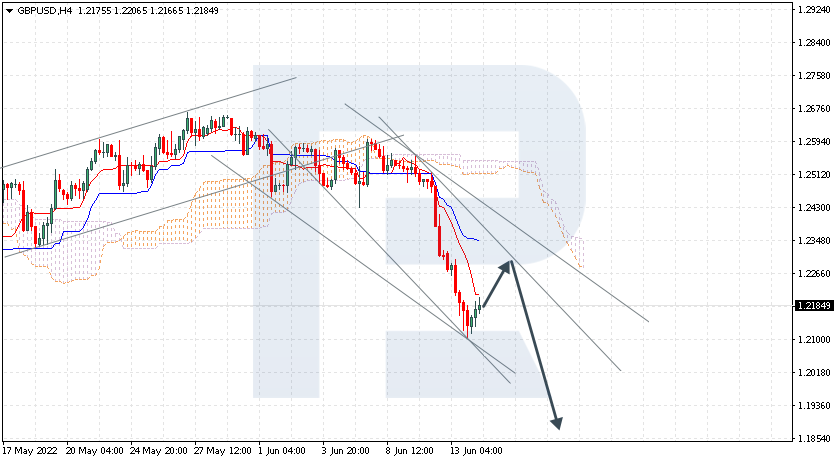
GBPUSD, “Great Britain Pound vs US Dollar”
The pair is testing the Tenkan-Sen line under the Ichimoku Cloud, suggesting a downtrend. A test of the signal lines of the indicator at 1.2265 is expected, followed by falling to 1.1855. An additional signal confirming the decline will be a bounce off the lower border of the bullish channel. The scenario can be canceled by a breakaway of the upper border of the Cloud and securing above 1.2605, which will entail further growth to 1.2705.
Attention! Forecasts presented in this section only reflect the author’s private opinion and should not be considered as guidance for trading. RoboForex LP bears no responsibility for trading results based on trading recommendations described in these analytical reviews.
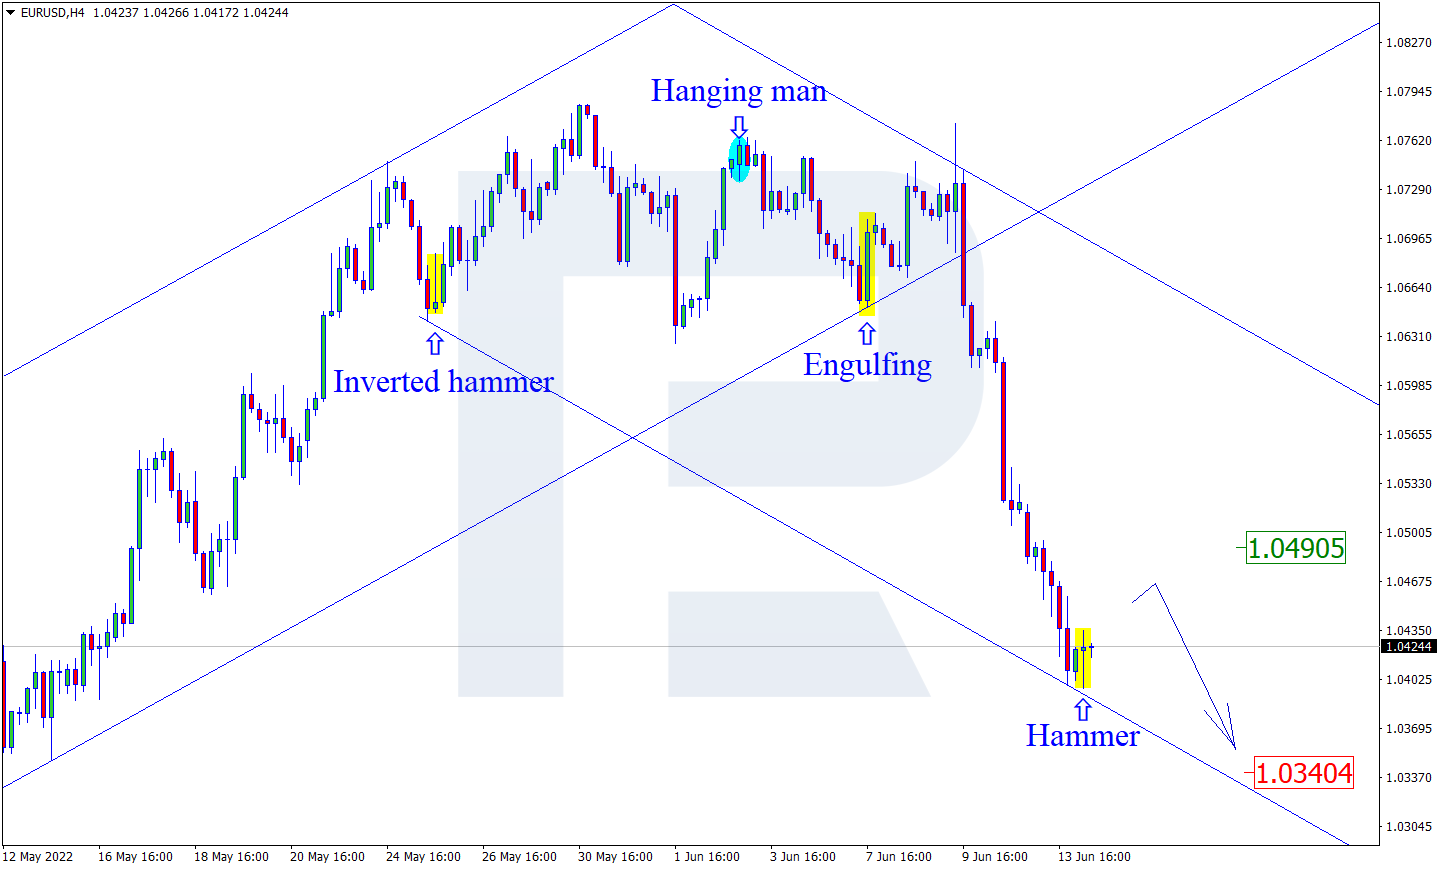
On H4, the pair formed a reversal Hammer pattern at the support level. Currently, if the pair goes by the signal, it might provoke an ascending impulse. The goal of the growth will be 1.0490. However, the price can still fall to 1.0340 without a pullback to the resistance level.
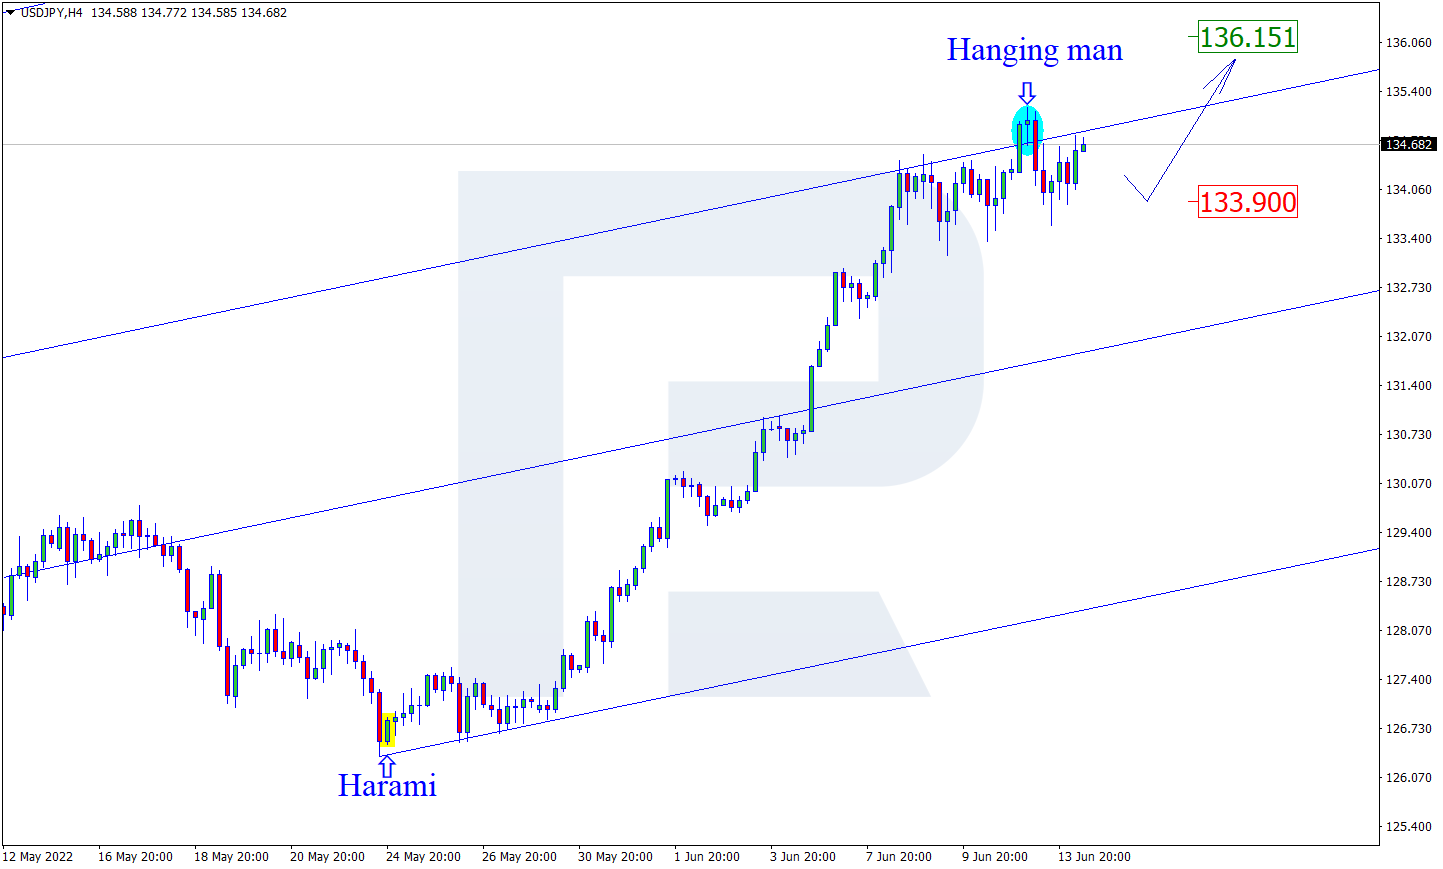
USDJPY, “US Dollar vs Japanese Yen”
On H4, the pair formed a Hanging Man pattern near the resistance level. Going by the pattern now can result in a correction impulse. The goal of the decline is 133.90. However, the pair can grow to 136.15 and continue the uptrend without a pullback to the support level.
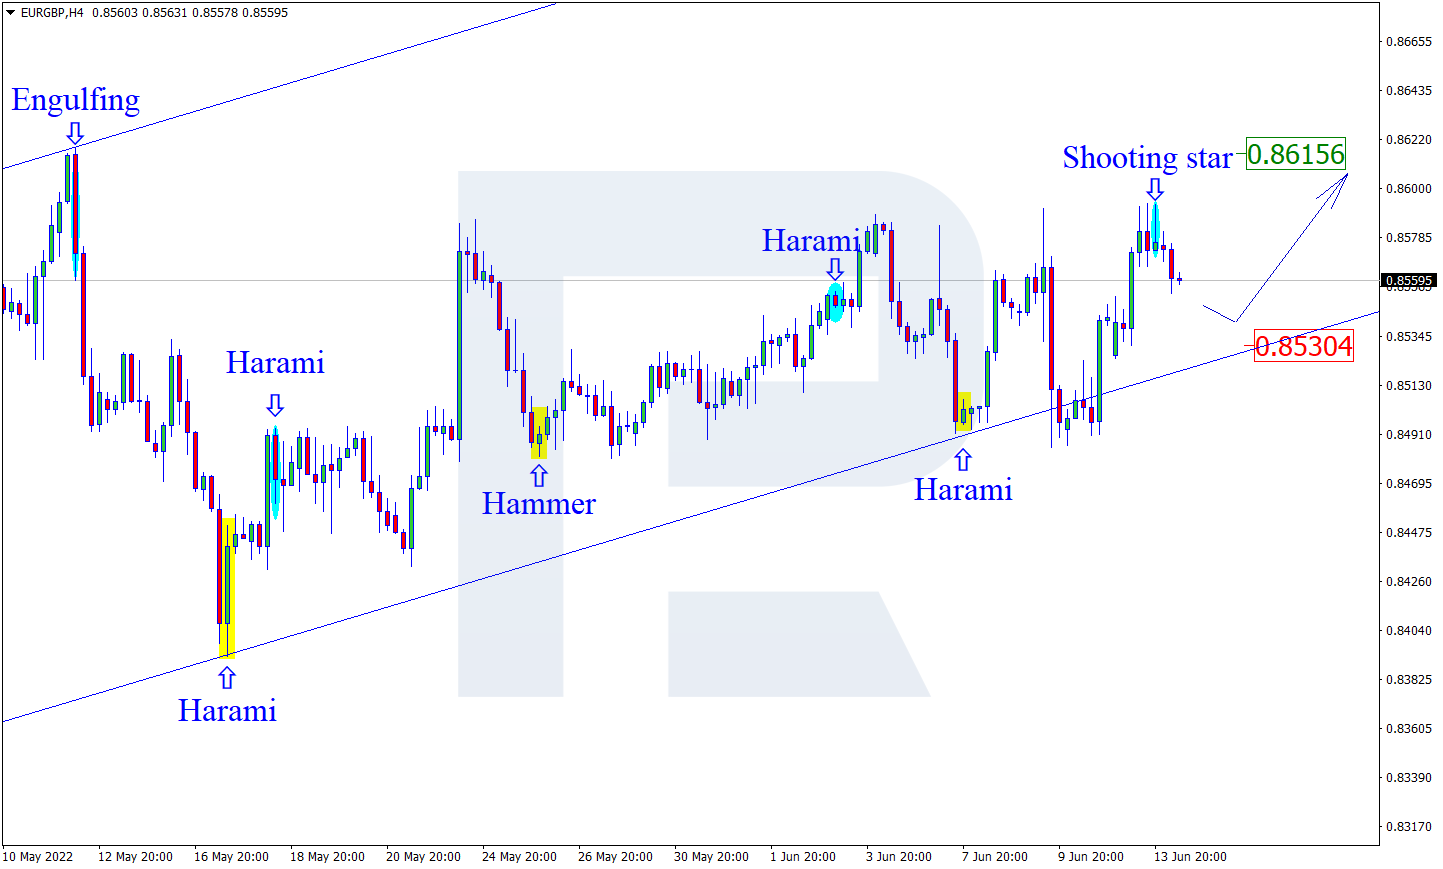
EURGBP, “Euro vs Great Britain Pound”
On H4 at the resistance level the pair formed a Shooting Star. Going by the pattern can result in a correction impulse. The goal of the pullback can be 0.8530. Upon testing it and bouncing off it, the pair has a chance for continuing the uptrend. However, the quotes can grow to 0.8615 without a pullback to the support level.
Attention! Forecasts presented in this section only reflect the author’s private opinion and should not be considered as guidance for trading. RoboForex LP bears no responsibility for trading results based on trading recommendations described in these analytical reviews.
ECB member Kazimir said yesterday that he sees a clear need for a 50 basis point rate hike in September. Such hawkish rhetoric from ECB officials is very rare. This means that sentiment within the bank is driven by a more aggressive tightening of monetary policy. On the other hand, according to WSJ, Fed officials may approve a 0.75% interest rate hike this week. Such an announcement led to an even stronger US dollar.
Trading recommendations
Support levels: 1.0379
Resistance levels: 1.0509, 1.0563, 1.0611, 1.0680
From the technical point of view, the trend on the EUR/USD currency pair on the hourly time frame is bearish. The price is steadily declining. The MACD indicator is in the negative zone with signs of oversold and divergence. Under such market conditions, it is better to wait for a small pullback, as the price has strongly deviated from the averages. Sell deals can be considered from the resistance level 1.0509 or 1.0563, but only after the additional confirmation. Buy trades are best to look for on intraday time frames from the support level of 1.0379, but only with confirmation and short targets.
Alternative scenario: if the price breaks out through the 1.0680 resistance level and fixes above, the uptrend will likely resume.
News feed for 2022.06.14:
– Eurozone German Consumer Price Index (m/m) at 09:00 (GMT+3);
– Eurozone German ZEW Economic Sentiment (m/m) at 12:00 (GMT+3);
– Eurozone ZEW Economic Sentiment (m/m) at 12:00 (GMT+3);
– US Producer Price Index (m/m) at 15:30 (GMT+3).
The GBP/USD currency pair
Technical indicators of the currency pair:
Prev Open: 1.2310
Prev Close: 1.2132
% chg. over the last day: -1.46%
The Bank of England will hold its monetary policy meeting this week. Analysts think that the Bank of England will raise the rate by 25 basis points for the fourth time as policymakers continue to balance the risk of persistently high inflation against growth uncertainty. However, the combination of Friday’s US inflation surprise and hawkish statements from European Central Bank officials means that investors expect a 75 basis point rate hike in the next two meetings, and predict that the Bank of England rate will reach nearly 3.5% by this time next year. This is despite the fact that the Bank of England said at its last meeting in May that market expectations were exaggerated.
From the technical point of view, the trend on the GBP/USD currency pair on the hourly time frame is bearish. The MACD indicator is in the negative zone with signs of oversold and divergence. Under such market conditions, it is better to wait for a small pullback, as the price has strongly deviated from the averages. Sell deals can be considered from the resistance level of 1.2265, but only after the additional confirmation. Buy trades are best to look for on intraday time frames from the support level of 1.2127, but only with confirmation and short targets.
Alternative scenario: if the price breaks out through the 1.2523 resistance level and fixes above, the uptrend will likely resume.
News feed for 2022.06.14:
– UK Average Earnings Index (m/m) at 09:00 (GMT+3);
– UK Claimant Count Change (m/m) at 09:00 (GMT+3);
– UK Unemployment Rate (m/m) at 09:00 (GMT+3).
The USD/JPY currency pair
Technical indicators of the currency pair:
Prev Open: 134.32
Prev Close: 134.39
% chg. over the last day: +0.05%
The fundamental picture of the USD/JPY currency pair remains the same. The Federal Reserve is tightening the policy, while Japan is holding an accommodative monetary policy. The interest rate differential in favor of placing dollars against the yen is rising sharply. As a result, the dollar index is rising, and the Japanese yen is getting cheaper. The Japanese public is very indignant about the weakening of the yen. Since the elections to the upper house will be held in July, the government is very attentive to public concerns. As a result, yesterday, the Japanese government and the central bank issued a rare joint statement expressing concern about the yen’s sharp decline. Some investors fear either currency intervention or indecision to hold bond yields.
Trading recommendations
Support levels: 132.00, 131.00, 130.12, 129.48, 128.76, 128.10, 127.64
Resistance levels: 135.16
The medium-term trend on the USD/JPY currency pair is bullish. But there are signs of slowing growth, and divergence is already observed in several timeframes. It is best to wait for a slight correction, as the price has deviated strongly from the average lines. Buy trades can be considered from the support level of 132.00, but with confirmation. A resistance level of 135.16 is good for sell deals, but only with additional confirmation in the form of a reverse initiative and short targets.
Alternative scenario: If the price fixes below 132.00, the downtrend will likely resume.
There is no news feed for today.
The USD/CAD currency pair
Technical indicators of the currency pair:
Prev Open: 1.2780
Prev Close: 1.2897
% chg. over the last day: +0.92%
The USD/CAD currency pair grows for the fifth day in a row. Even a rise in oil prices on Monday could not give confidence to the Canadian currency, which is a commodity currency, as the rise in the dollar index is supported by the hawkish intentions of the Federal Reserve to raise the interest rate by 75 basis points tomorrow.
Trading recommendations
Support levels: 1.2815, 1.2765, 1.2685, 1.2618, 1.2578, 1.2510
Resistance levels: 1.2893, 1.2953
In terms of technical analysis, the trend on the USD/CAD currency pair is bullish. The price is steadily growing but has reached an important resistance level now. The MACD indicator shows that it is overbought and there are signs of divergence. Under such market conditions, it is better to look for buy deals in the lower time frames from the support level of 1.2815 or 1.2765. For sell deals, it is better to consider the resistance level of 1.2893, but it is also better with confirmation and short targets.
Alternative scenario: if the price breaks through and consolidates below the 1.2578 support level, the downtrend will likely resume.
This article reflects a personal opinion and should not be interpreted as an investment advice, and/or offer, and/or a persistent request for carrying out financial transactions, and/or a guarantee, and/or a forecast of future events.
– King dollar kicked off the new week on a solid note, asserting its dominance against all G10 currencies as investors evaluated last Friday’s red-hot US inflation figures and China’s Covid woes.
Rising Treasury yields remained an ally to the greenback with the Dollar Index (DXY) advancing above 104.60 as of writing.
The equally-weighted USD index also pushed higher as prices ventured to regions not seen since mid-May.
With bulls in the driving seat, the greenback could be set to hit fresh two-decade highs in the week ahead. However, such a move may need to be triggered by a catalyst in the form of the Fed meeting on Wednesday or economic data later in the week.
The low down…
US inflation unexpectedly accelerated to 8.6% last month which was the highest level in more than 40 years.
This rocked financial markets and fuelled fears of more aggressive interest rate hikes by the Federal Reserve. Markets were initially forecasting consumer prices to hit 8.3%…but the red-hot figure poured cold water on hopes of inflation peaking. Investors are set to remain on high alert with expectations mounting over the Fed adopting a more aggressive approach towards taming the inflation beast.
This latest development could add more flavour to the upcoming Fed meeting on Wednesday, especially Jerome Powell’s press conference after the rate decision.
The week ahead…
The major risk event for the dollar will be the Fed meeting.
Markets widely expect the central bank to raise interest rates by 50 basis points. However, the main attractions are likely to be the economic projections, dot plot, and most importantly Powell’s post-meeting news conference.
According to a report on Bloomberg, traders are projecting the Fed to raise interest rates by 75 basis points at least once in its next three meetings. The last time the central bank raised interest rates by 75 basis points was back in November 1994! Much attention will also be directed towards the economic projections which could provide clues on how long the Fed plans to raise rates and its impact on economic growth. Another hawkish set of dot plots could spark some action and keep dollar bulls in good health.
If Jerome Powel strikes a hawkish tone during his conference and signals the Fed maintaining its aggressive approach towards rates, dollar bulls could be empowered. Alternatively, a cautious sounding Powell may cool rate hike bets, limiting the dollar’s upside gains.
On the data front, it may be wise to keep an eye on the US weekly initial jobless claims on Thursday and US May industrial production on Friday. Given how both reports could provide further insight into the health of the US economy, this could impact the dollar.
Dollar set to tighten grip on throne?
It looks like the equally-weighted USD Index could be gearing to push higher with 1.1850 acting as a key level of interest.
Prices remain bullish on the weekly timeframe and daily timeframe. Beyond 1.1850, the next key point can be found at 1.2070. A solid breakout above 1.2070 could open the doors towards 1.2300.
Should 1.1850 prove to be reliable resistance, a decline back towards 1.1450 could become reality.
On the daily charts, things look slightly more colourful. Prices are pushing higher with 1.1850 acting as the first level of interest. A breakout above this level could open the doors towards 1.1950 and 1.2070. Sustained weakness below 1.1850 could open a path lower towards 1.116, 1.1450, and 1.1350, respectively.
US inflation accelerated in May, while core inflation failed to dip below 6%. Demand continues to outpace the supply side of the US economy, and with supply factors showing no signs of short-term improvement, the Fed may raise interest rates through the end of the year. This outlook sharply increased the dollar index on Friday, causing major currencies to fall against the US dollar. On Friday, Spain also released its inflation data, which showed an increase from 8.3% to 8.7% year-over-year. German, French, and Italian inflation data will also be released this week, followed by the total Eurozone value at the end of the week.
Trading recommendations
Support levels: 1.0445, 1.0379
Resistance levels: 1.0509, 1.0563, 1.0611, 1.0680
From the technical point of view, the trend on the EUR/USD currency pair on the hourly time frame has changed to bearish. The price confidently broke through the priority change level and consolidated below the moving averages. The MACD indicator is in the negative zone with signs of oversold. Under such market conditions, it is better to wait for a small pullback, as the price has strongly deviated from the averages. Sell deals can be considered from the resistance level 1.0563 or 1.0611, but only after the additional confirmation. Buy trades are best to look for on intraday time frames from the support level of 1.0445, but only with confirmation and short targets.
Alternative scenario: if the price breaks out through the 1.0680 resistance level and fixes above, the uptrend will likely resume.
News feed for 2022.06.13:
– US FOMC Member Brainard Speaks at 21:00 (GMT+3).
The GBP/USD currency pair
Technical indicators of the currency pair:
Prev Open: 1.2493
Prev Close: 1.2315
% chg. over the last day: -1.45%
Like the euro, the British pound fell against the dollar after Friday’s inflation data. Today the UK will release its GDP data for the quarter. GDP is expected to show a growth of 0.2%. If the actual data is worse than expected, it may be positive for the GBP as slower than expected economic growth will likely lead to a more aggressive policy from the Bank of England, which in turn will support the GBP. Traders should also pay attention to industrial production data.
From the technical point of view, the GBP/USD currency pair trend on the hourly time frame has changed to bearish. The price confidently broke through the priority change level and consolidated below the moving averages. The MACD indicator is in the negative zone with signs of oversold and with no signs of reversal. Under such market conditions, it is better to wait for a small pullback, as the price has strongly deviated from the averages. Sell deals can be considered from the resistance level of 1.2363 or 1.2422, but only after the additional confirmation. Buy trades are best to look for on intraday time frames from the support level of 1.2265, but only with confirmation and short targets.
Alternative scenario: if the price breaks out through the 1.2523 resistance level and fixes above, the uptrend will likely resume.
News feed for 2022.06.13:
– UK GDP (q/q) at 09:00 (GMT+3);
– UK Industrial Production (m/m) at 09:00 (GMT+3).
The USD/JPY currency pair
Technical indicators of the currency pair:
Prev Open: 134.32
Prev Close: 134.38
% chg. over the last day: +0.04%
Japan’s monetary policy remains ultra-soft. Nevertheless, in economic terms and bank reports, there are signs that a period of tightening may be on the horizon. Governor Haruhiko Kuroda retracted his earlier comments, saying consumers have become more tolerant of higher prices. The weak yen has also exacerbated already expensive energy imports. But no changes to the bank’s yield curve management program are expected for now. Despite a rise in inflation above the 2% target, overnight index swaps (OIS) show little chance of a rate change over the next few meetings.
The medium-term trend on the USD/JPY currency pair is bullish. The price is growing steadily. The MACD indicator is in the positive zone, but there are signs of price slowing down, and divergence is already observed on several timeframes. It is best to wait for a slight correction, as the price has deviated strongly from the average lines. Buy trades can be considered from the support level of 134.44, but with confirmation. A resistance level of 135.16 is good for sell deals, but only with additional confirmation in the form of a reverse initiative and short targets.
Alternative scenario: If the price fixes below 132.00, the downtrend will likely resume.
There is no news feed for today.
The USD/CAD currency pair
Technical indicators of the currency pair:
Prev Open: 1.2698
Prev Close: 1.2785
% chg. over the last day: +0.68%
The USD/CAD currency pair rose for the fourth day in a row as lower oil prices along with a stronger US dollar contributed to the rise in quotes. Canada’s unemployment rate fell from 5.2% to 5.1%, indicating that the labor market remains strong. The fundamental picture is such that both the dollar index and the Canadian dollar have central bank support, so no medium-term trends should be expected in this currency pair.
Trading recommendations
Support levels: 1.2765, 1.2685, 1.2618, 1.2578, 1.2510
Resistance levels: 1.2815, 1.2893, 1.2953
In terms of technical analysis, the trend on the USD/CAD currency pair has changed to bullish. The price confidently broke through the priority change level and consolidated above. The MACD indicator shows that it is overbought, and there are signs of divergence. Under such market conditions, it is better to look for buy deals in the lower time frames from the support level of 1.2685 or 1.2618. For sell deals, it is better to consider the resistance level of 1.2815, but it is also better with confirmation and short targets.
Alternative scenario: if the price breaks through and consolidates below the 1.2578 support level, the downtrend will likely resume.
This article reflects a personal opinion and should not be interpreted as an investment advice, and/or offer, and/or a persistent request for carrying out financial transactions, and/or a guarantee, and/or a forecast of future events.