By JustForex
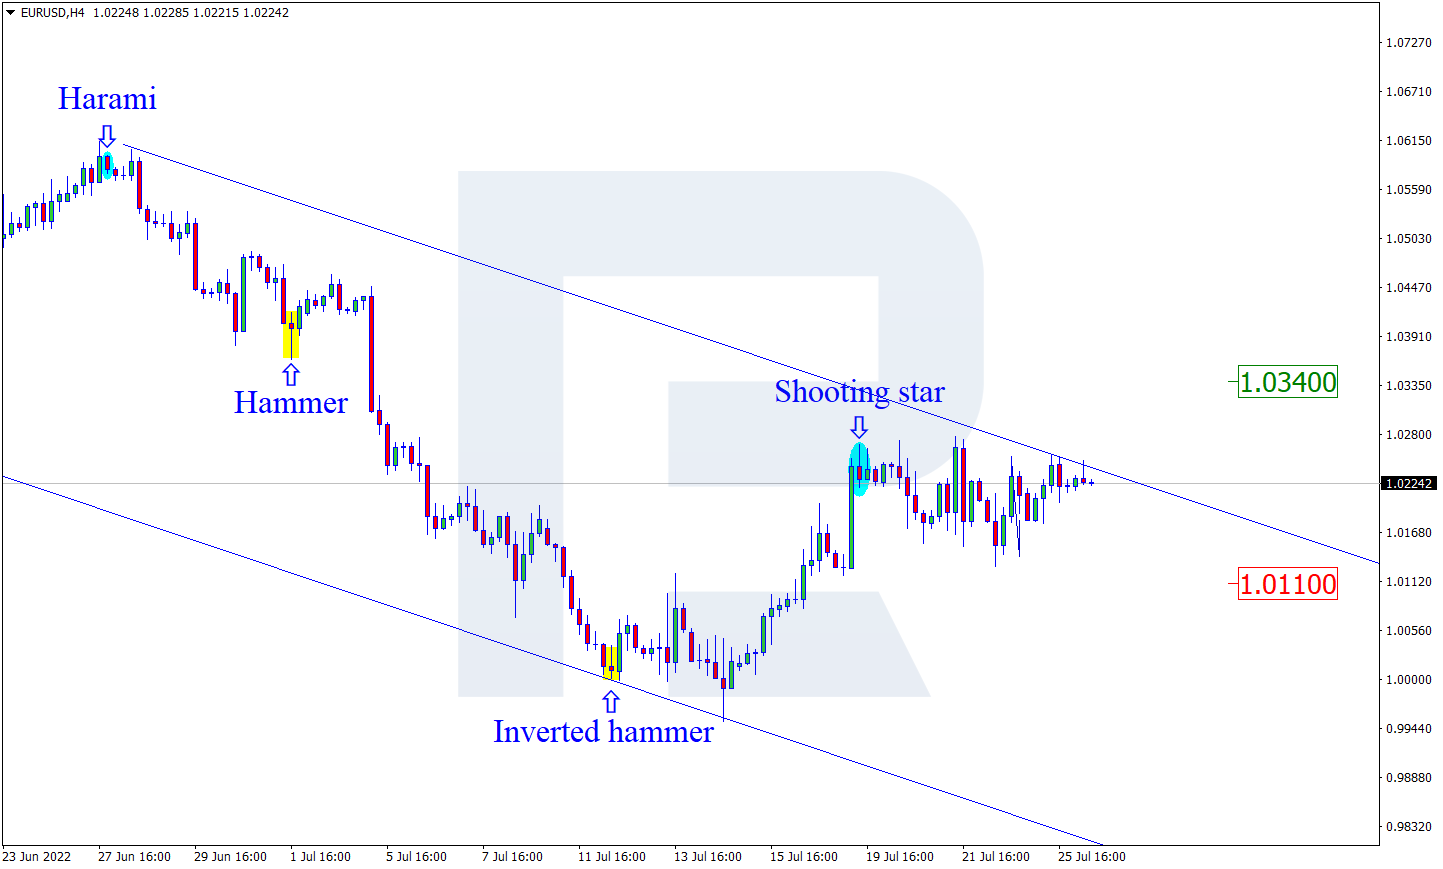
The EUR/USD currency pair
- Prev Open: 1.0215
- Prev Close: 1.0117
- % chg. over the last day: -0.96%
TOn Tuesday, the dollar rose against a basket of major currencies ahead of an important US Federal Reserve meeting. At the same time, concerns about the possibility of another reduction in Russian gas supplies put pressure on the euro. Hedge fund EDL Capital is betting that the euro will fall to 80 cents to the dollar as rampant inflation fuels volatility in politics and bond markets, which could test the region’s unity. The EDL founder points out that risks related to Russian gas supplies will lead to record inflation in Europe, causing aggressive rate hikes during the recession and forcing Germany to potentially forego the cost of maintaining Eurozone unity.
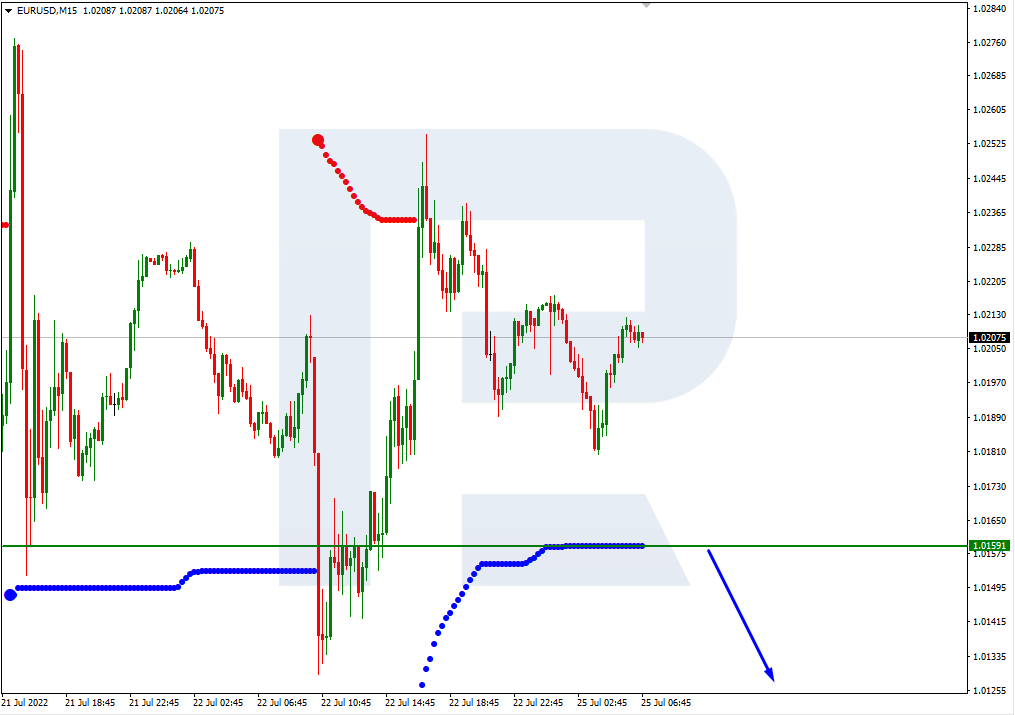
- Support levels: 1.0120, 1.0035, 1.0000
- Resistance levels: 1.0171, 1.0202, 1.0250, 1.0284, 1.0365, 1.0415, 1.050
From the technical point of view, the trend on the EUR/USD currency pair on the hourly time frame is bullish. The price is forming a wide balance, but there is seller pressure. The MACD indicator has become negative. Under such market conditions, it is best to look for buy trades on intraday time frames from the support level of 1.0120, but only with confirmation. Sell trades can be considered from the resistance level of 1.0171 or 1.0202, but only after additional confirmation and only with short targets.
Alternative scenario: if the price breaks down through the 1.0035 support level and fixes below, the downtrend will likely resume.

- – US Core Durable Goods Orders (m/m) at 15:30 (GMT+3);
- – US Pending Home Sales (m/m) at 17:00 (GMT+3);
- – US Crude Oil Reserves (w/w) at 17:30 (GMT+3);
- – US FOMC Statement at 21:00 (GMT+3);
- – US Fed Interest Rate Decision at 21:00 (GMT+3);
- – US FOMC Press Conference at 21:30 (GMT+3).
The GBP/USD currency pair
- Prev Open: 1.2035
- Prev Close: 1.2025
- % chg. over the last day: -0.08%
On Tuesday, the pound sterling hit a two-week high as analysts assessed the prospect of a 50 basis point rate hike by the Bank of England amid a deteriorating economic outlook. But there is also the other side. The worsening economic outlook will pressure the Bank of England to take a less hawkish stance. A Reuters poll of economists indicates that the Bank of England will stick to a gradual 0.25% hike. Currently, the interest rate differential between the US Fed and the Bank of England is in favor of lower GBP/USD quotes.
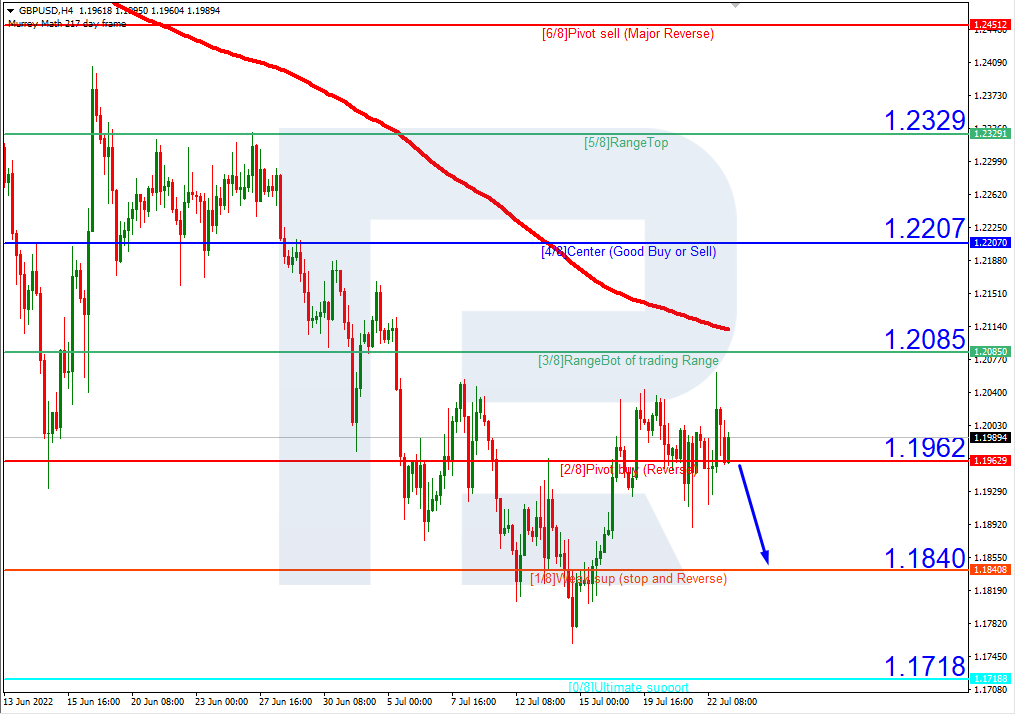
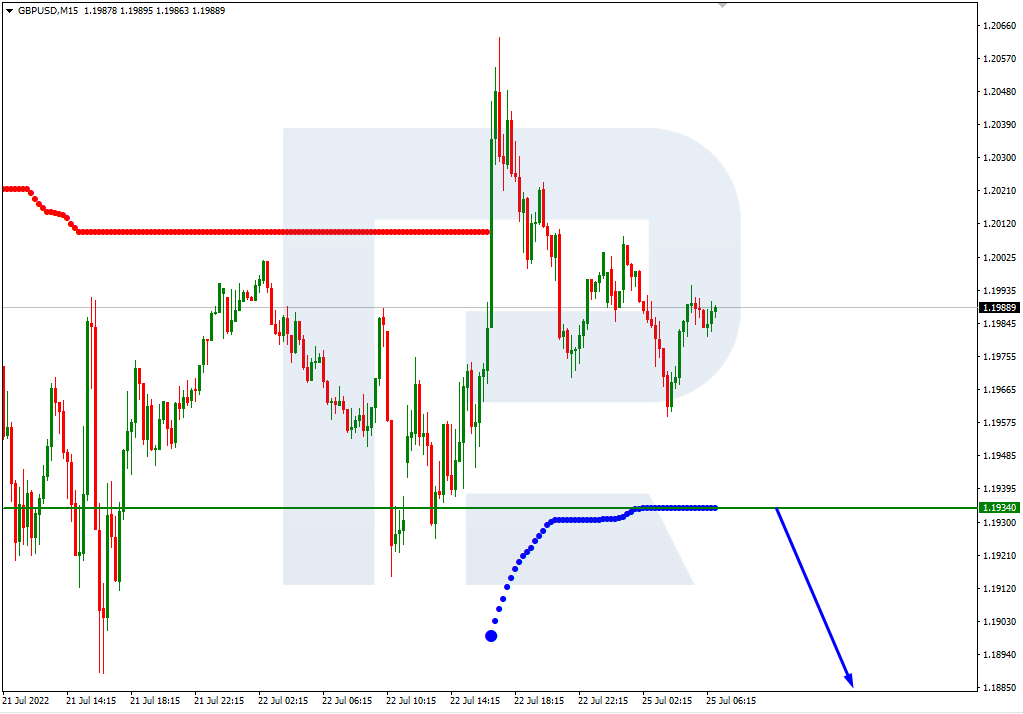
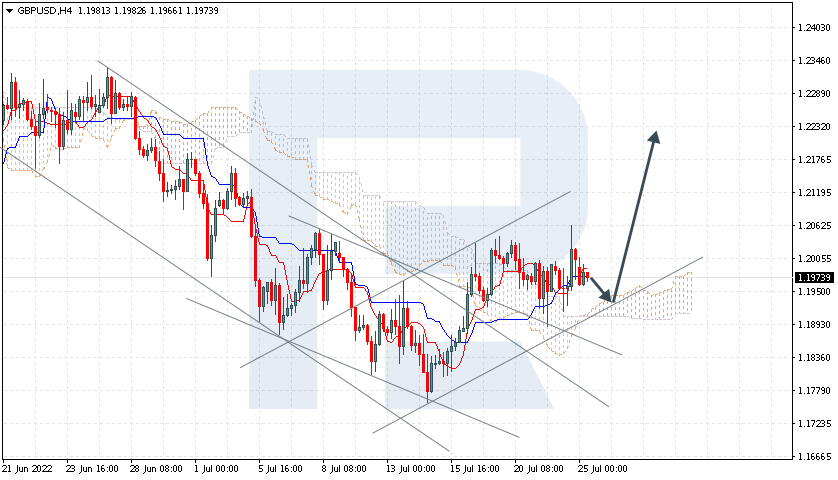
- Support levels: 1.2027, 1.1907, 1.1803
- Resistance levels: 1.2056, 1.2085, 1.2137
From the technical point of view, the trend on the GBP/USD currency pair on the hourly time frame is bullish. Buyers’ pressure remains, but there was a false break out of yesterday’s highs. The MACD indicator shows signs of divergence. Under such market conditions, buy trades are best to look at intraday time frames from the support level of 1.2027, but only with confirmation. Sell trades can be considered from the resistance level of 1.2056, but only after additional confirmation and with short targets.
Alternative scenario: if the price breaks down through the 1.1907 support level and fixes below, the downtrend will likely resume.

- – US FOMC Statement at 21:00 (GMT+3);
- – US Fed Interest Rate Decision at 21:00 (GMT+3);
- – US FOMC Press Conference at 21:30 (GMT+3).
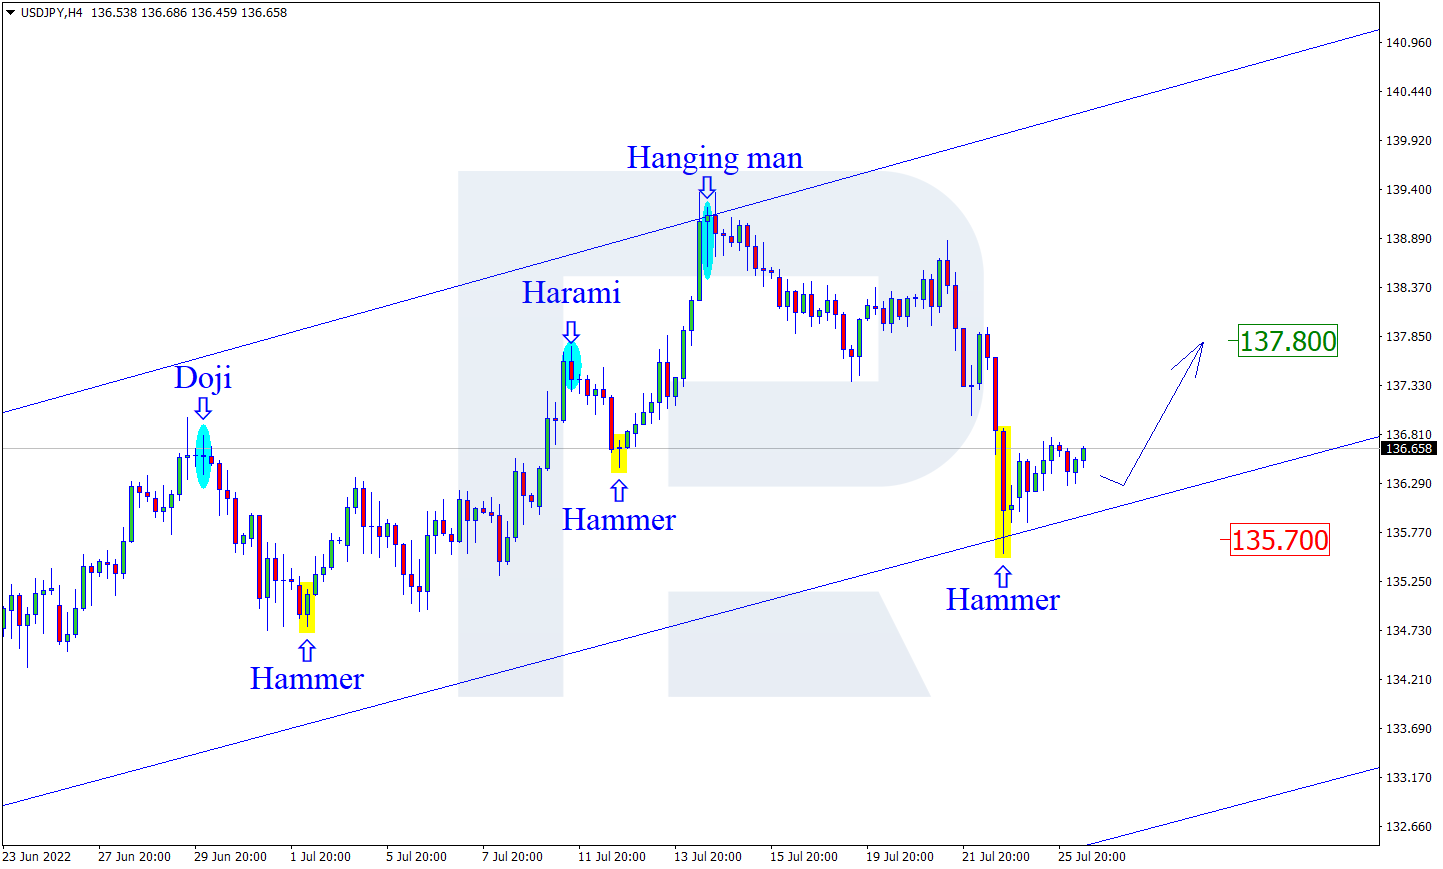
The USD/JPY currency pair
- Prev Open: 136.65
- Prev Close: 136.92
- % chg. over the last day: +0.20%
The US Federal Reserve will raise rates by 0.75-1% today, further widening the gap between the US and Japanese central banks. For the Japanese yen, fundamentally, there is no reason to strengthen right now, as the Bank of Japan is still sticking to its soft monetary policy and is not going to take a hawkish stance anytime soon.
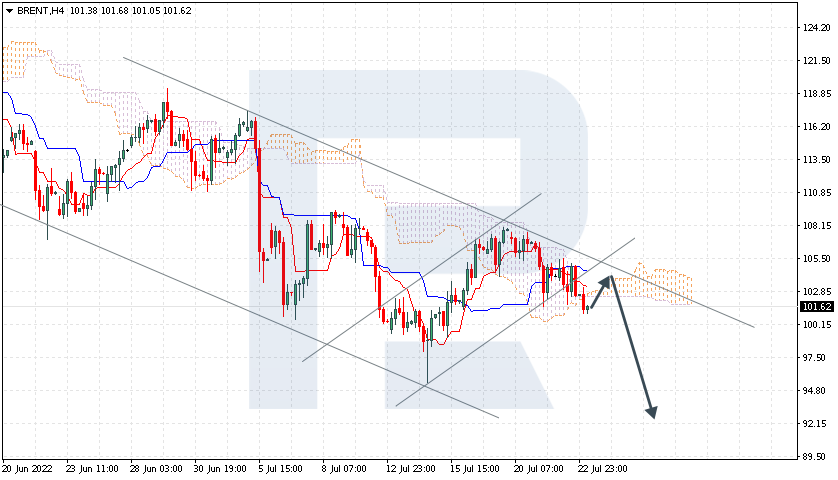
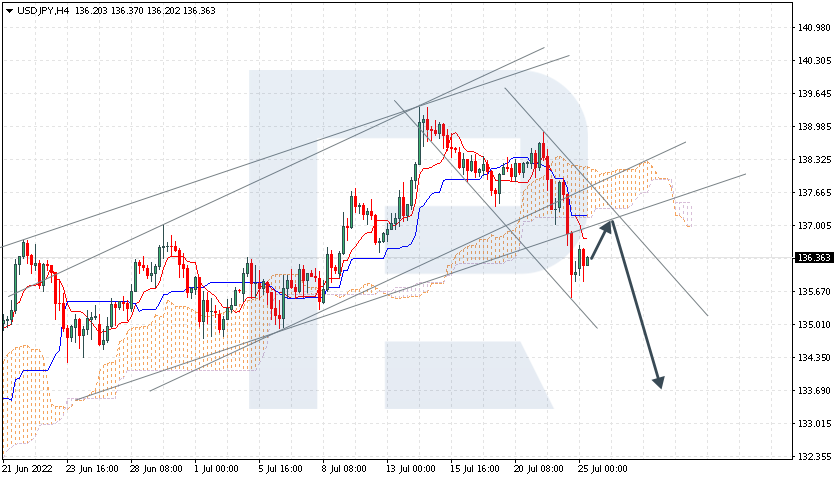
- Support levels: 136.70, 135.99, 135.40, 134.64, 134.11
- Resistance levels: 137.26, 137.81, 138.25, 138.56, 140.29
From the technical point of view, the medium-term trend on the USD/JPY currency pair is bearish. Any fundamental factors do not accompany the fall in the USD/JPY quotes, so traders should be careful. The price is now trading between the moving averages. The MACD indicator has become positive. Under such market conditions, buy trades can be searched for intraday from the support level of 136.70, but with additional confirmation. For sell deals, traders can consider the resistance level of 137.26 or 137.81, but only with additional confirmation and short targets.
Alternative scenario: If the price fixes above 138.25, the uptrend will likely resume.

- – US FOMC Statement at 21:00 (GMT+3);
- – US Fed Interest Rate Decision at 21:00 (GMT+3);
- – US FOMC Press Conference at 21:30 (GMT+3).
The USD/CAD currency pair
- Prev Open: 1.2845
- Prev Close: 1.2883
- % chg. over the last day: +0.29%
The Canadian dollar is a commodity currency highly dependent on the US Dollar Index and oil prices. The US Dollar Index got stronger yesterday in anticipation of the Fed meeting on the interest rate, and oil, on the contrary, went down as the United States is selling more reserves amid the worsening of the economic statistics. As a result, the USD/CAD quotes increased. It should be noted that after the US Fed rate hike of 0.75%, the central banks of the US and Canada will have rates at the same level. Therefore, traders should expect a wide sideways movement on this currency pair without any single dynamics in the coming weeks.
- Support levels: 1.2840, 1.2781
- Resistance levels: 1.2912, 1.3006, 1.3085, 1.3154
In terms of technical analysis, the trend on the USD/CAD currency pair is bearish. At the moment, the price is forming a wide balance and is trading at the levels of the moving lines. The MACD indicator has become inactive again. Under such market conditions, it is best to consider sell deals from the resistance level of 1.2912, but with confirmation. Buy trades should be considered on the lower time frames from the support level 1.2840, but only with confirmation and short targets.
Alternative scenario: if the price breaks out and consolidates above the 1.3006 resistance level, the uptrend will likely be resume.

- – US Crude Oil Reserves (w/w) at 17:30 (GMT+3);
- – US FOMC Statement at 21:00 (GMT+3);
- – US Fed Interest Rate Decision at 21:00 (GMT+3);
- – US FOMC Press Conference at 21:30 (GMT+3).
By JustForex
This article reflects a personal opinion and should not be interpreted as an investment advice, and/or offer, and/or a persistent request for carrying out financial transactions, and/or a guarantee, and/or a forecast of future events.