By ForexTime
Allow me to begin with an important note: this article was published before Fed Chair Jerome Powell is due to make his Jackson Hole speech later today (Friday, August 26th), which may trigger an almighty reaction across global financial markets.
Still, that shouldn’t stop us from already giving you a heads up on major economic data releases and events for the coming week:
Monday, August 29
- AUD: Australia July retail sales
- UK markets closed
Tuesday, August 30
- JPY: Japan July jobless rate
- EUR: Eurozone August economic confidence, Germany August CPI
- USD: US August consumer confidence, New York Fed President John Williams speech
Wednesday, August 31
- JPY: Japan July industrial production, retail sales, August consumer confidence
- CNH: China August PMIs
- EUR: Eurozone August CPI, Germany August unemployment
- EUR: Russian gas flow to Europe halted for 3 days due to Nord Stream pipeline maintenance
- CAD: Canada June/2Q GDP
- USD: Fed speak – Cleveland Fed President Loretta Mester, Atlanta Fed President Raphael Bostic
- US crude: EIA weekly oil inventory report
Thursday, September 1
- AUD: Australia August manufacturing PMI
- CNH: Caixin China August manufacturing PMI
- EUR: Eurozone July unemployment, August manufacturing PMI (final)
- GBP: UK August manufacturing PMI (final)
- USD: US weekly jobless claims, ISM August manufacturing
Friday, September 2
- USD: US August nonfarm payrolls
The euro has already been beleaguered by a confluence of economic woes, including record-high inflation, the ECB’s apparent lag behind the Fed in its own rate hikes, and a darkening economic outlook (no thanks to the war that’s still raging off its eastern borders).
All that has already combined to drag EURUSD below parity, down to levels not seen in 20 years!

And the shared currency may find little solace from the data dump due out of the Eurozone in the coming week:
- August economic confidence (due Tuesday, Aug 30): forecasted to slip further to 97.8 compared to 99.0 in the month prior
- August CPI (due Wednesday, Aug 31): 8.8% estimate, a slight reprieve in the year-on-year headline inflation figure from July’s 8.9% – a record high.
Even an upside surprise in the headline CPI print to a fresh record high (above 8.9%) which potentially pushes the European Central Bank into a steeper rate-hiking cycle, may not be enough to offer support for the euro currency, considering the major concerns swirling about the Eurozone economy.
Worsening energy crisis for Europe?
Also crucially, EU policymakers fear that Russian gas flows may be halted, after the Wednesday-Friday maintenance to the crucial Nord Stream pipeline is completed.
Such a drastic event would only exacerbate Europe’s energy crisis, while dragging EURUSD to lower depths!
US jobs report to have major say on EURUSD
And of course, the USD half of EURUSD will also hold tremendous sway over the world’s most popularly-traded currency pair.
And markets will be keenly awaiting the August US nonfarm payrolls report, due on September 2nd.
The median estimate in Bloomberg’s survey of economists predict a 300,000 increase in US jobs created this month. If so, that would be lower than July’s 528k print, and also the lowest number of monthly jobs created since December 2019.
However, the US unemployment rate is forecasted to remain at a five-decade low of 3.5%.
Investors and traders worldwide may still interpret the relatively lower headline NFP print as a sign that US jobs growth momentum is waning.
That may suggest that the Fed will take a more gradual approach with its rate hikes (shy away from supersized 75 basis point hikes and instead be more comfortable with 50-bps hikes or even back to the customary 25bps adjustments).
Such a narrative may translate into a softer US dollar which in turn alleviates the downward pressure on EURUSD and lift this currency pair back above parity.
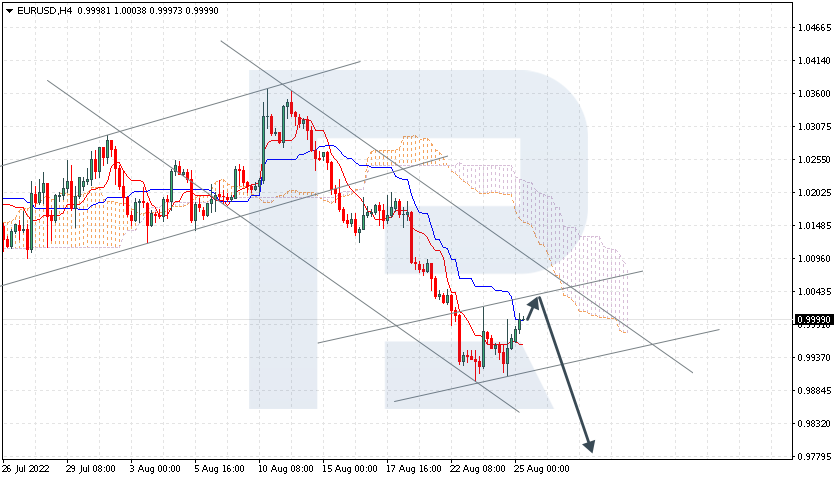
EURUSD forecasted to remain below parity going into September
As things stand (again, before Powell’s speech due later today at Jackson Hole), here are some probabilities over potential EURUSD levels for you to mull over:
- Using 2002’s price action for reference, further declines for EURUSD below its recent cycle low of 0.99 should see stronger support around the 0.96 region.
However, markets are only pricing in a mere 1.8% chance of such a drastic drop to such lows in the week ahead (at the time of writing). - To the upside, the 1.0000 parity level now plays the crucial role as immediate resistance, with stronger resistance set to arrive around 1.009 (late-July cycle lows), following by EURUSD’s 50-day simple moving average around 1.02.
- Overall, there appears to be a greater-than-even chance (58%) that EURUSD should stay below parity over the coming week.
In summary, as long as king dollar remains well bid in anticipation of more supersized Fed rate hikes, coupled with growing pessimism surrounding the Eurozone, that should heap more downward pressure on EURUSD.
 Article by ForexTime
ForexTime Ltd (FXTM) is an award winning international online forex broker regulated by CySEC 185/12 www.forextime.com