By ForexTime
– This could be another big week for king dollar as all attention falls on Friday’s nonfarm payroll report.
After receiving fresh inspiration from Fed hawks last week, the greenback could charge higher if the pending US jobs data ticks all the boxes for more aggressive rate hikes. Alternatively, bulls may be humbled if the data fails to meet expectations. Whatever the outcome on Friday, it may be wise to brace for explosive levels of volatility, especially in the FX space.
With market players tense and on the fence ahead of this major event, the dollar remains in a range – waiting for a potent fundamental spark to make its next big move. With this catalyst likely to be the NFP, this could provide a great opportunity to identify trading opportunities for September.
Our focus today will be major currency pairs with our tool of choice none other than technical analysis.
DXY hovers around 109.00
The path of least resistance for the dollar points north but a fresh catalyst may be needed for bulls to switch into a higher gear. A solid breakout and daily close above 109.14 could encourage an incline towards 110.00. If bulls run out of steam, a decline back towards 108.25 and 107.30 could be on the cards.

Equally-weighted USD remains bullish
Just like the DXY, the equally weighted USD index remains bullish on the daily charts. There have been consistently higher highs and higher lows while the MACD trades to the upside. The upside momentum could take prices towards 1.2184 and potentially higher. A move back below 1.1950 may open the doors back towards the 50-day Simple Moving Average at 1.1860.

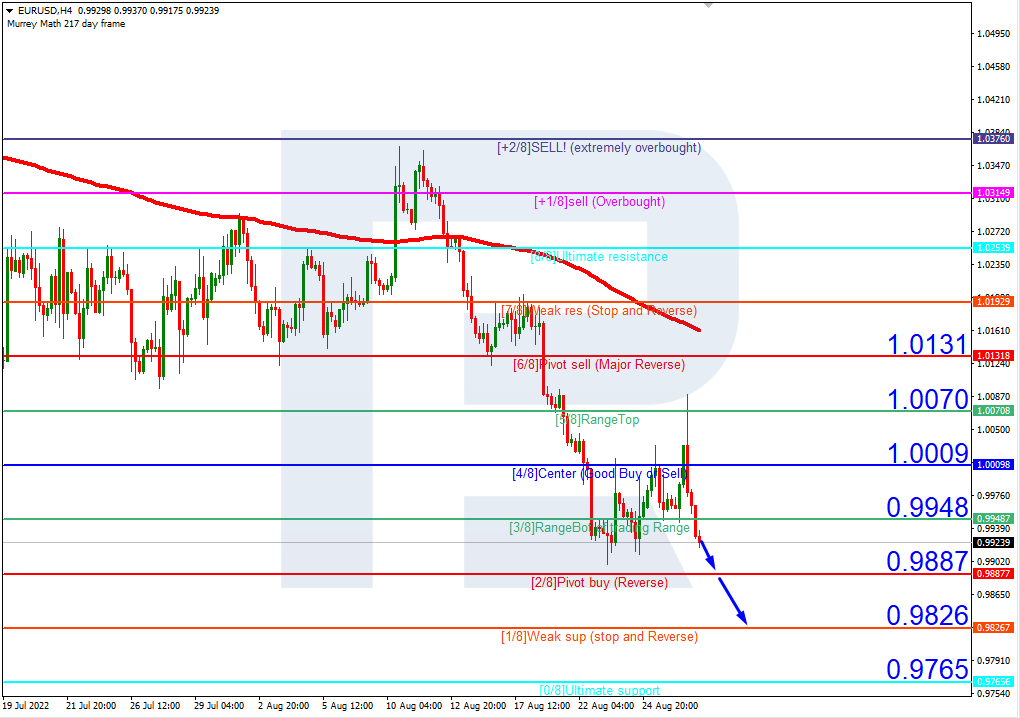
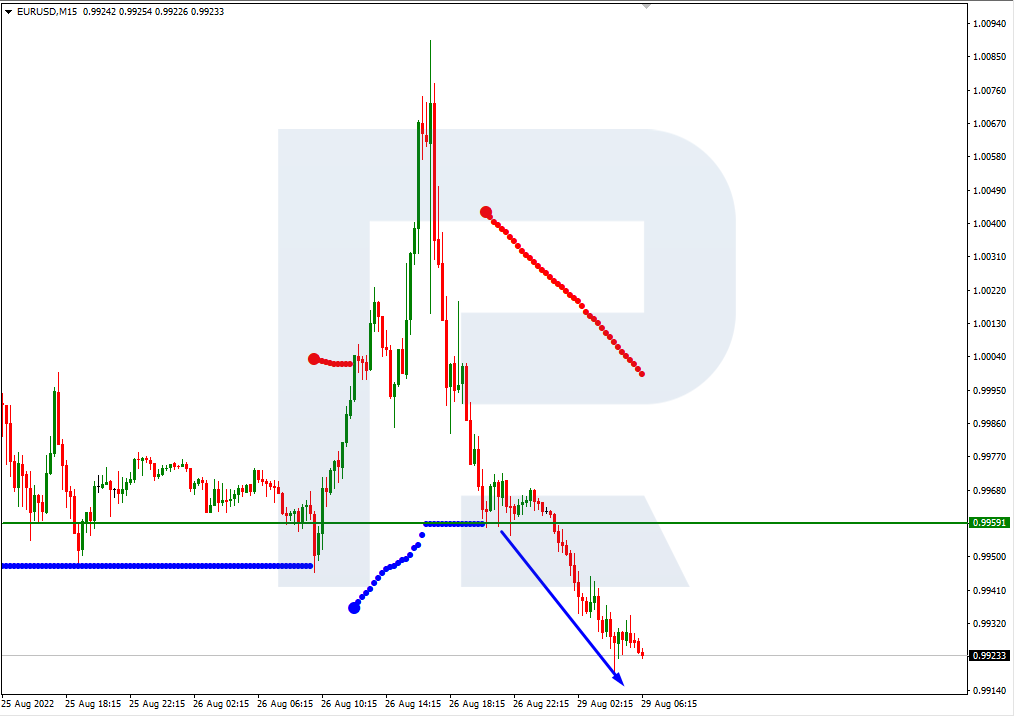
EURUSD to retest 0.9900?
After breaking below parity, the EURUSD has remained shaky and vulnerable to losses. Bears clearly remain in a position of power with their eyes locked on 0.9900. A strong breakdown below this point may indicate a selloff towards 0.9800 and lower.

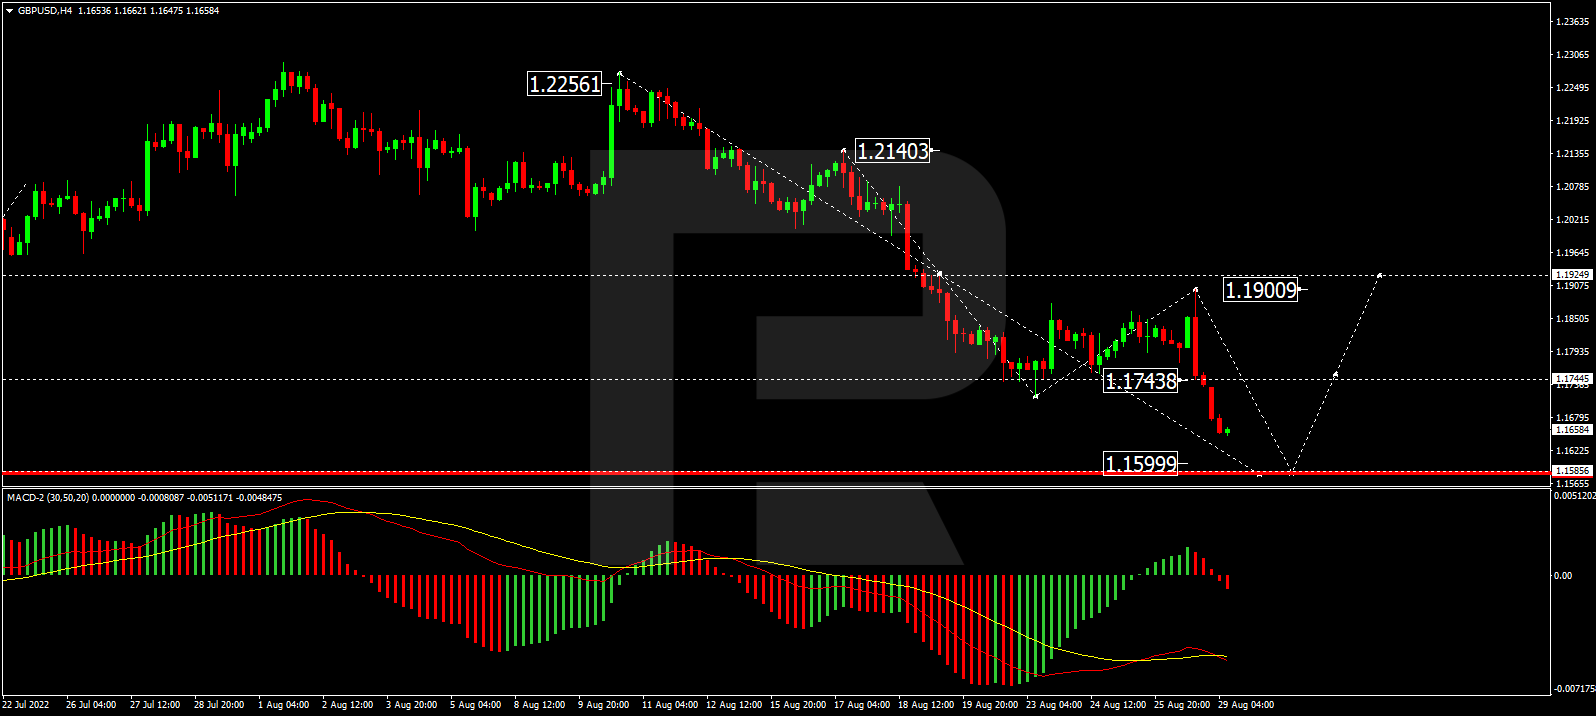
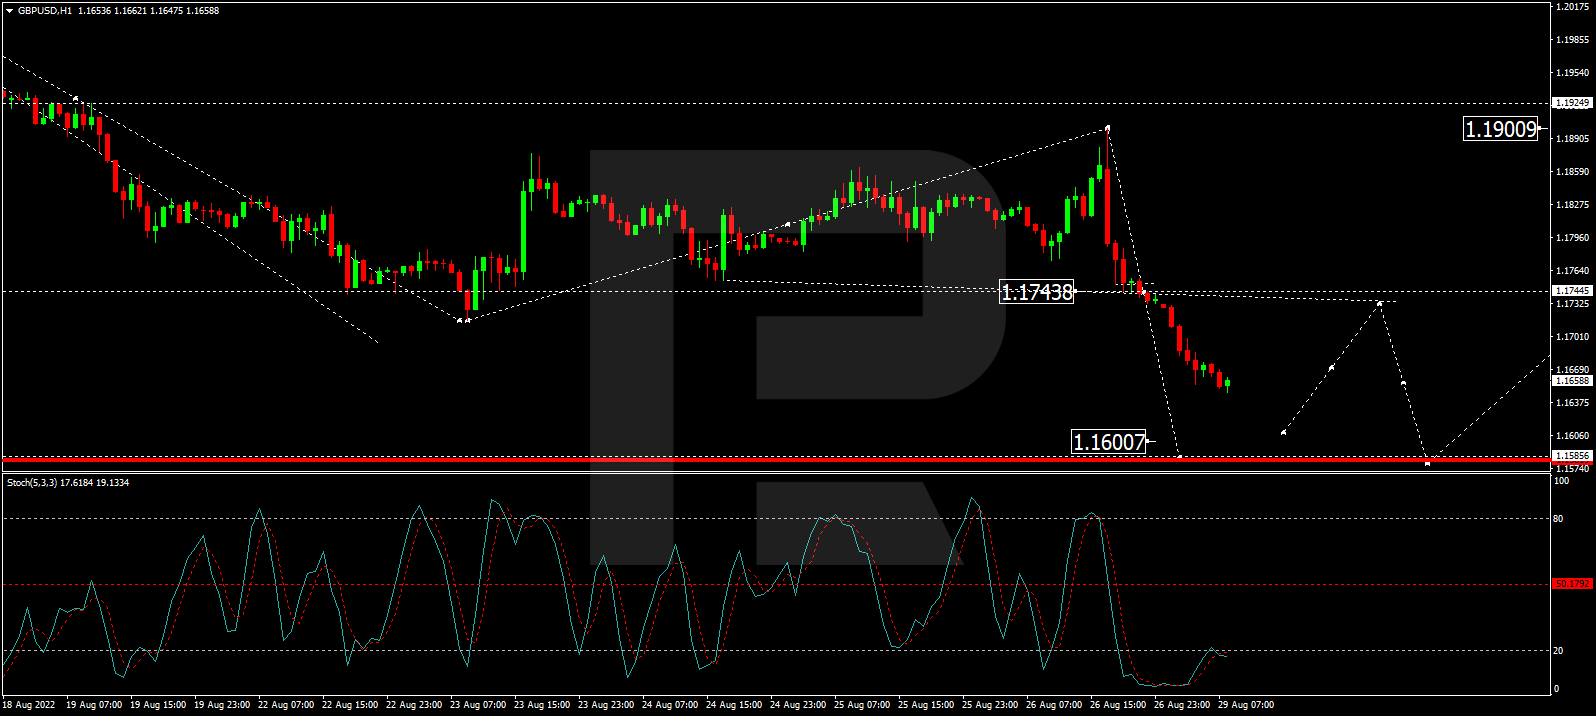
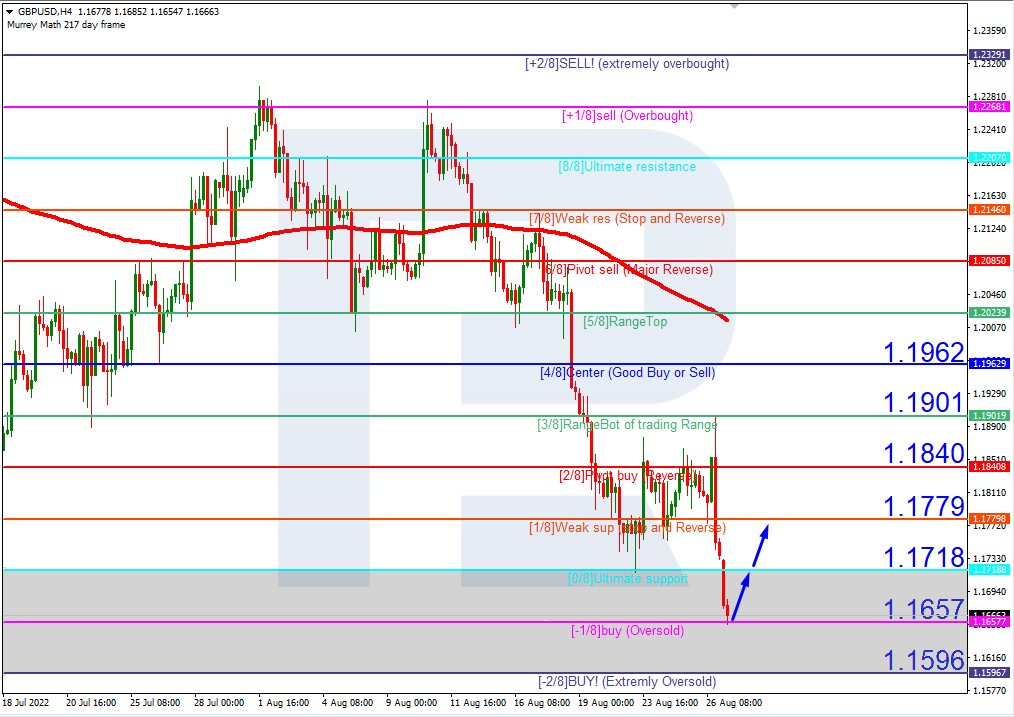
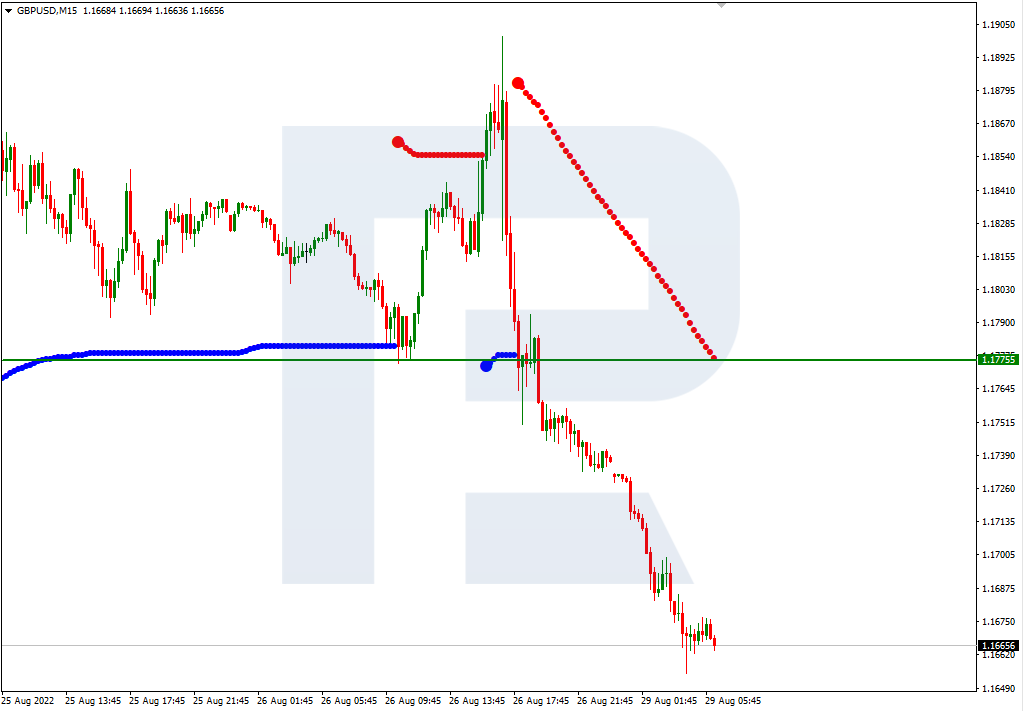
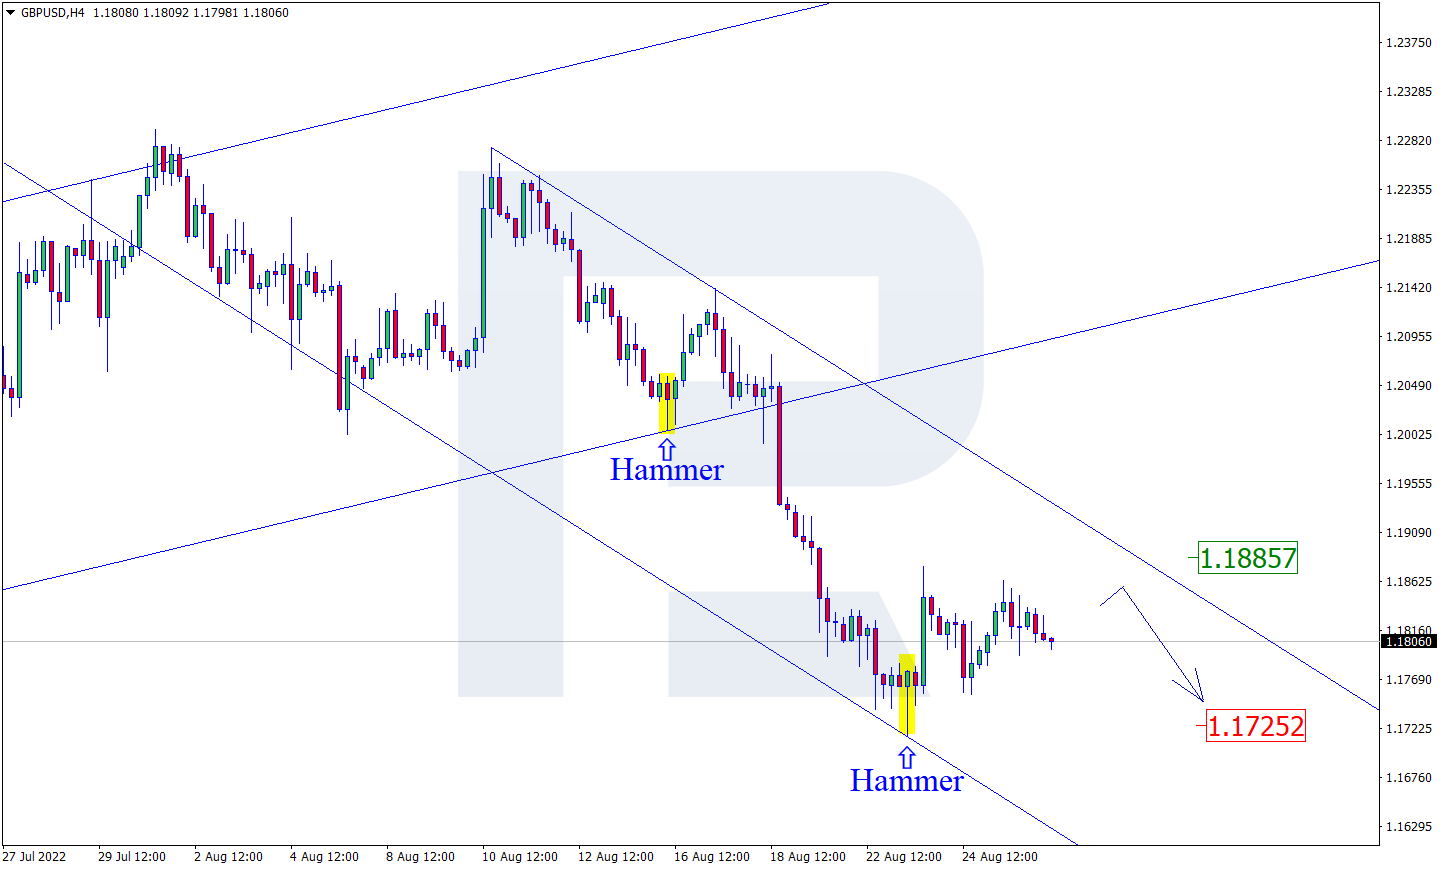
GBPUSD ventures towards 1.1600
An appreciating dollar continues to drag the GBPUSD lower. A strong break below 1.1600 may result in a decline towards 1.1500. If 1.1600 proves to be reliable support, prices could retest 1.17600.

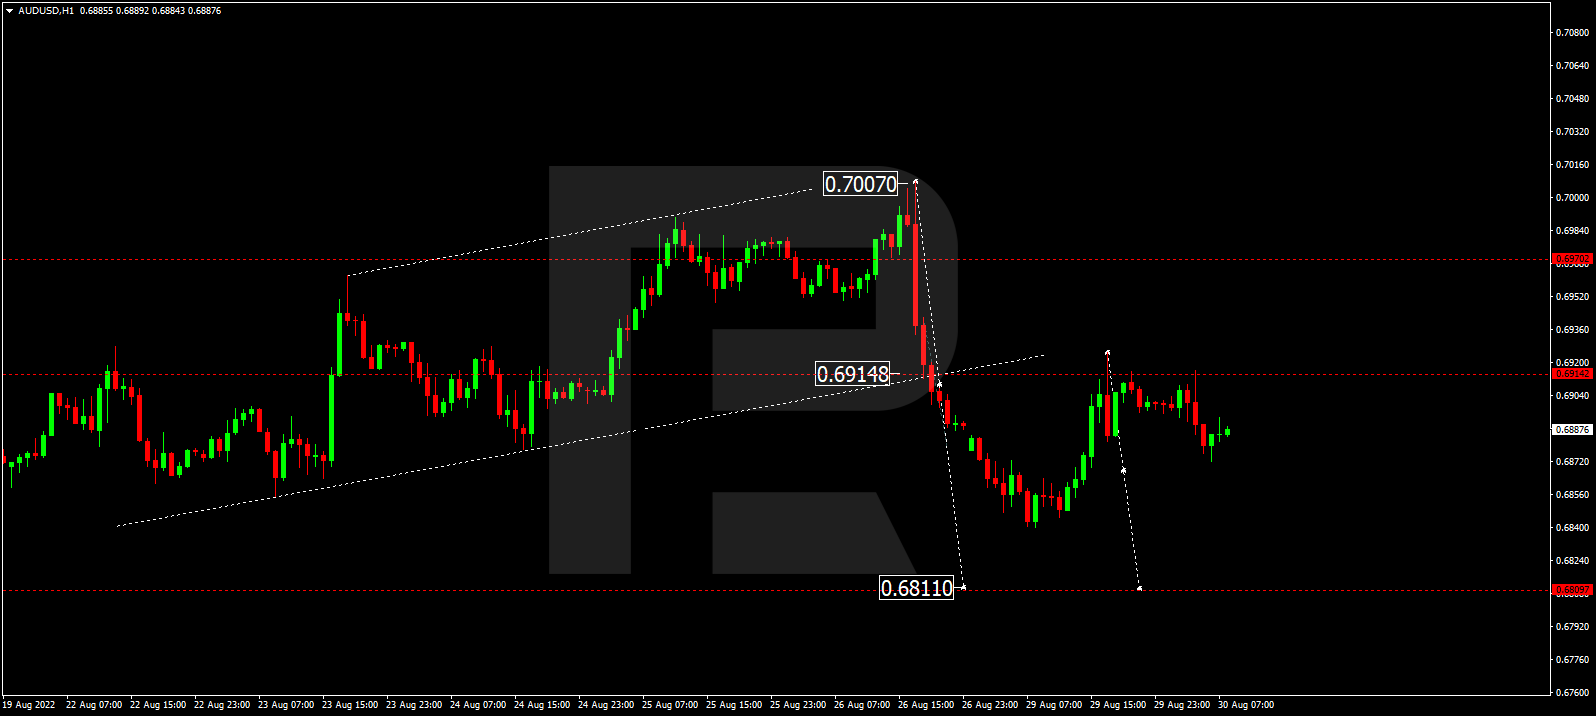
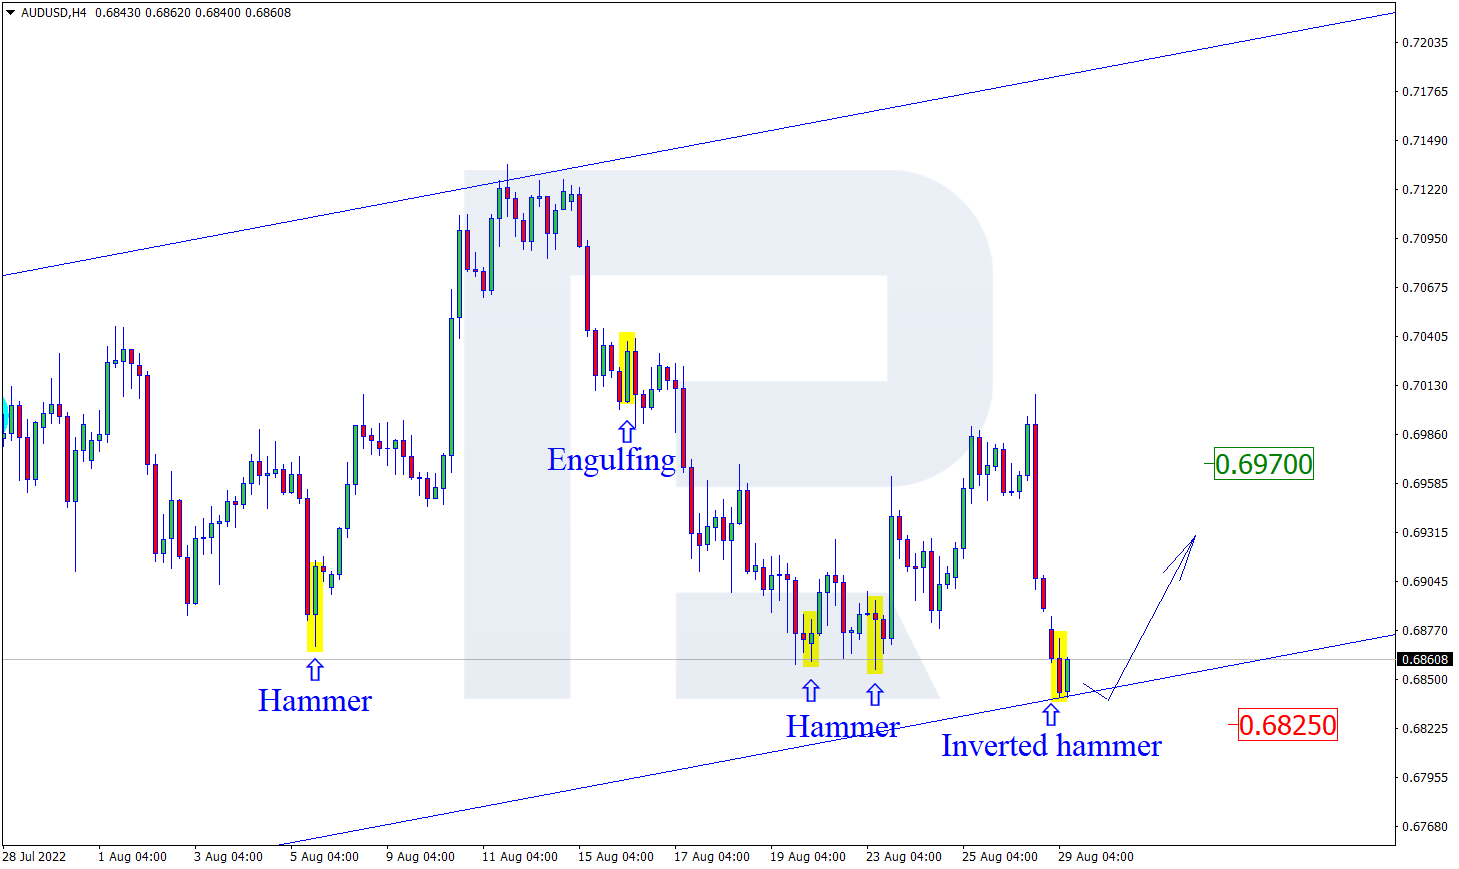
AUDUSD breakdown on the horizon
A solid breakdown below 0.06850 could encourage a selloff towards 0.6700. If prices manage to keep above 0.6850, a rebound towards 0.7000 may be a possibility.

USDJPY ready to breakout?
The USDJPY remains bullish on the daily charts as there have been consistently higher highs and higher lows. Prices are trading above the 50, 100, and 200-day Simple Moving Average while the MACD trades above zero. A strong breakout above 139.380 could inspire an incline towards 140.00. A move back below 135.00 may trigger a selloff towards the 100-day Simple Moving Average and 131.34, respectively.

![]() Article by ForexTime
Article by ForexTime
ForexTime Ltd (FXTM) is an award winning international online forex broker regulated by CySEC 185/12 www.forextime.com