
By RoboForex Analytical Department
The price of gold fell below 3,300 USD per troy ounce on Friday, closing the week with a loss of approximately 1%.
Key drivers behind gold’s movement
Investors remain cautious ahead of today’s US PCE inflation report, which could offer fresh clues on potential Federal Reserve rate adjustments.
On Thursday, gold prices gained nearly 1% after an appeals court temporarily upheld tariffs imposed during Donald Trump’s presidency. This followed a ruling by a US trade court a day earlier, which had blocked the tariffs, deeming their implementation unlawful.
San Francisco Fed President Mary Daly reiterated that the Fed could still deliver two rate cuts this year, as projected in March. However, she emphasised that rates must hold steady for now to achieve the 2% inflation target.
Free Reports:
 Download Our Metatrader 4 Indicators – Put Our Free MetaTrader 4 Custom Indicators on your charts when you join our Weekly Newsletter
 Get our Weekly Commitment of Traders Reports - See where the biggest traders (Hedge Funds and Commercial Hedgers) are positioned in the futures markets on a weekly basis.
Gold faced volatility in May as global risk sentiment improved, reducing demand for safe-haven assets. Hopes of a resolution in US trade disputes spurred investors back into equity markets.
Technical analysis: XAU/USD
H4 Chart:
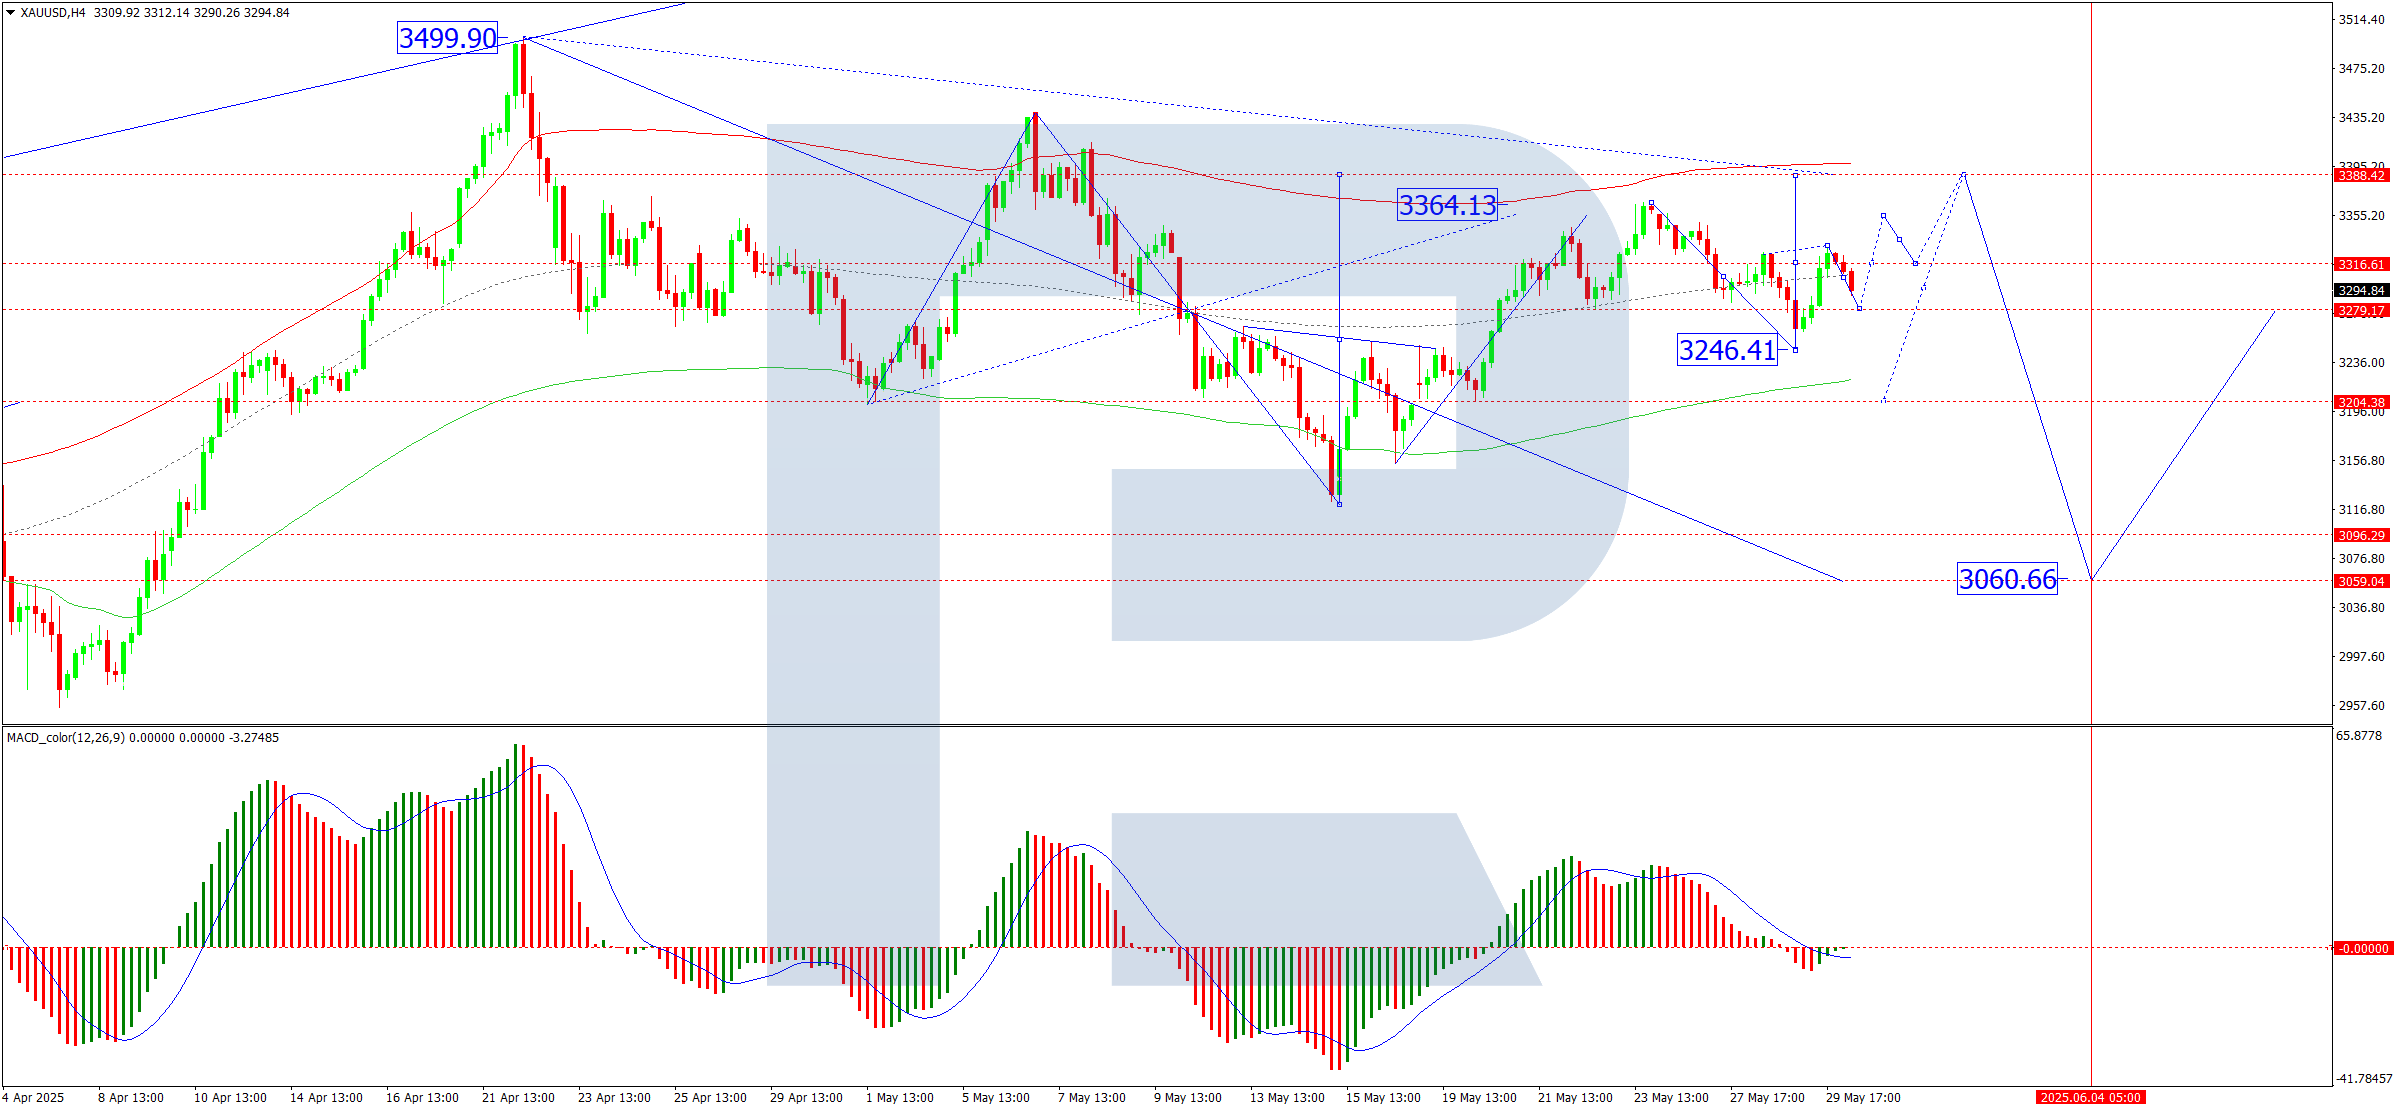
- The market completed a correction wave to 3,246, followed by an upward impulse to 3,331
- Currently, a downward pullback towards 3,280 is forming, with consolidation around 3,320
- A downside breakout could extend losses to 3,200, while an upside breakout may fuel a rally towards 3,388, exhausting the bullish wave
- A subsequent downtrend towards 3,060 is anticipated
- MACD confirmation: The signal line has exited the histogram zone, indicating a firm upward trend
H1 Chart:

- The upward wave to 3,331 has concluded, with a correction to at least 3,255 expected today
- Thereafter, another upswing towards 3,355 (potentially extending to 3,388) may follow, although this is viewed as a corrective pullback within the broader downtrend
- Once complete, a new decline towards 3,222 (possibly 3,060) is likely
- The stochastic indicator supports this view: The signal line is below 20, rising sharply towards 80
Conclusion
Gold’s near-term direction hinges on breakouts from the current range, with technical indicators suggesting further volatility ahead.
Disclaimer
Any forecasts contained herein are based on the author’s particular opinion. This analysis may not be treated as trading advice. RoboForex bears no responsibility for trading results based on trading recommendations and reviews contained herein.

- The US introduces new import tariffs for 60 countries. Brent crude surpasses $100 per barrel Jul 24, 2026
- USD/JPY Breaks Records: Nothing Slows the Yen’s Decline Jul 24, 2026
- Oil prices reached a 6‑week high. The AUD strengthened on the back of a strong labor‑market report Jul 23, 2026
- EUR/USD Recovers as Dollar Weakens Jul 23, 2026
- Bitcoin rose to $66,000. The New Zealand dollar continues to strengthen Jul 22, 2026
- Inflationary pressure is easing in Canada. In New Zealand, on the contrary, inflation is rising Jul 21, 2026
- GBP/USD Falls After Cabinet Changes Jul 21, 2026
- Geopolitical and macroeconomic conditions continue to pressure market sentiment Jul 20, 2026
- USD/JPY Poised to Continue Gains as Expensive Oil and Lack of Support Weigh on Yen Jul 20, 2026
- COT Metals Charts: Weekly Speculator Bets led by Copper & Steel Jul 18, 2026