Source: Ron Struthers (11/4/22)
The Fed’s mandate is 2% inflation and maximum employment. Expert Ron Struthers believes they have lots of room to soften the job market. Struthers also sees promise with three stocks. Gilat Satellite is growing sales, Callon Petroleum is undervalued, and Zonte Metals has a unique situation.
The Fed raised 75 points yesterday, and the markets first rallied, but then Powell blew the ‘pivot’ narrative out of the water, and stock markets tanked and are down further today.
Will Rates Be Higher?
Powell “We may ultimately move to higher levels than we thought at the time of the September meeting. The incoming data since our last meeting suggests the ultimate level of interest rates will be higher than previously expected. The risks are asymmetric. If the Fed does too much, it can cut. If it doesn’t tighten enough, then you’re in real trouble . . . It is very premature to be thinking about pausing . . . We think we have a ways to go.”
The Fed’s goals are inflation of 2% and maximum employment. They have lots of room to soften the job market, so I believe the Fed is actually planning a recession with the hope it will be a mild one.
This chart was in NY Times today.
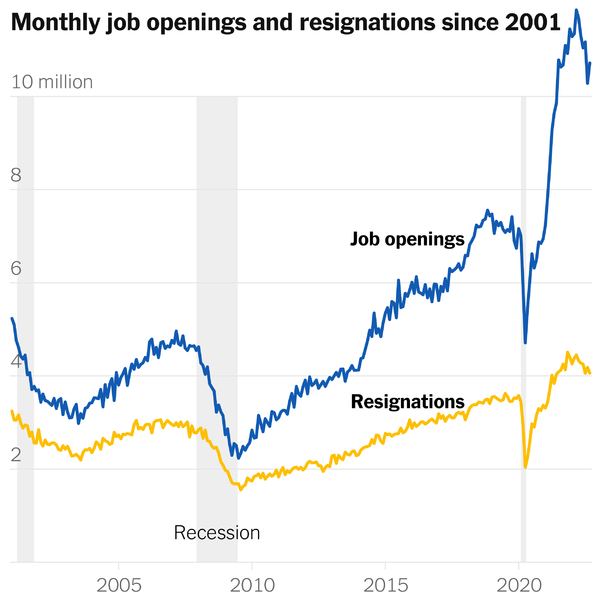
The Job Market
It is very easy to see that the job market is very strong. The most important point the NY Times made is they weren’t quitting to sit on the couch but were taking other, usually better-paying, jobs.
And since people typically don’t jump employers without a bump in pay, job-switching contributes to wage growth. And that, my friends, is inflationary wage growth.
The Fed will remain aggressive in its fight to tame inflation. If job growth stalls and unemployment rises, the Fed could pause sooner to avoid causing a recession. From what Powell said, the Fed will likely go at a slower pace and probably do 50-point increases in the next two or three increases.
BofE predicts the economy will shrink for two years as it raises interest rates by 0.75% to 3% — the biggest increase in three decades — the increase, which followed a similar announcement by the US Fed last night, is the largest daily move since Black Wednesday in 1992 and the largest single increase since 1989.
At this time, The UK and Europe will be hit much harder than the U.S. with their energy crisis on top of it.
Fortunately, Russia changed course and is allowing Ukraine grain shipments again. I think they were making a statement that if you want grain shipments, don’t attack our naval forces in the area that is allowing it.
Canadian Economy
Canada looks to fair somewhere in between Europe and the US. I am most concerned about the Liberal government’s economic statement before year-end. If they say or promise to do the wrong things, the dollar and financial markets could get whacked. If you are planning a winter vacation, you may want to convert your Canadian lonnies now to U.S. dollars.
Prices, on average, have declined 9%, so we are not halfway yet to BOM’s prediction. They note satellite cities to the major cities will see far larger drops.
Today the Bank of Montreal issued an analysis of the five things you need to know about real estate. I was surprised by how sobering it is, as they admit to a ‘Housing Bubble.’
“ A housing bubble occurred in Toronto in 1989. After its peak, house prices decreased by more than 20%. Fast forward to today, and we anticipate a 20% correction nationwide, though this should only take prices back to levels in the spring of 2021. “
Prices, on average, have declined 9%, so we are not halfway yet to BOM’s prediction. They note satellite cities to the major cities will see far larger drops.
How are Canadians coping?
Not very well. Yesterday The Post reported that Equifax Canada’s consumer survey released last Tuesday found that Canadians’ average credit card balance was at a record high of CA$2,121 by the end of September.
Equifax said the average non-mortgage debt was CA$21,188, returning to levels not seen since the first quarter of 2020. Canadians are feeling less secure in their financial outlook than last year, and more than half are worried about paying bills like rent, utilities, or insurance — especially seniors.
More than half of Canadians surveyed said they have a lot of anxiety about their personal debt levels. Equifax’s Julie Kuzmic said the previous average credit card balance high was during the fourth quarter of 2019, at CA$2,118. She said average credit card debt fell during the pandemic, but credit card utilization has now increased for six consecutive quarters.
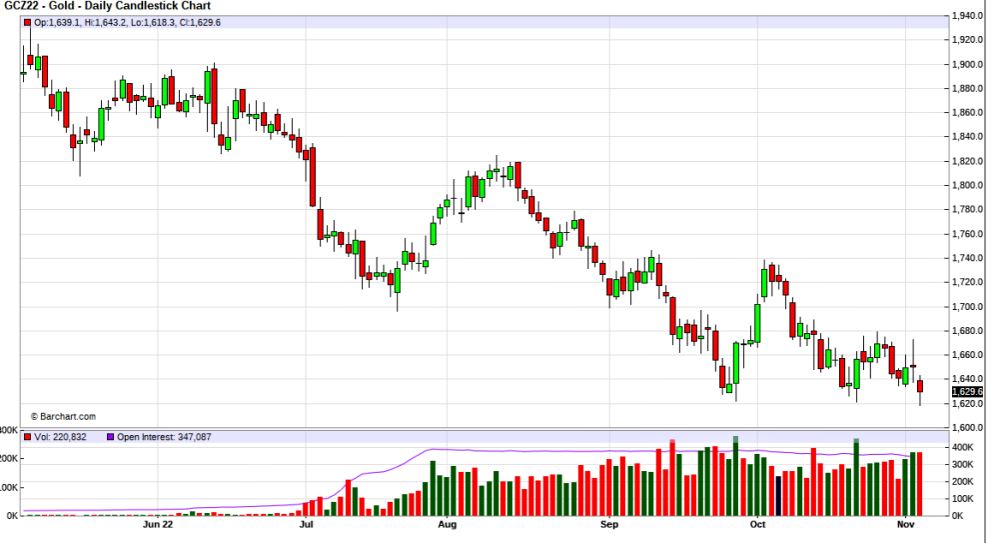
“Credit card usage is reaching historic highs,” said Ms. Kuzmic in a statement. She said that increased credit card usage will be a “slippery slope” for some. Also of importance is that the Comex Gold price bounced off the CA$1620 area for the third time.
Will this level hold? I am afraid not, but we will soon see.
As negative as the sentiment is, it can still get worse. A washout on a huge volume would be a good sign of a bottom or a strong bounce higher off this third test of the CA$1620 area.
Perhaps some consolation is we are able to buy Newmont Corp. (NEM:NYSE) cheaper.
I will use the average of yesterday’s close of $39.53 and the current price of $37.48 to give an entry price of $38.50.
I was skeptical Musk would get Twitter Inc. (TWTR34:BVMF;TWTR:NYSE;TWTR:NASDAQ), but it looks like he has. Still, hold just one minute.
The Biden administration is considering a national security review and could axe the deal. Their so-called concern is the investment backers of Musk, some being in Saudi Arabia.
Musk is not too popular on Twitter, and he will turn the whole thing upside down. Who knows, maybe I will sign up again. Let’s see what happens. In a bid to drive down costs, Elon Musk plans to eliminate 50% of Twitter’s workforce this week, which would result in nearly 3,700 layoffs, according to Bloomberg.
The platform’s work-from-anywhere policy would also be rescinded, with most remaining employees required to report to the office. In one scenario being considered, laid-off workers will be offered 60 days’ worth of severance pay as Musk looks to gut a business for which he says he overpaid (the transaction valued Twitter at $44 billion).
This is going to be a new trend in big tech. Gone are the days they could raise billions and spend it recklessly on expansion. The opposite will soon be the norm. In October, Meta Platforms announced that it was eliminating 15% of its staff, or approximately 12,000 employees, at Facebook.
Gilat Satellite Networks
Today, Antamina, one of the world’s largest copper/zinc mines, announces it selected Gilat Satellite Networks (GILT:NASDAQ) for a multimillion-dollar e-learning project in the Municipality of San Marcos, a rural area near the Antamina mine in Peru.
Gilat will deploy terrestrial and VSAT backhauling for connectivity and provide services to schools in San Marcos. Through the four-year project, thousands of students and teachers will gain access to training and educational resources, as well as laptop computers and other connected devices.
I would look to buy on weakness around $5.30.
“Gilat’s technology and expertise will be used to enable connectivity and e-learning for the benefit of 265 teachers and directors of the 33 primary and secondary educational institutions, as well as more than 3,000 students in the district of San Marcos,” said Manuel Ruiz-Herrera, Senior Health, and Education Supervisor at Antamina Mining Company. “Our goal, through articulated work between Antamina, the District Municipality of San Marcos, and the Huari Local Educational Management Unit, is to transform the educational methodology by contributing to the improvement of digital skills of the next generation.”
On October 24, 2022, they announced $10 million in orders for transceivers to power the IFC applications of a Tier-1 global aerospace system Integrator.
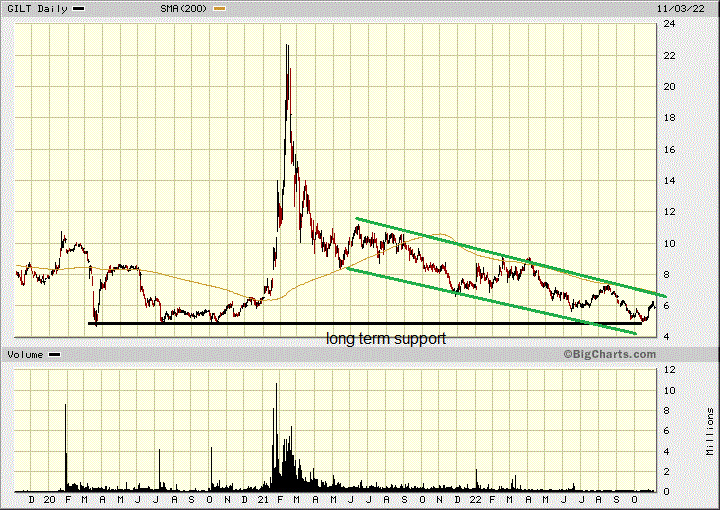
The company is doing well, but the stock has been struggling in a bad market. It just had a decent rally, and that is why I have a buy on weakness. The stock just bounced off long-term support but is still within the downtrend channel.
I would look to buy on weakness around $5.30.
Callon Petroleum
Callon Petroleum (CPE:NYSE) today reported the results of operations for the three and nine months that ended September 30, 2022.4
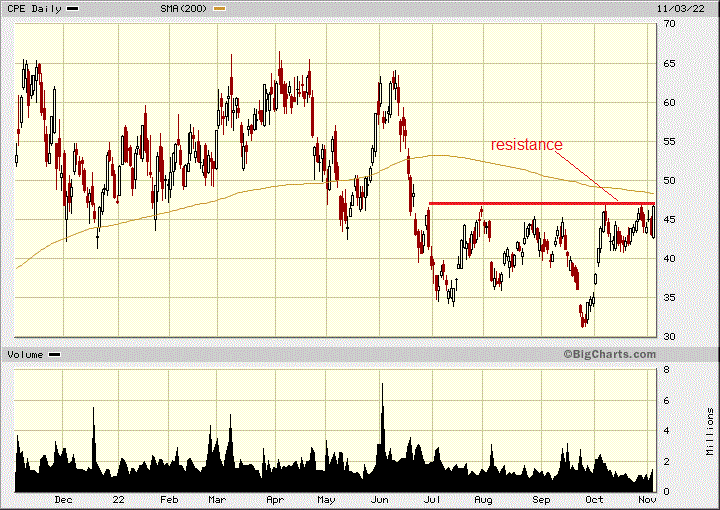
Like many oil and gas companies, Callon’s stock is undervalued and cheap.
Presentation slides accompanying this earnings release are available on the company’s website at www.callon.com, located on the “Presentations” page within the Investors section of the site.
Third Quarter 2022 and Recent Highlights:
- Delivered 8% sequential growth in daily oil production volumes and 7% sequential growth in total daily production volumes (66.4 MBbls/d and 107.3 MBoe/d, respectively).
- Achieved Midland Basin well productivity gains in 2022 of over 25% compared to the 2019 – 2021 average.
- Generated net cash provided by operating activities of $475.3 million and adjusted free cash flow of $148.4 million for the third quarter
- For the first nine months of the year, generated net cash provided by operating activities of $1.1 billion and adjusted free cash flow of $457.3 million.
- For the third quarter, Callon reported a net income of $549.6 million ($8.88 per diluted share), adjusted EBITDA of $458.5 million, and adjusted income of $249.8 million ($4.04 per diluted share).
- For the first nine months of the year, Callon reported a net income of $937.3 million ($15.14 per diluted share), adjusted EBITDA of $1.3 billion, and adjusted income of $690.3 million ($11.15 per diluted share).
- During the quarter, reduced total debt-to-adjusted EBITDA ratio to under 1.5x and total debt by approximately $150 million.
- Extended the maturity of the revolving credit facility to October 2027 with a borrowing base of $2.0 billion and an elected commitment of $1.5 billion.
- Issued the Company’s third annual sustainability report, which provides a comprehensive overview of the continued progress on sustainability initiatives.
Like many oil and gas companies, the stock is undervalued and cheap.
They should hit $1.5 billion in operating cash flow this year, and with a current market cap of $2.66 billion, it is only trading at 1.8 times CFFO.
For the year, they should at least earn $18 per share for a P/E of just 2.6. Marketwatch lists their trailing P/E at 2.34.
The stock is cheap, cheap, cheap, but it just can’t seem to break resistance around $46.75. A close at $48 or higher would be a clear breakout, and the stock would probably run much higher.
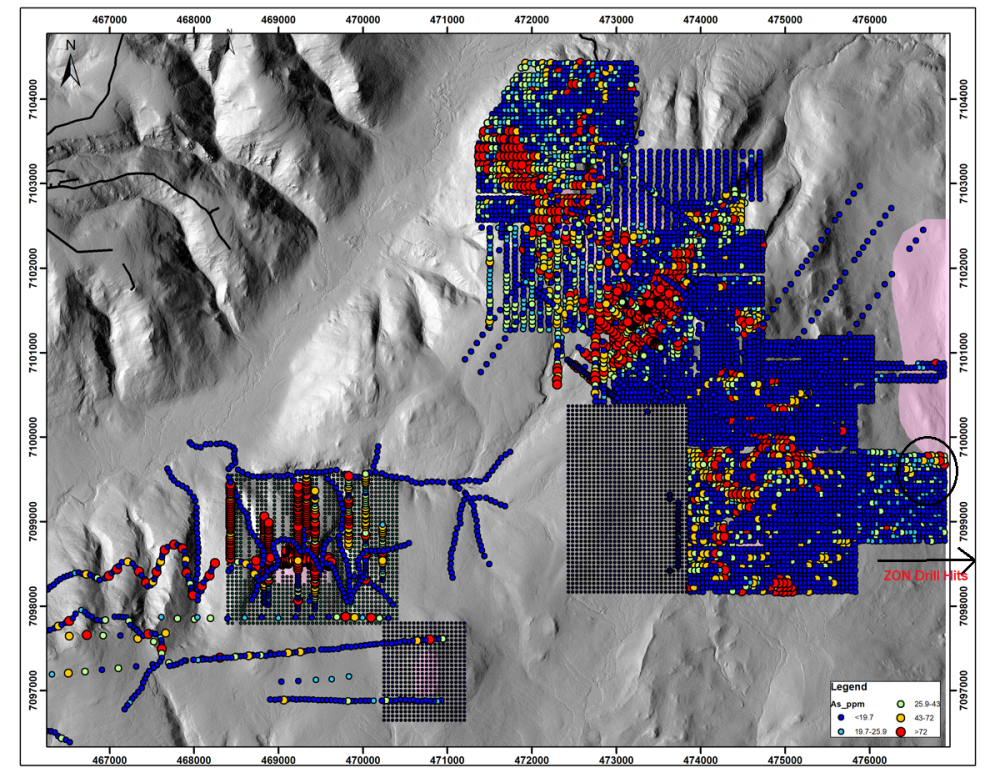
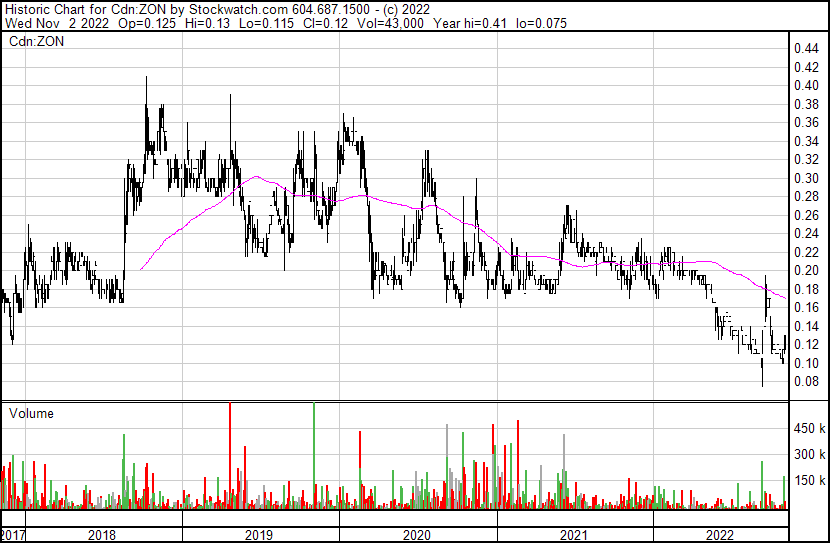
Zonte Metals
I had a number of questions as news broke yesterday that B2Gold will try to sell the Gramalote project. It was deep down in their financial MD&A and was also mentioned in early August financials.
The story broke by an article at mining.com. The article claims Gramalote is a $925 million project, I am not sure they spent that much. I think the key things in the article are:
- “Gramalote was B2Gold’s first project when it was an exploration company starting out. In 2015, it received the first environmental license awarded in Colombia in 35 years.
- The permit gave it three years to work through social aspects related to the open pit project, including relocating artisanal miners and some nearby residents.
- During that time, Gramalote became the center of a mining rights dispute with Canada’s Zonte Metals, which remains active.”
B2Gold tried to work out these social issues over six years with no success. At one point, they allocated $35 million to resolve what they called key properties. Their real issue was they could not resolve Zonte Metals Inc. (ZON:TSX.V) claim dispute despite going to court numerous times and failing.
Finally, the judge said enough was enough, and it is now going to trial. We are awaiting the trial date.
Like most juniors, it is down and out and currently trading at 5-year lows. Investors could make huge gains from these prices with a bit of patience.
Remember that Zonte’s partners on the claims are Colombians, and perhaps a court would be reluctant to rule against them unless it was cut and dry that they have no title. Mining.com reported on this back in 2017, and it was noted that mining claims are processed on a first in first out basis.
Zonte applied for the claims in July 2013, while the AngloGold-B2Gold venture (Gramalote Colombia) submitted it in August 2015. It is also worth noting that Zonte’s legal council is the former Minister of Mines and was instrumental in writing the current mining code.
It really does not matter to Zonte if B2Gold can sell Gramalote, and I highly doubt it in this market, especially with the cloud over it of the claim dispute. Gramalote is significant, with 5.06 million ounces indicated and 1.1 million ounces inferred, according to B2Gold.
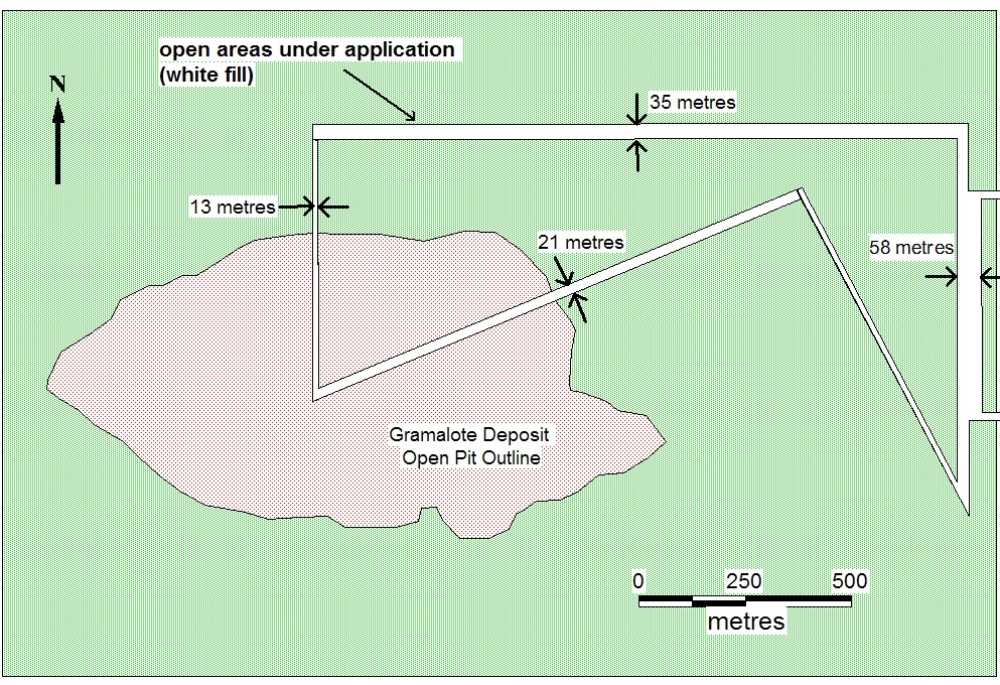
Some of the disputed claims that Zonte is in court about going down the middle of the proposed open pit, so they are valuable, and there cannot be a mine without them.
For a back-of-the-napkin calculation, the disputed claims represent about 6% to 7% of the project (not all shown above), and if Gramalote is worth $925 million, 6% is US$55.5 million.
Zonte’s market cap is just US$5.3 million. It could be quite some time before Zonte could get a cash settlement, assuming the court rules in their favor, never the less the stock would pop on a favorable court ruling, and that date could come anytime.
Perhaps a potential buyer teams up with Zonte?
Near term, there are better prospects the stock could move on, such as positive drill results at their Cross Hills IOCG copper system in NFLD. This could actually be a whole new copper district. Their MJ project next to Victoria Gold in the Yukon has already made a drill discovery, and just lately, it was revealed by Victoria Gold that they are exploring (soil grid and drilling) right up to Zonte’s border, the far right boundary.
Over 90% of junior explorers have done 5, 10, or 20 to-1 share rollbacks in the past 10 years, while Zonte is one of the few that did not. In fact, they did a 2-for-1 forward split and currently have just 60 million shares out.
However, like most juniors, it is down and out and currently trading at 5-year lows. Investors could make huge gains from these prices with a bit of patience.
Struthers Stock Report Disclaimers:
All forecasts and recommendations are based on opinion. Markets change direction with consensus beliefs, which may change at any time and without notice. The author/publisher of this publication has taken every precaution to provide the most accurate information possible. The information & data were obtained from sources believed to be reliable, but because the information & data source are beyond the author’s control, no representation or guarantee is made that it is complete or accurate.
The reader accepts information on the condition that errors or omissions shall not be made the basis for any claim, demand or cause for action. Because of the ever-changing nature of information & statistics the author/publisher strongly encourages the reader to communicate directly with the company and/or with their personal investment adviser to obtain up to date information.
Past results are not necessarily indicative of future results. Any statements non-factual in nature constitute only current opinions, which are subject to change. The author/publisher may or may not have a position in the securities and/or options relating thereto, & may make purchases and/or sales of these securities relating thereto from time to time in the open market or otherwise.
Neither the information, nor opinions expressed, shall be construed as a solicitation to buy or sell any stock, futures or options contract mentioned herein. The author/publisher of this letter is not a qualified financial adviser & is not acting as such in this publication.
Disclosures:
Charts provided by the author.
1) Ron Struthers: I, or members of my immediate household or family, own shares of the following companies mentioned in this article: None. I personally am, or members of my immediate household or family are, paid by the following companies mentioned in this article: None. My company currently has a financial relationship with the following companies mentioned in this article: None. I determined which companies would be included in this article based on my research and understanding of the sector.
2) The following companies mentioned in this article are billboard sponsors of Streetwise Reports: None. Click here for important disclosures about sponsor fees. The information provided above is for informational purposes only and is not a recommendation to buy or sell any security.
3) Statements and opinions expressed are the opinions of the author and not of Streetwise Reports or its officers. The author is wholly responsible for the validity of the statements. The author was not paid by Streetwise Reports for this article. Streetwise Reports was not paid by the author to publish or syndicate this article. Streetwise Reports requires contributing authors to disclose any shareholdings in, or economic relationships with, companies that they write about. Streetwise Reports relies upon the authors to accurately provide this information and Streetwise Reports has no means of verifying its accuracy.
4) This article does not constitute investment advice. Each reader is encouraged to consult with his or her individual financial professional and any action a reader takes as a result of information presented here is his or her own responsibility. By opening this page, each reader accepts and agrees to Streetwise Reports’ terms of use and full legal disclaimer. This article is not a solicitation for investment. Streetwise Reports does not render general or specific investment advice and the information on Streetwise Reports should not be considered a recommendation to buy or sell any security. Streetwise Reports does not endorse or recommend the business, products, services, or securities of any company mentioned on Streetwise Reports.
5) From time to time, Streetwise Reports LLC and its directors, officers, employees, or members of their families, as well as persons interviewed for articles and interviews on the site, may have a long or short position in the securities mentioned. Directors, officers, employees, or members of their immediate families are prohibited from making purchases and/or sales of those securities in the open market or otherwise from the time of the decision to publish an article until three business days after the publication of the article. The foregoing prohibition does not apply to articles that in substance only restate previously published company releases.