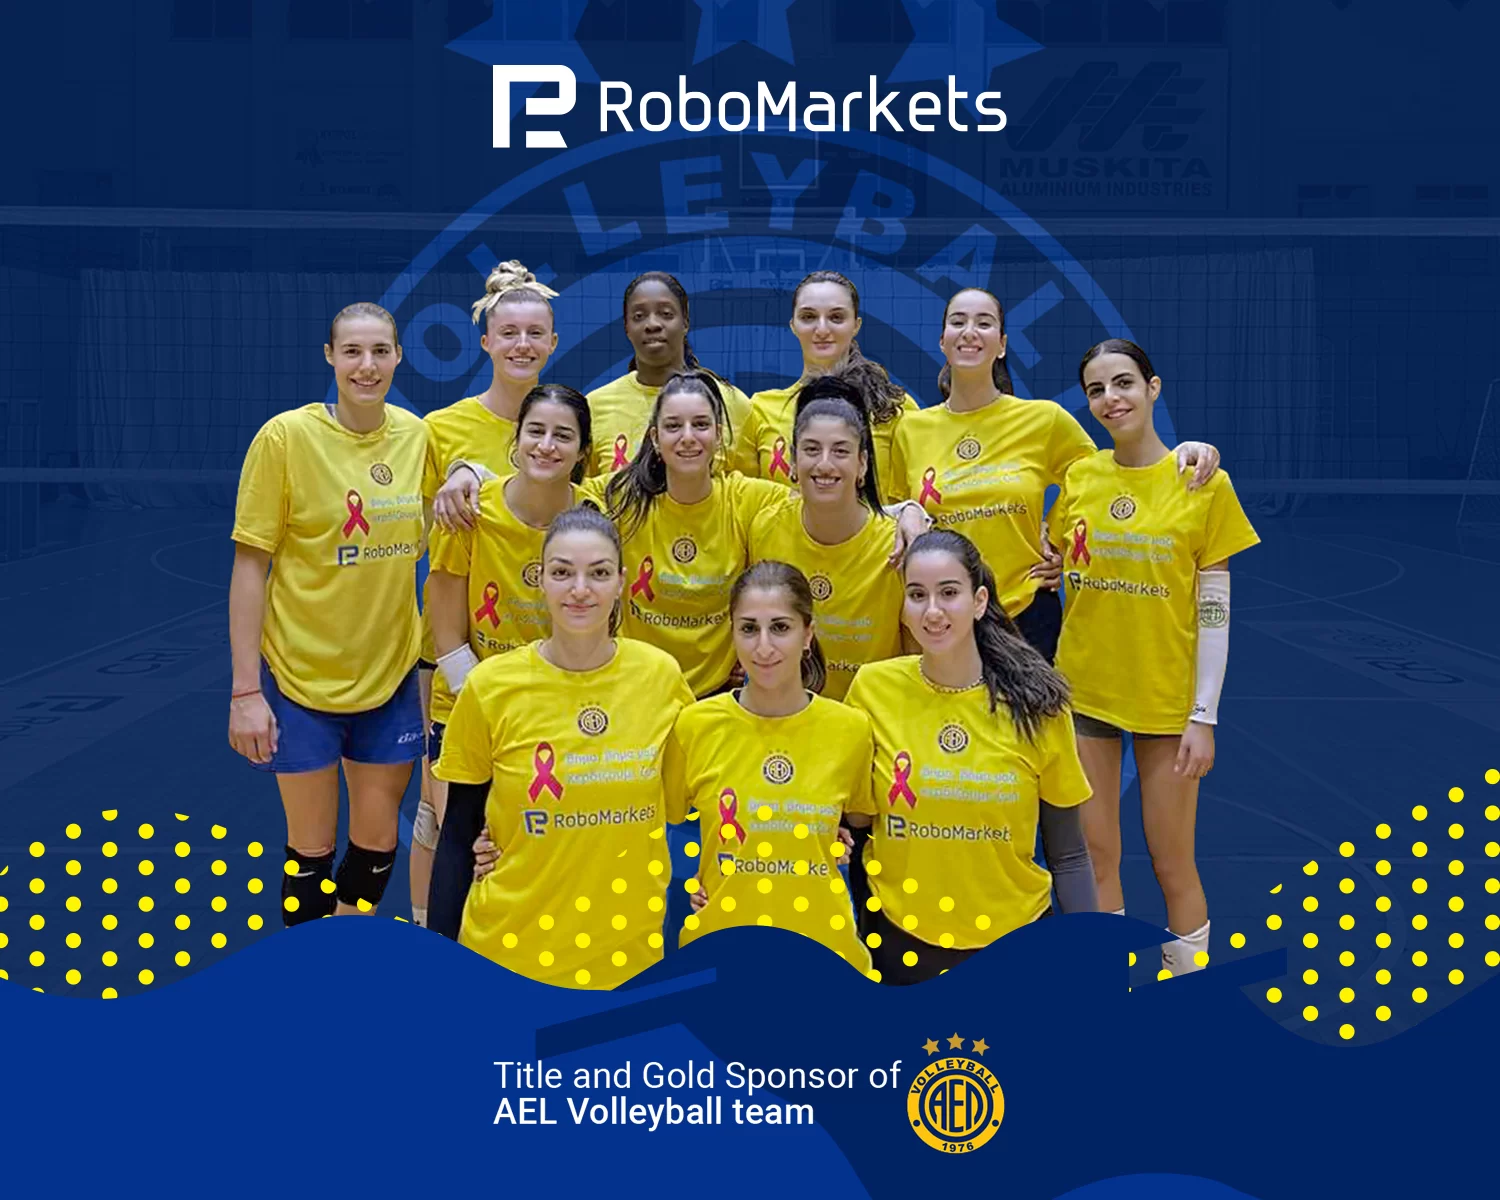
Archive for Financial News – Page 276

Ichimoku Cloud Analysis 14.10.2022 (EURUSD, BRENT, USDJPY)

Article By RoboForex.com

EURUSD, “Euro vs US Dollar”

EURUSD has fixed above the resistance level. The instrument is currently moving inside Ichimoku Cloud, thus indicating a sideways tendency. The markets could indicate that the price may test the cloud’s upside border at 0.9815 and then resume moving downwards to reach 0.9475. Another signal in favour of a further downtrend will be a rebound from the descending channel’s upside border. However, the bearish scenario may no longer be valid if the price breaks the cloud’s upside border and fixes above 0.9885. In this case, the pair may continue growing towards 0.9975.

EURUSD
Risk Warning: the result of previous trading operations do not guarantee the same results in the future

BRENT

Brent is testing Tenkan-Sen and Kijun-Sen. The instrument is currently moving inside Ichimoku Cloud, thus indicating a sideways tendency. The markets could indicate that the price may test the cloud’s downside border at 93.50 and then resume moving upwards to reach 102.95. Another signal in favour of a further uptrend will be a rebound from the rising channel’s downside border. However, the bullish scenario may no longer be valid if the price breaks the cloud’s downside border and fixes below 90.05. In this case, the asset may continue falling towards 87.50.

BRENT
Risk Warning: the result of previous trading operations do not guarantee the same results in the future

USDJPY, “US Dollar vs Japanese Yen”

USDJPY is rising inside the bullish channel. The instrument is currently moving above Ichimoku Cloud, thus indicating an ascending tendency. The markets could indicate that the price may test the cloud’s upside border at 147.05 and then resume moving upwards to reach 148.95. Another signal in favour of a further uptrend will be a rebound from the rising channel’s downside border. However, the bullish scenario may no longer be valid if the price breaks the cloud’s downside border and fixes below 145.65. In this case, the pair may continue falling towards 144.75.

USDJPY

Article By RoboForex.com

Attention!
Forecasts presented in this section only reflect the author’s private opinion and should not be considered as guidance for trading. RoboForex LP bears no responsibility for trading results based on trading recommendations described in these analytical reviews.

The cryptocurrency market digest (BTC). Overview for 14.10.2022

Article By RoboForex.com

The BTC is rising on Friday – the asset is mostly trading at $19,605.

Yesterday, the market was very nervous and is still trying to reach stability. At the same time, the BTC dropped to $18,183 amid exchange sales but managed to recover pretty fast.

As we can see, the support area between $18,000-$19,000 was able to survive another bearish attack.

The negative vibe in the market was caused by the September CPI data from the US, which showed 8.2% y/y after being 8.3% y/y in August. However, on MoM, the indicator increased to 0.4%. No matter what, inflation remains high, and it allows the US FOMC to continue tightening its monetary policy. Capital markets declined and the crypto market followed. And when investors reversed their positions, the local trend in digital assets also reversed.

So far, there is nothing new for the BTC as it continues following the US stock market.

China may develop a single Asian cryptocurrencies

An idea of a single Asian digital token is well falling into the China’s strategy to strengthen its economic impact in the region. In addition, China would be very interested in becoming the global leader in developing digital currencies. A digital token may be pegged to the basket of 13 currencies, including Yuan, Yen, Won, etc.

ENS skyrocketed

ENS leaped up over 16% in the last 24 hours. The coin’s capitalisation is $398.11 million; it’s now ranked 85th in the global cryptocurrency rating.

BlockTower launches a new fund

A crypto company focused on asst management, BlockTower, launches a new $150 million fund along with a venture capital arm. The fund is going to be focused on DeFi and the companies targeted at cryptocurrency infrastructure.

Article By RoboForex.com

Attention!
Forecasts presented in this section only reflect the author’s private opinion and should not be considered as guidance for trading. RoboForex LP bears no responsibility for trading results based on trading recommendations described in these analytical reviews.

Week Ahead: What’s Next For British Pound?

By ForexTime

The past few weeks have been explosively volatile for sterling thanks to the ongoing drama revolving around the government’s mini-budget and Bank of England (BoE).

After plunging to an all-time low back in late September, bulls have fought valiantly – pushing prices back to levels before the chaos unfolded. However, the currency is certainly not out of the woods yet. With uncertainty and confusion mounting over the Bank of England’s next move and talks of more fiscal policy U-turns on the mini-budget, this could translate to fresh pound volatility in the week ahead.

Before we discuss the technical and fundamental forces that may influence sterling, here are the scheduled economic data releases/events in the coming week:

Monday, 17 October

  • NGN: Nigeria Inflation
  • USD: Empire manufacturing
  • EUR: ECB Vice President Luis de Guindos, ECB Chief Economist Philip Lane speech

Tuesday, 18 October

  • CNH: China 3Q GDP, Retail sales, industrial production
  • AUD: Reserve Bank of Australia minutes
  • EUR: Germany ZEW survey expectations
  • USD: Industrial production, NAHB housing market index

Wednesday, 19 October

  • EUR: Euro area inflation
  • GBP: UK inflation
  • USD: Chicago Fed President Charles Evan, Minneapolis Fed President Neel Kashkari, St. Louis Fed President James Bullard speech

Thursday, 20 October

  • CNH: China loan prime rates
  • EUR: Germany PPI
  • GBP: Gfk consumer confidence
  • USD: US existing home sales, initial jobless claims

Friday, 26 August

  • EUR: Euro area consumer confidence
  • GBP: UK retail sales

The BoE and new Conservative government are not seeing eye-to-eye, with less than 24 hours until the central bank ends its emergency bond-buying program. Reports of Chancellor of the Exchequer Kwarteng leaving the IMF meetings prematurely to address the current crisis are likely to leave market players on edge. Given how Liz Truss is speculated to remove further elements of the mini-budget over the weekend, Monday’s market open for sterling could shock investors. Ultimately, the current developments expose the UK economy to downside risks at a time when rising inflation is squeezing UK households.

Speaking of inflation, the UK releases inflation figures for September mid-week. According to Bloomberg, inflation is expected to remain unchanged at 9.9% YoY. A report that meets or exceeds expectations may fuel speculation around the BoE moving ahead with a 100-basis point supersized hike. While such a move could inject the pound with short-term confidence, gains are likely to be capped by recession fears. Alternatively, signs of inflationary pressure cooling could reduce BoE rate hike bets – weakening the pound. Other key economic reports to keep an eye on range from the Gfk consumer confidence to retail sales.

Looking at the technical picture, the GBPUSD could swing both ways in the week ahead. If prices can keep above 1.13 the next key level of interest can be found at 1.15 which is just below the 50-day Simple Moving Average. Beyond this point, prices could venture towards the previous lower high around 1.173. Alternatively, sustained weakness under 1.13 could trigger a selloff towards 1.0925 and lower.

Redirecting our attention away from sterling, it may be worth keeping a close eye on stock markets – especially with earnings in full swing. It’s been a rough year for equity markets with the S&P500 down over 22% year-to-date. Investors are likely to closely scrutinize the upcoming earnings for clues on companies’ growth prospects in high interest and strong dollar environment. On the data front, there will be some key economic reports from major economies like China, the United States, and Europe to name a few.

China’s third quarter GDP report could be a market shaker on Tuesday depending on how investors react to the print. Consensus is predicting 3.5% but Bloomberg Economics is predicting 2.7% year on year. The week will also be jam-packed with numerous speeches from various financial heavyweights. With so much going on, it may be wise to strap up and be prepared for another eventful week ahead for financial markets.


Forex-Time-LogoArticle by ForexTime

ForexTime Ltd (FXTM) is an award winning international online forex broker regulated by CySEC 185/12 www.forextime.com

The Analytical Overview of the Main Currency Pairs on 2022.10.14

By JustForex

The EUR/USD currency pair

Technical indicators of the currency pair:
  • Prev Open: 0.9700
  • Prev Close: 0.9770
  • % chg. over the last day: +0.72 %

The US consumer price Index increased by 0.4% last month, but in annual terms, the index declined from 8.3% to 8.2%. Core inflation, which excludes food and energy prices, rose by 0.6% last month, and the core index increased from 6.3% to 6.6% in annual terms. Thus, overall inflation showed signs of decline, while core inflation showed signs of acceleration. The reaction of the markets has been mixed. The European currency initially fell on the news, but by the end of the trading session, it recovered sharply and closed in positive territory. Analysts connect it with the fact that such an inflation scenario was initially put in the price.

Trading recommendations
  • Support levels: 0.9777, 0.9701
  • Resistance levels: 0.9856, 0.9961, 1.0058, 1.0111, 1.0162, 1.0230

From the technical point of view, the trend on the EUR/USD currency pair on the hourly time frame is bullish. The MACD indicator became positive, and the buyers’ pressure is still there. Yesterday, the price formed a false breakdown zone, which can be used as support. Buy trades should be considered from the support level of 0.9777 or 0.9701, but with an additional confirmation in the form of reverse initiative. Sell deals can be considered from the resistance level of 0.9856, but only with confirmation.

Alternative scenario: if the price breaks down through the support level of 0.9666 and fixes below it, the downtrend will likely resume.

EUR/USD
News feed for 2022.10.14:
  • – US Retail Sales (m/m) at 15:30 (GMT+3);
  • – US Michigan Consumer Sentiment (m/m) at 17:00 (GMT+3).

The GBP/USD currency pair

Technical indicators of the currency pair:
  • Prev Open: 1.1094
  • Prev Close: 1.1316
  • % chg. over the last day: +2.00 %

The pound rose against the dollar yesterday as investors are betting on an aggressive interest rate hike from the Bank of England, which will be higher than the US Fed’s rate step. According to analysts, the worst of the inflationary shocks for the US economy has already passed, so the difference between the interest rates of the Bank of England and the US Federal Reserve will now decrease, as UK inflation is not yet at its peak.

Trading recommendations
  • Support levels: 1.1229, 1.1093, 1.0915, 1.0817
  • Resistance levels: 1.1478, 1.1693, 1.1816, 1.1901

From the technical point of view, the trend on the GBP/USD currency pair on the hourly time frame is bullish. The MACD indicator is in the positive zone, and buyers’ pressure remains high. Under such market conditions, buy deals can be considered from the support level of 1.1229, but better after confirmation. Sell trades are best to look for on intraday timeframes, and the nearest resistance level is 1.1478.

Alternative scenario: if the price breaks down of the 1.0915 support level and fixes below it, the downtrend will likely resume.

GBP/USD
There is no news feed for today.

The USD/JPY currency pair

Technical indicators of the currency pair:
  • Prev Open: 146.90
  • Prev Close: 147.22
  • % chg. over the last day: +0.22 %

The yen has renewed its price low again. There are two key reasons for the rapid weakening of the Japanese currency. First is the growing divergence in monetary policy between the US and Japan. The Bank of Japan continues to keep monetary policy soft as inflation and wages remain relatively low in the country. Second, the yen has also been hit hard by Japan’s collapsing current account balance after oil prices rose sharply following Russia’s invasion of Ukraine. And the situation will not change in the coming weeks.

Trading recommendations
  • Support levels: 146.21, 145.93, 144.91, 144.16, 143.00, 140.60, 139.61
  • Resistance levels: 147.67, 148.00

From the technical point of view, the medium-term trend on the currency pair USD/JPY is bullish. The price is trading above the moving levels. The price is trading above the moving average levels. The MACD indicator is in the positive zone, and the pressure on buyers remains. Under such market conditions, buy trades can be searched for on intraday time frames from the support level of 146.21, but with confirmation. Sell deals can be searched from the 147.67 or 148.00 resistance level, but only with additional confirmation in the form of a reverse initiative.

Alternative scenario: If the price fixes below 144.91, the downtrend will likely resume.

USD/JPY
There is no news feed for today.

The USD/CAD currency pair

Technical indicators of the currency pair:
  • Prev Open: 1.3808
  • Prev Close: 1.3753
  • % chg. over the last day: -0.40 %

The Canadian dollar is a commodity currency and depends not only on the monetary policy of the Bank of Canada but also on the dollar Index and oil prices. Oil prices rose sharply after the inflation report, which allowed the Canadian currency to strengthen. The Bank of Canada is pretty much keeping up with the US Federal Reserve in terms of the speed of interest rate hikes, with Canada showing signs of slowing inflation. Therefore, with oil prices trending higher due to OPEC+ production cuts, the Canadian dollar could increase sharply against the dollar in the coming weeks.

Trading recommendations
  • Support levels: 1.3706, 1.3619, 1.3583, 1.3535, 1.3454
  • Resistance levels: 1.3818, 1.3858, 1.3968

From the point of view of technical analysis, the trend on the USD/CAD currency pair is bullish. The price is trading below the moving average lines. The MACD indicator is negative, and the sellers’ pressure is still present. Under such market conditions, buy trades should be considered on the lower time frames from the support level of 1.3706, but after a false breakdown. For selling, it is best to consider the resistance level of 1.3818 or 1.3858, but only after additional confirmation in the form of a reverse initiative.

Alternative scenario: if the price breaks down and consolidates below the support level of 1.3706, the downtrend will likely resume.

USD/CAD
News feed for 2022.10.14:
  • – Canada Wholesale Sales (m/m) at 15:30 (GMT+3).

By JustForex


This article reflects a personal opinion and should not be interpreted as an investment advice, and/or offer, and/or a persistent request for carrying out financial transactions, and/or a guarantee, and/or a forecast of future events.

Core inflation in the US rose to a 40-year-high. PACE recognized the Russian regime as a terrorist

By JustForex

The US consumer price Index rose by 0.4% last month, but in annual terms, the Index declined from 8.3% to 8.2%. Core inflation, which excludes food and energy prices, rose by 0.6% last month, and in annual terms, the core Index increased from 6.3% to 6.6%, the highest level since 1982. So overall inflation has shown signs of declining, while core inflation has shown signs of accelerating. The inflation data would likely perpetuate an additional 75 basis point interest rate hike at the November FOMC meeting and spurred speculation of a fifth consecutive increase of the same size in December. On the other hand, this scenario was initially planned by the experts, which is why the stock market reacted positively to this news. However, it should be noted that when the news was published, the indices fell sharply, but by the end of the trading session they recovered. At the close of the stock market yesterday, the Dow Jones Index (US30) gained 2.83%, and the S&P500 Index (US500) added 2.83%. The NASDAQ Technology Index (US100) jumped by 2.23% yesterday.

Leading economist David Rosenberg predicts that US inflation will fall below 3% next year and warns that a Fed rate hike is fraught with disaster. According to Rosenberg, the Fed is fighting inflation too hard as price pressures wane. The Rosenberg Research founder noted that the Fed is rapidly raising interest rates and cutting its balance sheet even though stocks are in a bear market and the macroeconomic outlook is extremely unclear. Meanwhile, the yield curve is inverted, a sure sign of an approaching recession. Rosenberg warned that if the Fed continues to tighten its monetary policy, it could lead to lower home prices and cause a credit crunch in the banking sector. It could also weaken consumer confidence and spending and prolong the economic downturn.

European stocks closed yesterday in positive territory. Germany’s DAX (DE30) gained 1.51%, France’s CAC 40 (FR40) increased by 1.04%, Spain’s IBEX 35 (ES35) jumped by 1.21%, Britain’s FTSE 100 (UK100) closed at 0.35% yesterday.

Germany’s consumer price Index rose from 7.9% to a record 10% on an annual basis. Huge increases in energy prices are still the main reason for high inflation. In addition to increases in all energy prices due to the war and crisis, the inflation rate was affected by supply disruptions and significant price increases in the preceding stages of the economic process. As a consequence, the prices of other goods and services, including many food products, also rose. Analysts predict that Germany will slide into recession in 2023. “We are currently experiencing a serious energy crisis that threatens to turn into an economic and social crisis,” German Economy Minister Robert Habeck warned in presenting the official fall economic forecasts. France and Spain will release inflation data today.

The Parliamentary Assembly of the Council of Europe (PACE) recognized the Russian regime as a terrorist. 99 out of 100 delegates voted in favor. The Council of Europe resolution also said that an international tribunal should be created as soon as possible, Russia’s tenure in the UN Security Council is illegitimate, and Ukraine should be given modern air defense systems to protect civilians. International norms now define Putin’s regime as a terrorist, i.e. criminal.

Asian markets mostly traded lower yesterday. Japan’s Nikkei 225 (JP225) lost 0.60% over the day, Hong Kong’s Hang Seng (HK50) ended yesterday down 1.87%, and Australia’s S&P/ASX 200 (AU200) closed yesterday down 0.07%.

Inflation in China rose to its highest level since April 2020 as stimulus measures and holiday spending drove prices higher. The consumer price index rose from 2.5 to 2.8% year-over-year in September. But PPI inflation, which measures inflation among businesses, declined in September, reflecting the continued weakness of China’s manufacturing sector, hit by COVID, this year. This Sunday will be the 20th Congress of the Chinese Communist Party, which is expected to provide insight into China’s economic policy over the next five years. Beijing has pledged to increase stimulus measures to support the economic slowdown. But the country also has to balance adopting supportive measures without harming the yuan.

S&P 500 (F) (US500) 3,669.91 +92.88 (+2.60%)

Dow Jones (US30) 30,038.72 +827.87 (+2.83%)

DAX (DE40) 12,355.58 +183.32 (+1.51%)

FTSE 100 (UK100) 6,850.27 +24.12 (+0.35%)

USD Index 112.47 -0.85 (-0.75%)

Important events for today:
  • – China Consumer Price Index (m/m) at 04:30 (GMT+3);
  • – China Producer Price Index (m/m) at 04:30 (GMT+3);
  • – Canada Wholesale Sales (m/m) at 15:30 (GMT+3);
  • – US Retail Sales (m/m) at 15:30 (GMT+3);
  • – US Michigan Consumer Sentiment (m/m) at 17:00 (GMT+3).

By JustForex


This article reflects a personal opinion and should not be interpreted as an investment advice, and/or offer, and/or a persistent request for carrying out financial transactions, and/or a guarantee, and/or a forecast of future events.

Netflix (NFLX) Stock rose sharply today, Trend remains lower but flattening

By InvestMacro.com | #stocks #NFLX #Netflix

Netflix, Inc. End of Day Update: October 13 2022

The Netflix, Inc. (NFLX) stock jumped today with a strong increase of 9.32 percent and closed the day around the 232.51 price level, according to unofficial data at the New York close.

Netflix, a leading technology streaming company, opened the trading day at 212.69 price level with the high of the day at 234.47 and the low of the day at 211.73.

There was news out today for Netflix as the company announced a new ad-supported membership plan that will cost $6.99 in the US and international markets.

The NFLX Trend is Down, RSI level is Bullish

The stock is currently trending lower over the past 200 trading days, according to the linear regression line (red) seen on the chart below. Despite the downtrend this year, the Netflix stock has started to see a moderate uptick from its lows of earlier in the year and the 20-day moving average has been flat in the past few months.

The Relative Strength Index, an indicator that can identify overbought (above 70) and oversold levels (below 30), shows that the current RSI is at a 50.7 score. This is a Bullish reading on the daily time-frame of the standard RSI Indicator. The chart below uses a smoothed (moving average of levels) version of the RSI that will lag slightly but be more consistent.

Netflix (NFLX) Stock rose sharply today, Trend remains lower but flattening

NFLX Price Returns (Closing Price Changes)

The NFLX has declined by -3.00 percent over the past 10 days while seeing a move higher by 4.00 over the past 30 days. The 90-day change is 17.94 while the 180-day return and the 365-day return are -35.36 and -53.79, respectively.

By InvestMacro.com – – Get our stock market newsletter for stock rankings, charts & updates

Apple (AAPL) Stock today rose higher after 3-month low, Trend remains down

By InvestMacro.com | #stocks #AAPL #Apple

Apple Inc. End of Day Update: October 13 2022

The Apple Inc. (AAPL) stock finished the day with a rise of 2.77 percent and closed the day at the 142.99 price level, according to unofficial data at the New York close.

Apple, an American technology company famous for its devices, opened the trading day at 139.13 price level with the high of the day at 143.59 and the low of the day dropping to 134.37.

The Apple stock had been dropping the majority of days over the past week and today fell to its lowest level in over three months below the $135 threshold. Apple found support at the major levels of $135 and $140 today to help boost the stock higher.

The AAPL Trend is Lower, RSI level is Bearish

The stock is currently trending down over the past 200 trading days, according to the linear regression line (red) seen on the chart below. AAPL trades under its 20-day moving average as well with the linear regression line and 20-day moving average line now converging near the $146 price area.

The Relative Strength Index, an indicator that can identify overbought (above 70) and oversold levels (below 30), shows that the current RSI is at a 42.4 score. This is a Bearish reading on the daily time-frame.

Apple (AAPL) Stock today rose higher after 3-month low, Trend remains down

AAPL Price Returns (Closing Price Changes)

The AAPL has seen an increase by 0.36 percent over the past 10 days while seeing a decline of -9.05 over the past 30 days. The 90-day change is -2.02 while the 180-day return and the 365-day return are -10.09 and 12.84, respectively.

By InvestMacro.com – – Get our stock market newsletter for stock rankings, charts & updates

NVIDIA (NVDA) Stock gains by 9%. Trend is Down, RSI Bearish

By InvestMacro.com | #stocks #NVDA #NVIDIA

NVIDIA Corporation End of Day Update: October 13 2022

The NVIDIA Corporation (NVDA) stock finished the day with an advance of 9.01 percent and closed the day around the 119.60 price level, according to unofficial data at the New York close.

NVIDIA, a technology company that is recognized as a leader in GPU units for computers, opened the trading day at 109.71 price level with the high of the day at 120.78 and the low of the day falling to 108.13.

NVIDIA’s stock had fallen in four out of the previous five days and has dipped to trading at its lowest levels in two years, dating back to August 2020.

The NVDA Trend is Lower, RSI level is Bearish

The stock is currently trending sharply lower over the past 200 trading days, according to the linear regression line (red) seen on the chart below. NVDA has lost approximately over half of its share price value since December 2021.

The Relative Strength Index, an indicator that can identify overbought (above 70) and oversold levels (below 30), shows that the current RSI is at a 38.5 score. This is a Bearish reading on the daily time-frame.

NVIDIA (NVDA) Stock gains by 9%. Trend is Down, RSI Bearish

NVDA Price Returns (Closing Price Changes)

The NVDA is lower by -2.13 percent over the past 10 days while seeing a step lower by -20.76 over the past 30 days. The 90-day change is -36.32 while the 180-day return and the 365-day return are -47.46 and -16.59, respectively.

By InvestMacro.com – – Get our stock market newsletter for stock rankings, charts & updates

Intel (INTC) Stock jumped today, Trend remains down

By InvestMacro.com | #stocks #INTC #RSIDivergence

Intel Corporation End of Day Update: October 13 2022

The Intel Corporation (INTC) stock finished the day with an advance of 6.86 percent and closed the day around the 26.42 price level, according to unofficial data at the New York close.

Intel, an American technology and chip company, opened the trading day at 24.725 price level with the high of the day being 26.84 and the low of the day bottoming at 24.59.

The stock today hit its lowest level for share prices since August of 2015 before turning around and surging higher to close out the day ahead.

The INTC Trend is Down, RSI level is Bearish

The stock is currently trending sharply lower over the past 200 trading days, according to the linear regression line (red) seen on the chart below. Intel has lost approximately half of its share price value from December 2021 when it was trading in the $50s compared to the current state of the price.

The Relative Strength Index, an indicator that can identify overbought (above 70) and oversold levels (below 30), shows that the current RSI is at a 39.4 score. This is a Bearish reading on the daily time-frame currently. The RSI had recently been in oversold territory and has emerged with an RSI divergence at the current moment (price lower while RSI score higher).

Intel (INTC) Stock jumped today, Trend remains down

INTC Price Returns (Closing Price Changes)

INTC has seen an increase by 0.15 percent over the past 10 days while seeing a decline by -17.23 over the past 30 days. The 90-day change is -38.42 while the 180-day return and the 365-day return are -47.57 and -51.43, respectively.

By InvestMacro.com – – Get our stock market newsletter for stock rankings, charts & updates

NIO Stock up by over 3%, breaks 6-day losing streak. RSI is Oversold

By InvestMacro.com | #stocks #NIO #RSI-Oversold

NIO Inc. End of Day Update: October 13 2022

The NIO Inc. (NIO) stock finished the day with a gain of 3.48 percent and closed the day around the 12.78 price level, according to unofficial data at the New York close.

NIO opened the trading day at the 12.35 price level with the high of the day being 12.85 and the low of the day at 11.95.

The stock bounced off of the $12.00 support level today after touching the lowest trading level since May. NIO had dropped for six straight days and for fourteen out of the previous eighteen days before today’s rebound.

The NIO Trend is Lower, RSI level is Bearish-Oversold

The stock is currently trending lower over the past 200 trading days, according to the linear regression best-fit line (red) seen on the chart below. NIO shares had been trading as high as $40 dollars in December of 2021 before trending lower over the course of this year.

The Relative Strength Index, an indicator that can identify overbought (above 70) and oversold levels (below 30), shows that the current RSI is at a 27.2 score. This is a Bearish-Oversold reading on the daily time-frame.

NIO Stock up by over 3%, breaks 6-day losing streak. RSI is Oversold

NIO Price Returns (Closing Price Changes)

The NIO has slid by -17.97 percent over the past 10 days while seeing a decline of -35.81 over the past 30 days. The 90-day change is -33.37 while the 180-day return and the 365-day return are -43.60 and -66.31, respectively.

By InvestMacro.com – – Get our stock market newsletter for stock rankings, charts & updates