On Thursday, the US stock market maintained positive dynamics. By the end of the day, the Dow Jones Index (US30) rose by 0.24%. The S&P 500 Index (US500) increased by 0.26%. The Tech Index NASDAQ (US100) closed higher by 0.36%. The leading positions were held by the energy, commodities, and real estate sectors. In the corporate sector, attention was focused on the start of earnings season. Shares of Bank of New York Mellon rose by 1.3% thanks to strong financial results, while PepsiCo shares added a modest 0.3% after publishing a report that exceeded analysts’ expectations for profit and revenue.
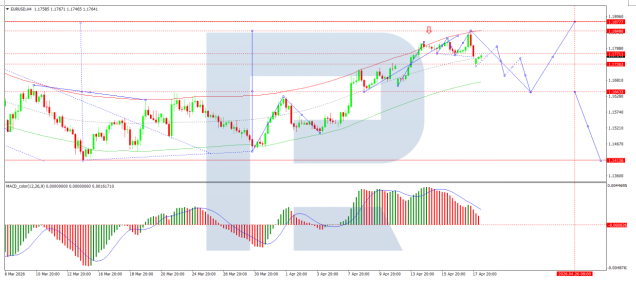
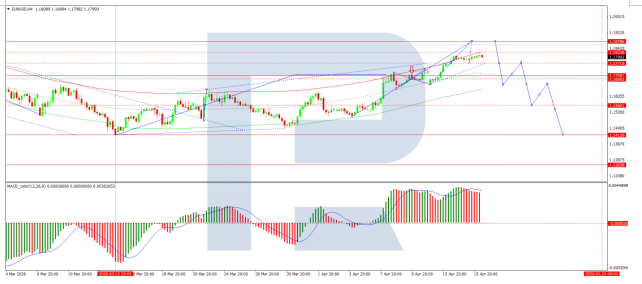
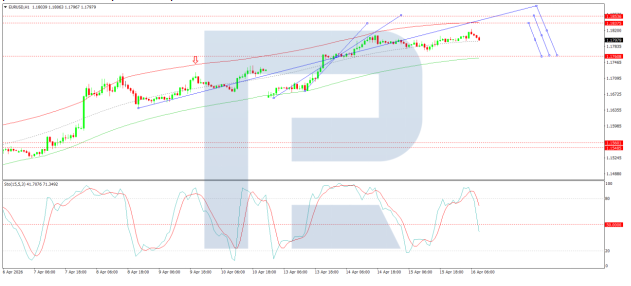
On Thursday, European stocks traded without a unified trend. By the end of the day, Germany’s DAX (DE40) rose by 0.36%, France’s CAC 40 (FR40) closed down by 0.14%, Spain’s IBEX 35 (ES35) fell by 0.53%, and the UK’s FTSE 100 (UK100) closed the session up by 0.29%. According to the minutes of the March meeting, the ECB leadership noted that the Middle East conflict has become a key source of uncertainty, creating a classic monetary‑policy trap: simultaneous risks of accelerating inflation and economic stagnation. Despite this, the regulator remains confident in its ability to manage volatility, noting that the current situation may either drag on or find an unexpected diplomatic solution in the coming months. Although short‑term inflation expectations were significantly revised upward, the ECB’s strategic goal remains unchanged – stabilizing prices at 2% in the medium term. Board members agreed that in such high geopolitical turbulence, the most reasonable tactic is to avoid long‑term commitments.
The Swiss franc (CHF) strengthened to 0.78 per US dollar, reaching its highest level in nearly 15 years. The internal agenda of the SNB remains cautious. The published minutes of the March meeting emphasize that the regulator sees the Middle East conflict as a serious threat to price stability. The main risk for the SNB is excessive strengthening of the national currency caused by capital inflows into “safe havens.” An overly strong franc may trigger deflationary pressure and harm Swiss exporters. In this regard, the SNB leadership confirmed its readiness for active currency interventions. The regulator intends to closely monitor market dynamics and, if necessary, intervene by selling francs to prevent its sharp and excessive appreciation.
WTI oil prices rose by 4%, surpassing 95 dollars per barrel. The sharp rise in prices was triggered by a wave of skepticism regarding the success of the diplomatic process between the US and Iran. While earlier the market hoped for a comprehensive agreement and a quick reopening of the Strait of Hormuz, the focus has now shifted to a less ambitious scenario – the signing of a temporary memorandum aimed only at preventing a new escalation of hostilities. Against the backdrop of geopolitical uncertainty, the market largely ignored news of a ten‑day ceasefire between Israel and Lebanon.
An additional bullish factor came from fresh data from the US Energy Information Administration. After a long period of accumulation, US crude‑oil inventories unexpectedly fell by 9.13 million barrels. This figure shocked analysts, who had expected a symbolic increase of 154 thousand barrels. Such a significant drop in inventories, combined with reduced imports and strong gasoline demand, confirms tightening supply in the physical market.
The US natural‑gas prices (XNG) rose to 2.657 dollars per MMBtu, although quotes still remain near the lows of autumn 2024. The main driver of the local rise was a sharp decline in average daily production, which in recent days fell to a ten‑week low of 108 billion cubic feet. Alongside falling production, high activity is observed in the export sector. Gas flows to US LNG terminals in April increased to 18.9 billion cubic feet per day, approaching historical records. This factor, along with expectations of moderate demand growth in the next two weeks, is preventing prices from falling.
In Asia, Japan’s Nikkei 225 (JP225) rose sharply by 2.38% during the session, China’s FTSE China A50 (CHA50) increased by 1.19%, Hong Kong’s Hang Seng (HK50) closed up by 1.72%, and Australia’s ASX 200 (AU200) fell by 0.26%.
The New Zealand dollar (NZD) fell to 0.588 US dollars, reacting to domestic economic data that softened expectations of an immediate interest‑rate hike. The main pressure factor was slowing food inflation: in March, food prices (which account for nearly one‑fifth of the consumer basket) rose by 3.4% year‑on‑year compared to 4.5% in February. This is the lowest reading in the past year, indicating a gradual cooling of price pressure. Alongside slowing inflation, a decline in consumer activity was recorded. Monthly growth in core electronic‑card spending slowed by half, from 1.4% to 0.7%. The combination of these factors gives the RBNZ temporary breathing room, reducing the need for emergency monetary tightening in the near term.
According to preliminary data, in the first quarter of 2026, Malaysia’s economy grew by 5.3% year‑on‑year. Although the figure remains relatively high, it indicates a noticeable cooling of economic activity compared to the strong 6.3% growth recorded in the fourth quarter of 2025. The slowdown affected most key sectors. This was especially evident in services, the most important sector of the economy, where growth fell from 6.3% to 5.4%. Alongside slowing growth, inflationary pressure is increasing. The annual inflation rate in March 2026 accelerated to 1.7% compared to 1.4% in February. This figure matched market expectations and became the highest in more than a year (since January 2025).