By InvestMacro
Here are the latest charts and statistics for the Commitment of Traders (COT) reports data published by the Commodities Futures Trading Commission (CFTC).
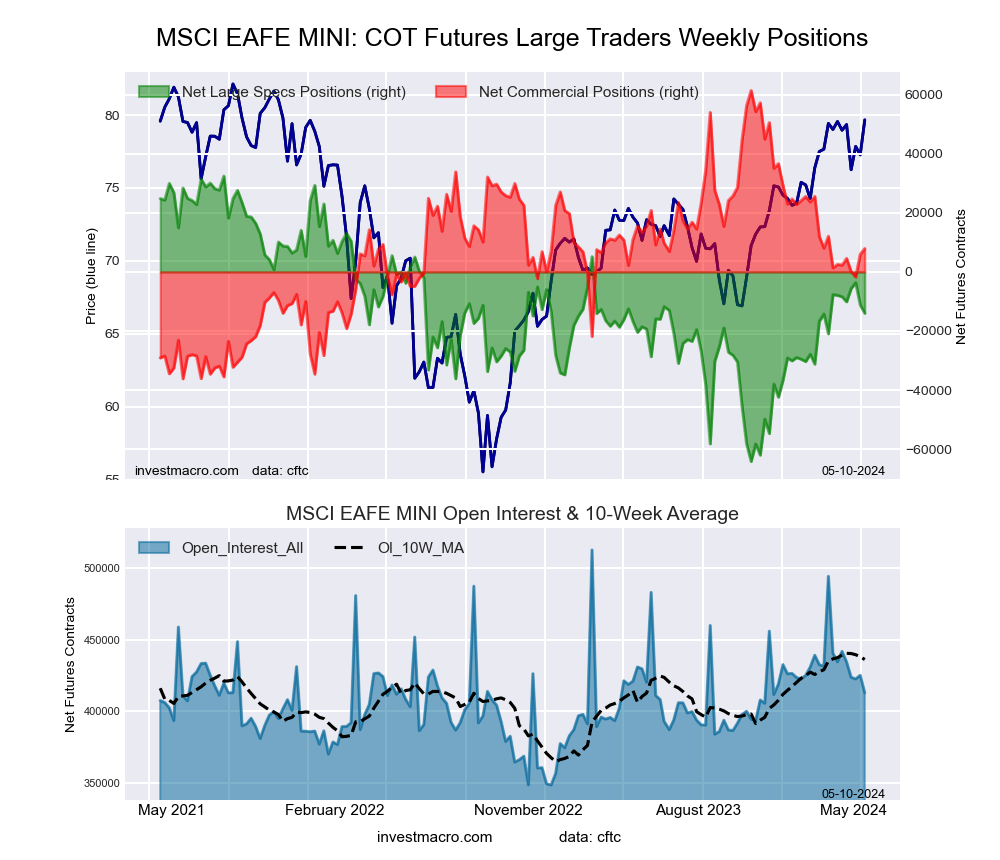
The latest COT data is updated through Tuesday May 7th and shows a quick view of how large traders (for-profit speculators and commercial entities) were positioned in the futures markets.
Weekly Speculator Changes led by Corn & Soybeans
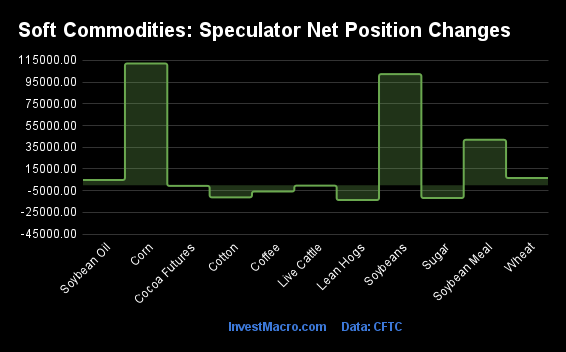
The COT soft commodities markets speculator bets were slightly lower this week as five out of the eleven softs markets we cover had higher positioning while the other six markets had lower speculator contracts.
Leading the gains for the softs markets was Corn (112,070 contracts) with Soybeans (102,295 contracts), Soybean Meal (41,851 contracts), Wheat (6,671 contracts) and Soybean Oil (4,889 contracts) also showing positive weeks.
The markets with the declines in speculator bets this week were Lean Hogs (-13,582 contracts), Sugar (-11,744 contracts), Cotton (-11,086 contracts), Coffee (-5,713 contracts), Live Cattle (-328 contracts) and with Cocoa (-590 contracts) also registering lower bets on the week.
Soft Commodities Net Speculators Leaderboard
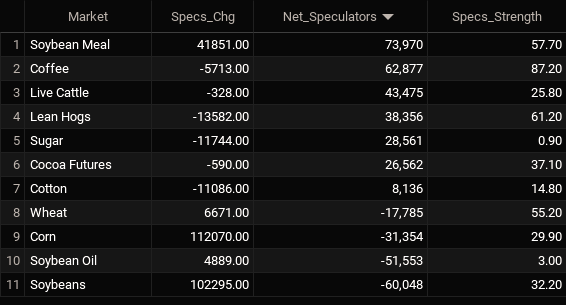
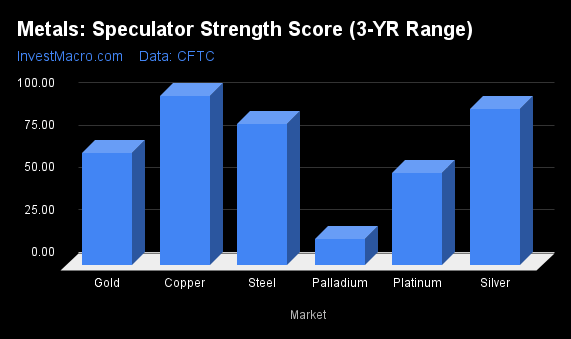
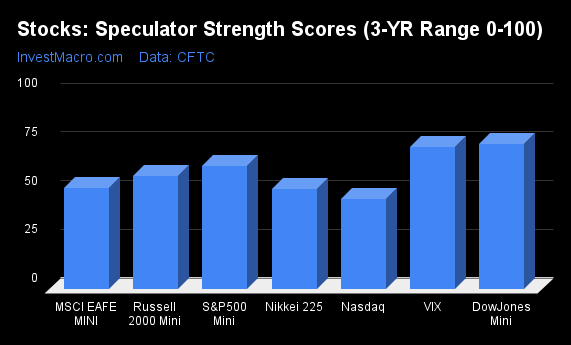
Legend: Weekly Speculators Change | Speculators Current Net Position | Speculators Strength Score compared to last 3-Years (0-100 range)
Strength Scores led by Coffee & Lean Hogs
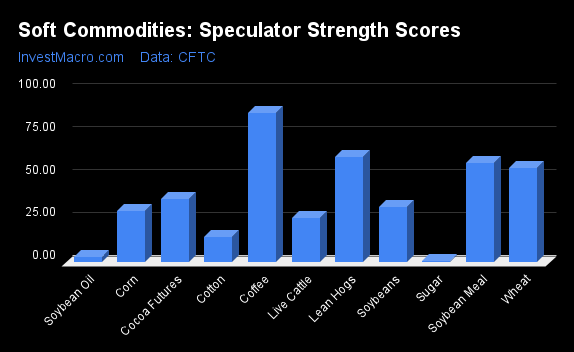
COT Strength Scores (a normalized measure of Speculator positions over a 3-Year range, from 0 to 100 where above 80 is Extreme-Bullish and below 20 is Extreme-Bearish) showed that Coffee (87 percent) and Lean Hogs (61 percent) lead the softs markets this week. Soybean Meal (58 percent) and Wheat (55 percent) come in as the next highest in the weekly strength scores.
On the downside, Sugar (1 percent), Soybean Oil (3 percent) and Cotton (15 percent) come in at the lowest strength levels currently and are in Extreme-Bearish territory (below 20 percent).
Strength Statistics:
Corn (29.9 percent) vs Corn previous week (15.6 percent)
Sugar (0.9 percent) vs Sugar previous week (5.2 percent)
Coffee (87.2 percent) vs Coffee previous week (92.7 percent)
Soybeans (32.2 percent) vs Soybeans previous week (8.2 percent)
Soybean Oil (3.0 percent) vs Soybean Oil previous week (0.0 percent)
Soybean Meal (57.7 percent) vs Soybean Meal previous week (40.6 percent)
Live Cattle (25.8 percent) vs Live Cattle previous week (26.2 percent)
Lean Hogs (61.2 percent) vs Lean Hogs previous week (72.3 percent)
Cotton (14.8 percent) vs Cotton previous week (23.2 percent)
Cocoa (37.1 percent) vs Cocoa previous week (37.7 percent)
Wheat (55.2 percent) vs Wheat previous week (50.5 percent)
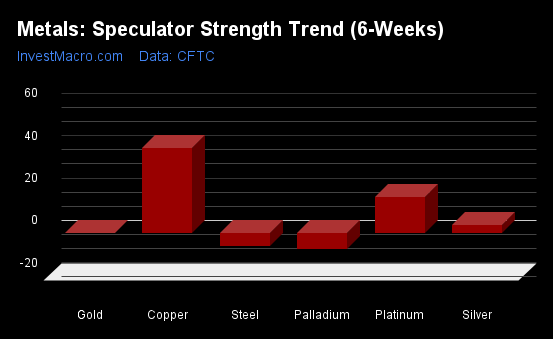
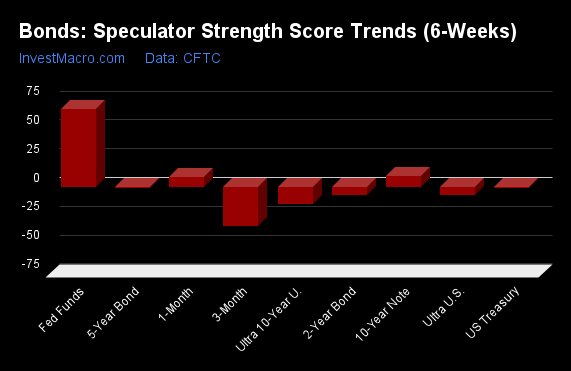
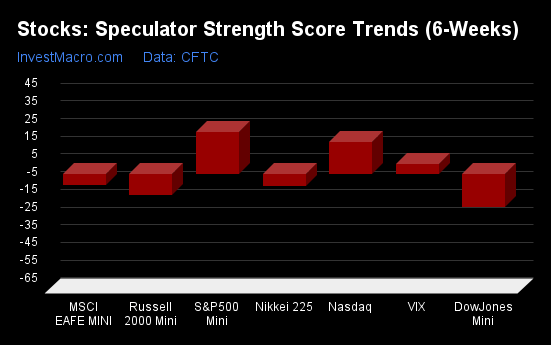
Soybean Meal & Wheat top the 6-Week Strength Trends
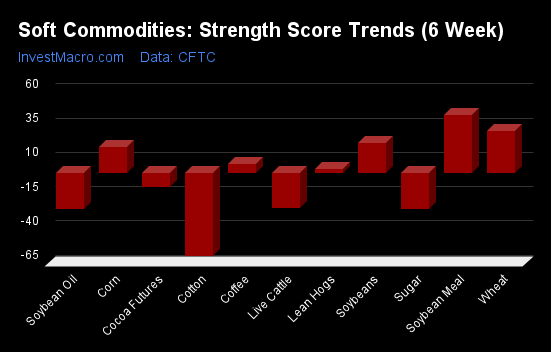
COT Strength Score Trends (or move index, calculates the 6-week changes in strength scores) showed that Soybean Meal (43 percent) and Wheat (31 percent) lead the past six weeks trends for soft commodities. Soybeans (22 percent), Corn (19 percent) and Coffee (7 percent) are the next highest positive movers in the latest trends data.
Cotton (-61 percent) leads the downside trend scores currently with Soybean Oil (-26 percent), Sugar (-26 percent) and Live Cattle (-25 percent) following next with lower trend scores.
Strength Trend Statistics:
Corn (18.7 percent) vs Corn previous week (4.1 percent)
Sugar (-26.0 percent) vs Sugar previous week (-18.5 percent)
Coffee (6.7 percent) vs Coffee previous week (17.9 percent)
Soybeans (22.0 percent) vs Soybeans previous week (1.2 percent)
Soybean Oil (-26.1 percent) vs Soybean Oil previous week (-22.2 percent)
Soybean Meal (42.5 percent) vs Soybean Meal previous week (31.9 percent)
Live Cattle (-25.3 percent) vs Live Cattle previous week (-32.3 percent)
Lean Hogs (3.0 percent) vs Lean Hogs previous week (15.0 percent)
Cotton (-60.6 percent) vs Cotton previous week (-54.5 percent)
Cocoa (-10.0 percent) vs Cocoa previous week (-18.8 percent)
Wheat (30.5 percent) vs Wheat previous week (21.9 percent)
Individual Soft Commodities Markets:
CORN Futures:
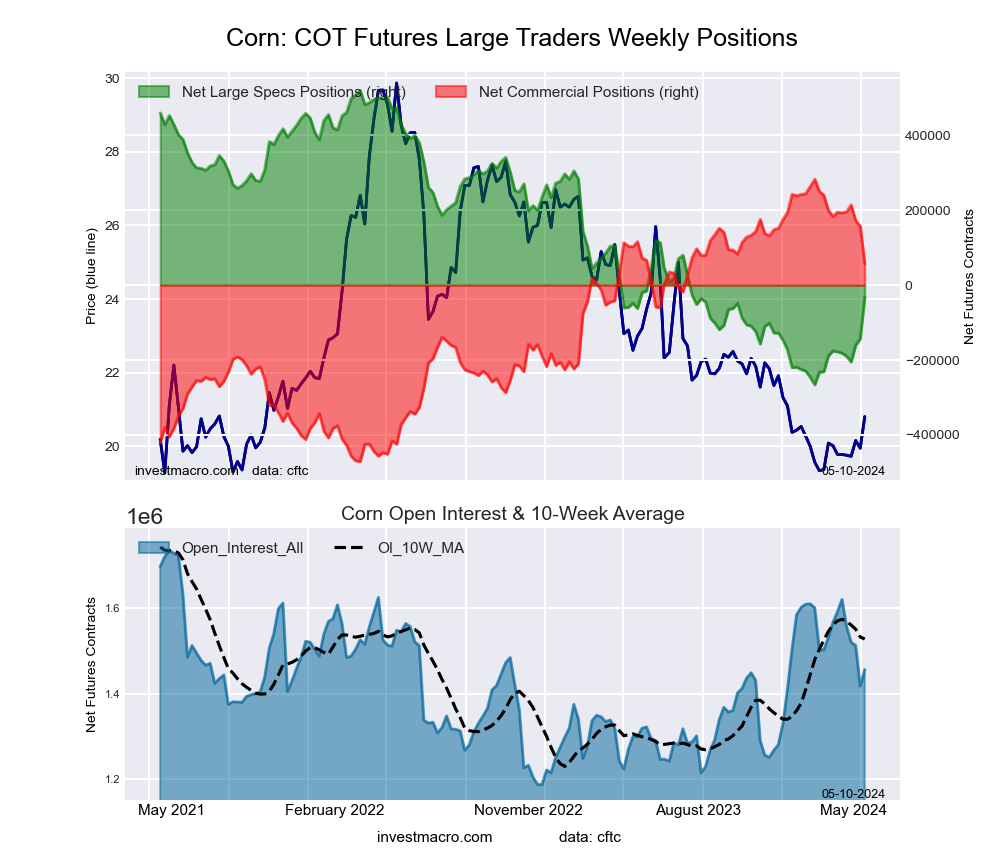 The CORN large speculator standing this week was a net position of -31,354 contracts in the data reported through Tuesday. This was a weekly lift of 112,070 contracts from the previous week which had a total of -143,424 net contracts.
This week’s current strength score (the trader positioning range over the past three years, measured from 0 to 100) shows the speculators are currently Bearish with a score of 29.9 percent. The commercials are Bullish with a score of 70.0 percent and the small traders (not shown in chart) are Bullish with a score of 74.0 percent.
Price Trend-Following Model: Weak Downtrend
Our weekly trend-following model classifies the current market price position as: Weak Downtrend. The current action for the model is considered to be: Hold – Maintain Short Position.
| CORN Futures Statistics | SPECULATORS | COMMERCIALS | SMALL TRADERS |
| – Percent of Open Interest Longs: | 21.4 | 42.7 | 9.6 |
| – Percent of Open Interest Shorts: | 23.6 | 38.8 | 11.3 |
| – Net Position: | -31,354 | 56,642 | -25,288 |
| – Gross Longs: | 311,911 | 621,487 | 139,562 |
| – Gross Shorts: | 343,265 | 564,845 | 164,850 |
| – Long to Short Ratio: | 0.9 to 1 | 1.1 to 1 | 0.8 to 1 |
| NET POSITION TREND: | | | |
| – Strength Index Score (3 Year Range Pct): | 29.9 | 70.0 | 74.0 |
| – Strength Index Reading (3 Year Range): | Bearish | Bullish | Bullish |
| NET POSITION MOVEMENT INDEX: | | | |
| – 6-Week Change in Strength Index: | 18.7 | -18.3 | -11.5 |
SUGAR Futures:
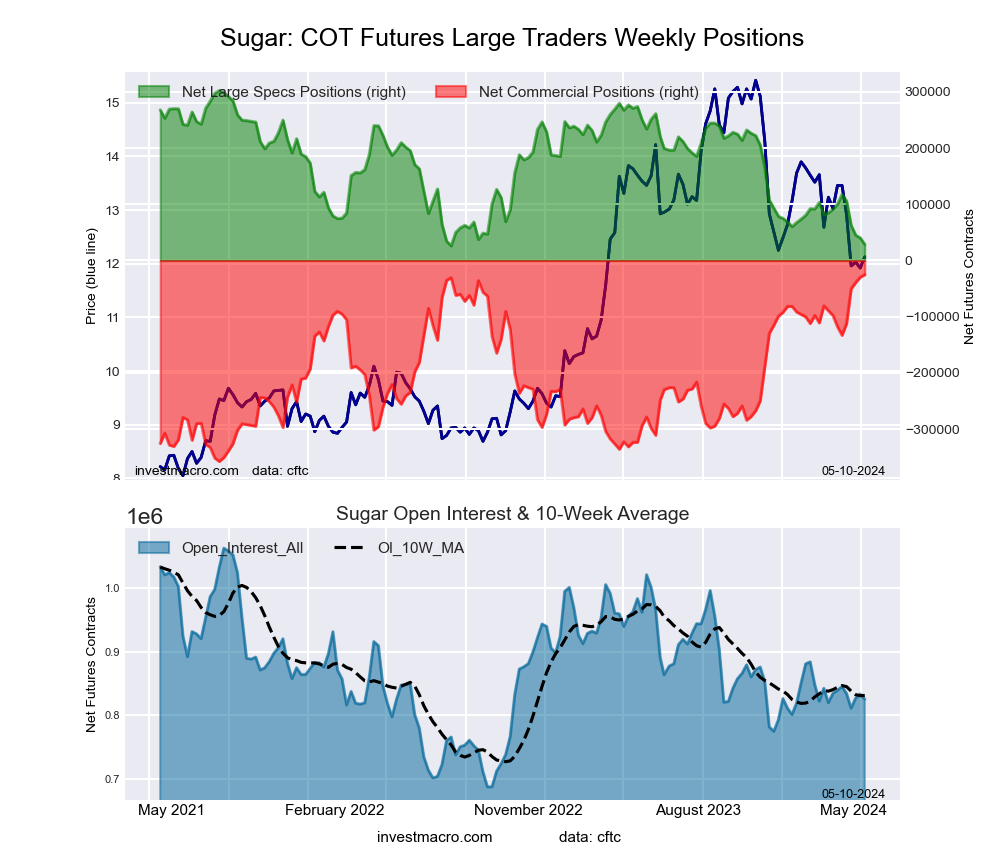 The SUGAR large speculator standing this week was a net position of 28,561 contracts in the data reported through Tuesday. This was a weekly decline of -11,744 contracts from the previous week which had a total of 40,305 net contracts.
This week’s current strength score (the trader positioning range over the past three years, measured from 0 to 100) shows the speculators are currently Bearish-Extreme with a score of 0.9 percent. The commercials are Bullish-Extreme with a score of 100.0 percent and the small traders (not shown in chart) are Bearish-Extreme with a score of 12.0 percent.
Price Trend-Following Model: Strong Downtrend
Our weekly trend-following model classifies the current market price position as: Strong Downtrend. The current action for the model is considered to be: Hold – Maintain Short Position.
| SUGAR Futures Statistics | SPECULATORS | COMMERCIALS | SMALL TRADERS |
| – Percent of Open Interest Longs: | 24.2 | 53.1 | 8.0 |
| – Percent of Open Interest Shorts: | 20.8 | 56.1 | 8.4 |
| – Net Position: | 28,561 | -25,176 | -3,385 |
| – Gross Longs: | 200,063 | 438,212 | 65,992 |
| – Gross Shorts: | 171,502 | 463,388 | 69,377 |
| – Long to Short Ratio: | 1.2 to 1 | 0.9 to 1 | 1.0 to 1 |
| NET POSITION TREND: | | | |
| – Strength Index Score (3 Year Range Pct): | 0.9 | 100.0 | 12.0 |
| – Strength Index Reading (3 Year Range): | Bearish-Extreme | Bullish-Extreme | Bearish-Extreme |
| NET POSITION MOVEMENT INDEX: | | | |
| – 6-Week Change in Strength Index: | -26.0 | 27.9 | -28.3 |
COFFEE Futures:
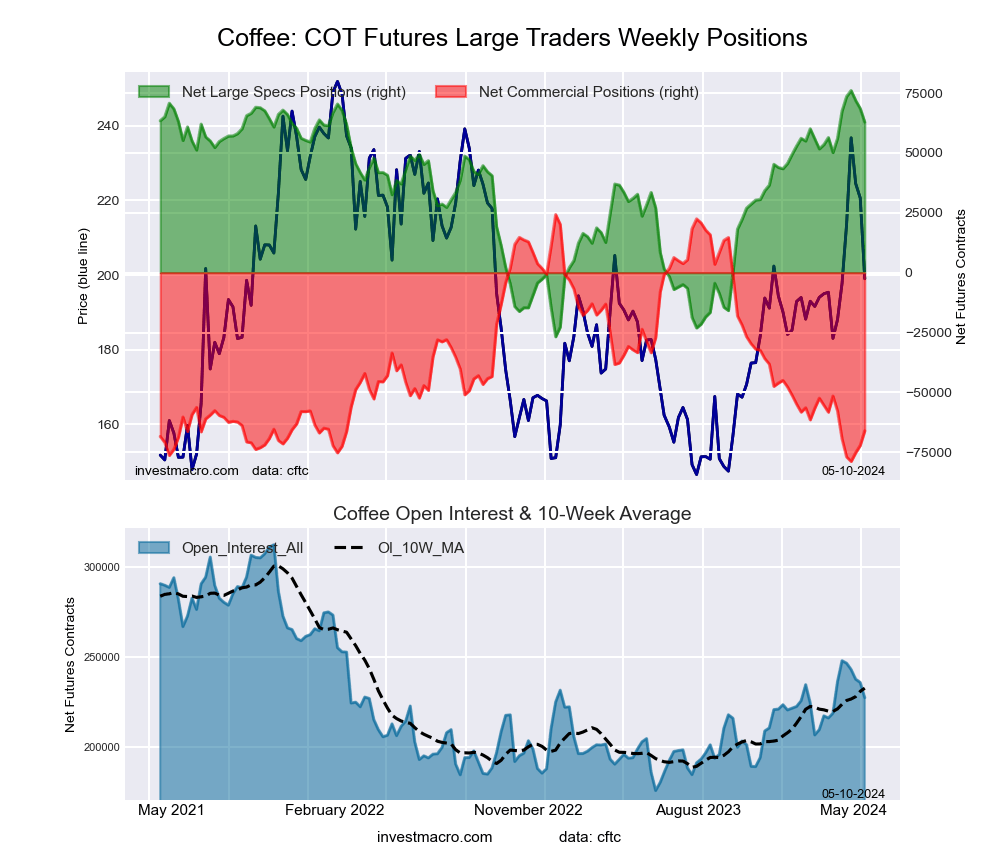 The COFFEE large speculator standing this week was a net position of 62,877 contracts in the data reported through Tuesday. This was a weekly decline of -5,713 contracts from the previous week which had a total of 68,590 net contracts.
This week’s current strength score (the trader positioning range over the past three years, measured from 0 to 100) shows the speculators are currently Bullish-Extreme with a score of 87.2 percent. The commercials are Bearish-Extreme with a score of 12.4 percent and the small traders (not shown in chart) are Bullish with a score of 61.5 percent.
Price Trend-Following Model: Uptrend
Our weekly trend-following model classifies the current market price position as: Uptrend. The current action for the model is considered to be: Hold – Maintain Long Position.
| COFFEE Futures Statistics | SPECULATORS | COMMERCIALS | SMALL TRADERS |
| – Percent of Open Interest Longs: | 37.4 | 35.2 | 4.1 |
| – Percent of Open Interest Shorts: | 9.8 | 64.2 | 2.7 |
| – Net Position: | 62,877 | -66,039 | 3,162 |
| – Gross Longs: | 85,054 | 79,896 | 9,211 |
| – Gross Shorts: | 22,177 | 145,935 | 6,049 |
| – Long to Short Ratio: | 3.8 to 1 | 0.5 to 1 | 1.5 to 1 |
| NET POSITION TREND: | | | |
| – Strength Index Score (3 Year Range Pct): | 87.2 | 12.4 | 61.5 |
| – Strength Index Reading (3 Year Range): | Bullish-Extreme | Bearish-Extreme | Bullish |
| NET POSITION MOVEMENT INDEX: | | | |
| – 6-Week Change in Strength Index: | 6.7 | -8.1 | 21.4 |
SOYBEANS Futures:
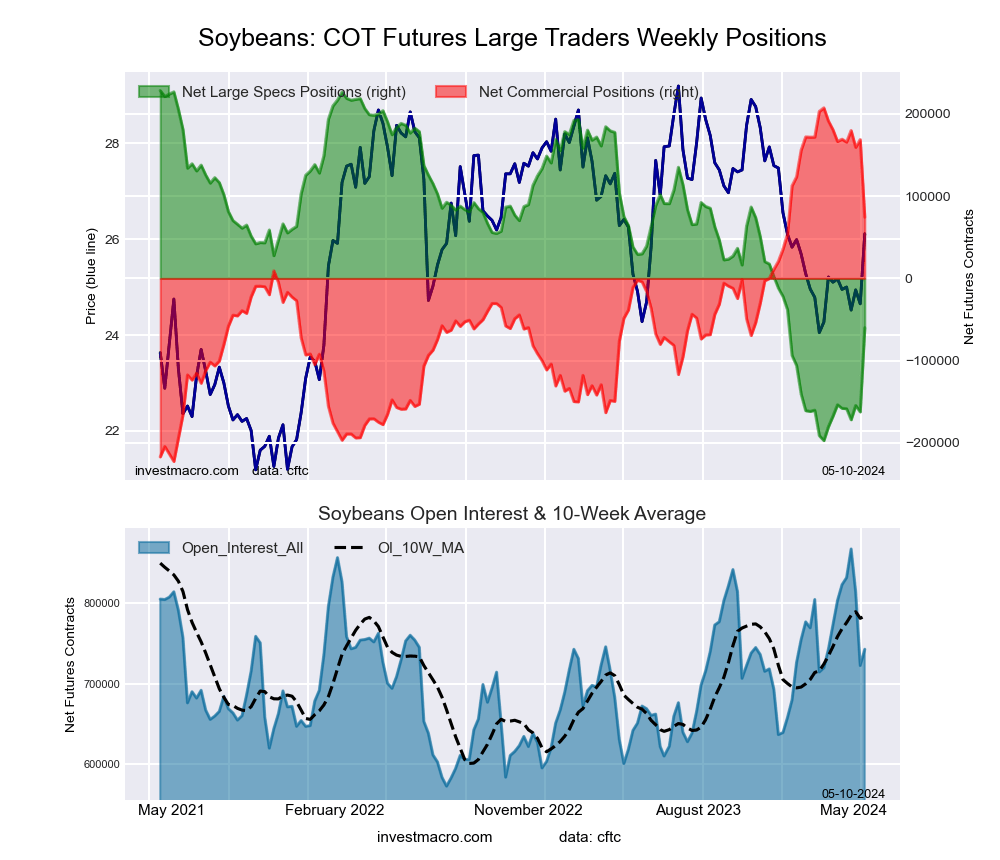 The SOYBEANS large speculator standing this week was a net position of -60,048 contracts in the data reported through Tuesday. This was a weekly rise of 102,295 contracts from the previous week which had a total of -162,343 net contracts.
This week’s current strength score (the trader positioning range over the past three years, measured from 0 to 100) shows the speculators are currently Bearish with a score of 32.2 percent. The commercials are Bullish with a score of 69.1 percent and the small traders (not shown in chart) are Bullish with a score of 73.9 percent.
Price Trend-Following Model: Weak Downtrend
Our weekly trend-following model classifies the current market price position as: Weak Downtrend. The current action for the model is considered to be: Hold – Maintain Short Position.
| SOYBEANS Futures Statistics | SPECULATORS | COMMERCIALS | SMALL TRADERS |
| – Percent of Open Interest Longs: | 16.6 | 57.4 | 6.9 |
| – Percent of Open Interest Shorts: | 24.7 | 47.4 | 8.8 |
| – Net Position: | -60,048 | 74,323 | -14,275 |
| – Gross Longs: | 123,324 | 426,277 | 51,042 |
| – Gross Shorts: | 183,372 | 351,954 | 65,317 |
| – Long to Short Ratio: | 0.7 to 1 | 1.2 to 1 | 0.8 to 1 |
| NET POSITION TREND: | | | |
| – Strength Index Score (3 Year Range Pct): | 32.2 | 69.1 | 73.9 |
| – Strength Index Reading (3 Year Range): | Bearish | Bullish | Bullish |
| NET POSITION MOVEMENT INDEX: | | | |
| – 6-Week Change in Strength Index: | 22.0 | -21.4 | -4.0 |
SOYBEAN OIL Futures:
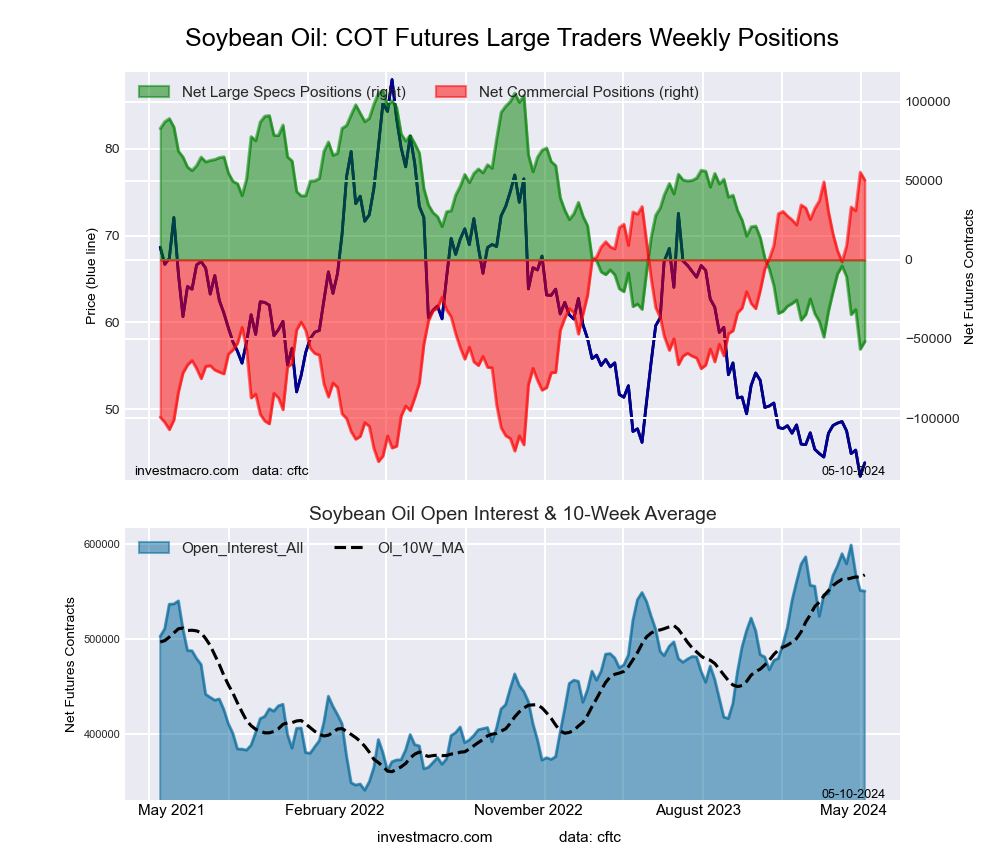 The SOYBEAN OIL large speculator standing this week was a net position of -51,553 contracts in the data reported through Tuesday. This was a weekly gain of 4,889 contracts from the previous week which had a total of -56,442 net contracts.
This week’s current strength score (the trader positioning range over the past three years, measured from 0 to 100) shows the speculators are currently Bearish-Extreme with a score of 3.0 percent. The commercials are Bullish-Extreme with a score of 97.3 percent and the small traders (not shown in chart) are Bearish-Extreme with a score of 18.7 percent.
Price Trend-Following Model: Strong Downtrend
Our weekly trend-following model classifies the current market price position as: Strong Downtrend. The current action for the model is considered to be: Hold – Maintain Short Position.
| SOYBEAN OIL Futures Statistics | SPECULATORS | COMMERCIALS | SMALL TRADERS |
| – Percent of Open Interest Longs: | 20.7 | 53.3 | 5.5 |
| – Percent of Open Interest Shorts: | 30.0 | 44.1 | 5.3 |
| – Net Position: | -51,553 | 50,351 | 1,202 |
| – Gross Longs: | 113,697 | 293,066 | 30,181 |
| – Gross Shorts: | 165,250 | 242,715 | 28,979 |
| – Long to Short Ratio: | 0.7 to 1 | 1.2 to 1 | 1.0 to 1 |
| NET POSITION TREND: | | | |
| – Strength Index Score (3 Year Range Pct): | 3.0 | 97.3 | 18.7 |
| – Strength Index Reading (3 Year Range): | Bearish-Extreme | Bullish-Extreme | Bearish-Extreme |
| NET POSITION MOVEMENT INDEX: | | | |
| – 6-Week Change in Strength Index: | -26.1 | 24.4 | -7.6 |
SOYBEAN MEAL Futures:
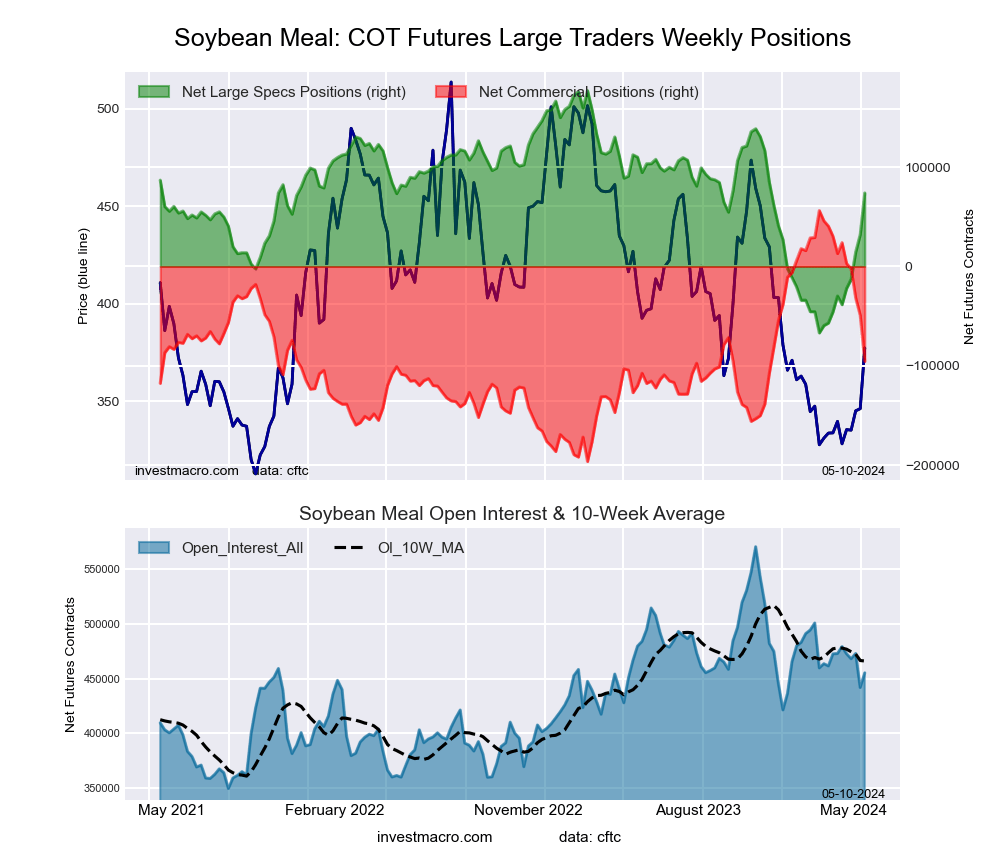 The SOYBEAN MEAL large speculator standing this week was a net position of 73,970 contracts in the data reported through Tuesday. This was a weekly advance of 41,851 contracts from the previous week which had a total of 32,119 net contracts.
This week’s current strength score (the trader positioning range over the past three years, measured from 0 to 100) shows the speculators are currently Bullish with a score of 57.7 percent. The commercials are Bearish with a score of 39.9 percent and the small traders (not shown in chart) are Bullish with a score of 52.1 percent.
Price Trend-Following Model: Weak Downtrend
Our weekly trend-following model classifies the current market price position as: Weak Downtrend. The current action for the model is considered to be: Hold – Maintain Short Position.
| SOYBEAN MEAL Futures Statistics | SPECULATORS | COMMERCIALS | SMALL TRADERS |
| – Percent of Open Interest Longs: | 30.6 | 40.1 | 10.2 |
| – Percent of Open Interest Shorts: | 14.4 | 61.0 | 5.5 |
| – Net Position: | 73,970 | -95,405 | 21,435 |
| – Gross Longs: | 139,373 | 182,605 | 46,648 |
| – Gross Shorts: | 65,403 | 278,010 | 25,213 |
| – Long to Short Ratio: | 2.1 to 1 | 0.7 to 1 | 1.9 to 1 |
| NET POSITION TREND: | | | |
| – Strength Index Score (3 Year Range Pct): | 57.7 | 39.9 | 52.1 |
| – Strength Index Reading (3 Year Range): | Bullish | Bearish | Bullish |
| NET POSITION MOVEMENT INDEX: | | | |
| – 6-Week Change in Strength Index: | 42.5 | -43.0 | 21.3 |
LIVE CATTLE Futures:
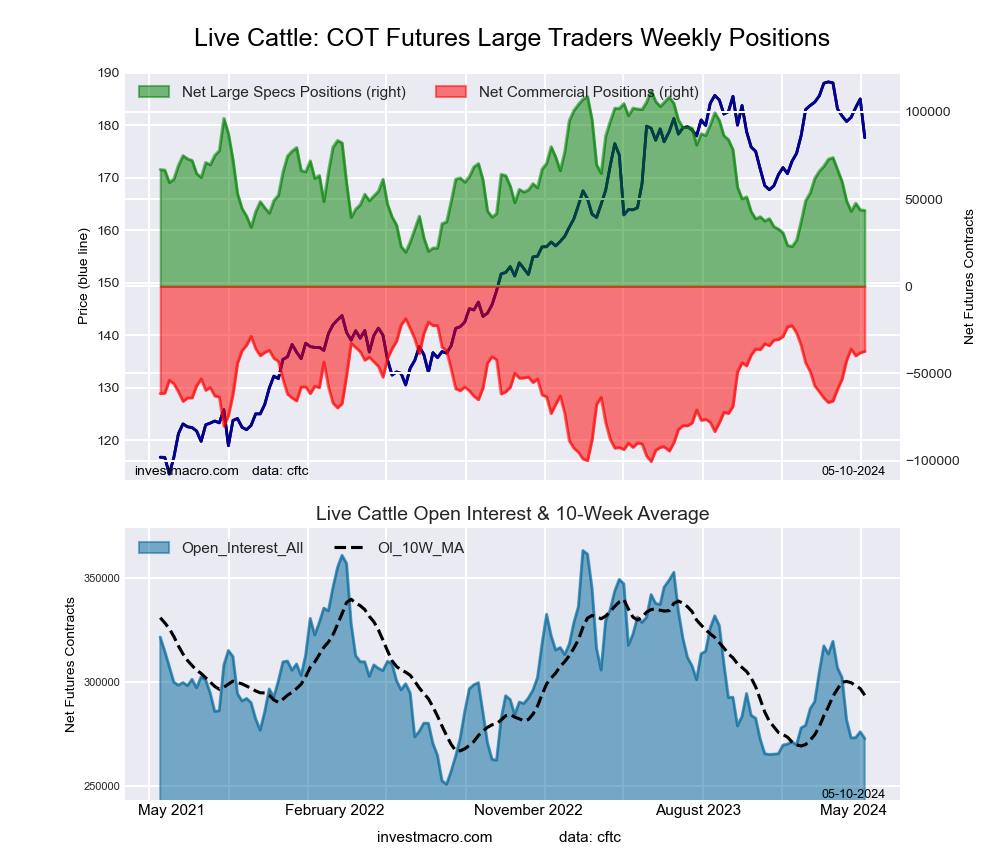 The LIVE CATTLE large speculator standing this week was a net position of 43,475 contracts in the data reported through Tuesday. This was a weekly decline of -328 contracts from the previous week which had a total of 43,803 net contracts.
This week’s current strength score (the trader positioning range over the past three years, measured from 0 to 100) shows the speculators are currently Bearish with a score of 25.8 percent. The commercials are Bullish with a score of 77.1 percent and the small traders (not shown in chart) are Bullish with a score of 57.0 percent.
Price Trend-Following Model: Weak Uptrend
Our weekly trend-following model classifies the current market price position as: Weak Uptrend. The current action for the model is considered to be: Hold – Maintain Long Position.
| LIVE CATTLE Futures Statistics | SPECULATORS | COMMERCIALS | SMALL TRADERS |
| – Percent of Open Interest Longs: | 35.5 | 36.1 | 9.6 |
| – Percent of Open Interest Shorts: | 19.6 | 49.8 | 11.9 |
| – Net Position: | 43,475 | -37,324 | -6,151 |
| – Gross Longs: | 96,844 | 98,469 | 26,308 |
| – Gross Shorts: | 53,369 | 135,793 | 32,459 |
| – Long to Short Ratio: | 1.8 to 1 | 0.7 to 1 | 0.8 to 1 |
| NET POSITION TREND: | | | |
| – Strength Index Score (3 Year Range Pct): | 25.8 | 77.1 | 57.0 |
| – Strength Index Reading (3 Year Range): | Bearish | Bullish | Bullish |
| NET POSITION MOVEMENT INDEX: | | | |
| – 6-Week Change in Strength Index: | -25.3 | 26.5 | 9.1 |
LEAN HOGS Futures:
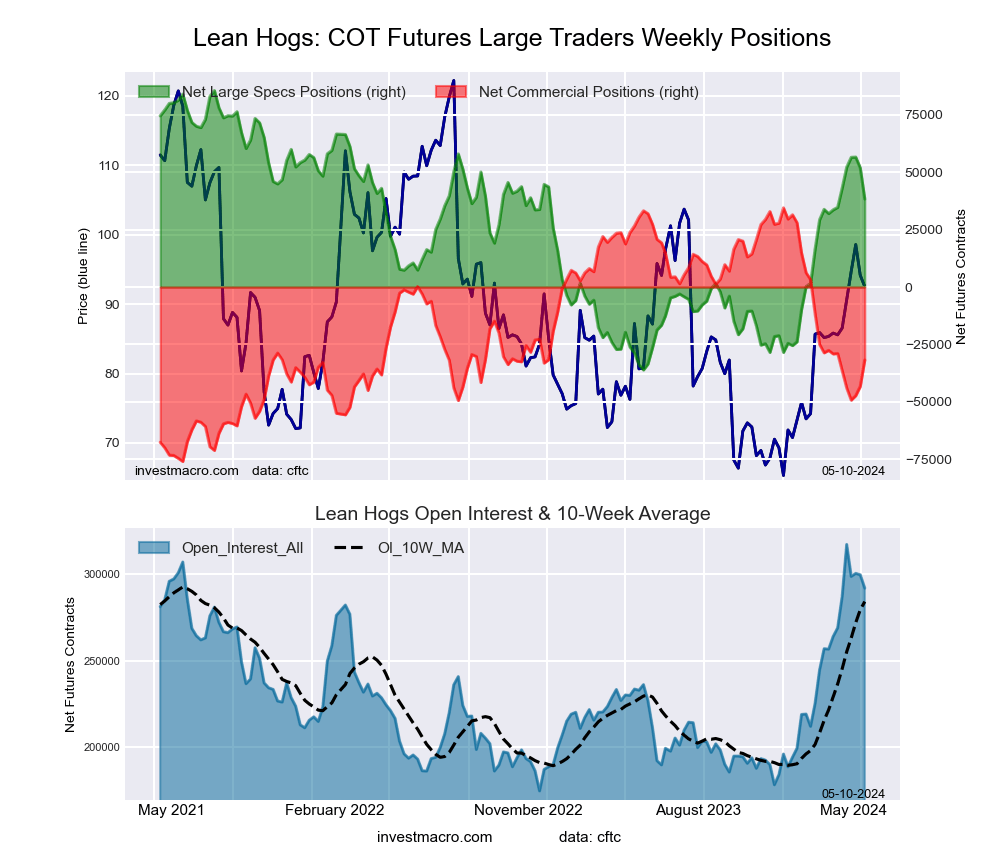 The LEAN HOGS large speculator standing this week was a net position of 38,356 contracts in the data reported through Tuesday. This was a weekly fall of -13,582 contracts from the previous week which had a total of 51,938 net contracts.
This week’s current strength score (the trader positioning range over the past three years, measured from 0 to 100) shows the speculators are currently Bullish with a score of 61.2 percent. The commercials are Bearish with a score of 40.0 percent and the small traders (not shown in chart) are Bullish with a score of 53.8 percent.
Price Trend-Following Model: Uptrend
Our weekly trend-following model classifies the current market price position as: Uptrend. The current action for the model is considered to be: Hold – Maintain Long Position.
| LEAN HOGS Futures Statistics | SPECULATORS | COMMERCIALS | SMALL TRADERS |
| – Percent of Open Interest Longs: | 34.5 | 35.5 | 7.6 |
| – Percent of Open Interest Shorts: | 21.3 | 46.4 | 9.8 |
| – Net Position: | 38,356 | -31,763 | -6,593 |
| – Gross Longs: | 100,612 | 103,759 | 22,074 |
| – Gross Shorts: | 62,256 | 135,522 | 28,667 |
| – Long to Short Ratio: | 1.6 to 1 | 0.8 to 1 | 0.8 to 1 |
| NET POSITION TREND: | | | |
| – Strength Index Score (3 Year Range Pct): | 61.2 | 40.0 | 53.8 |
| – Strength Index Reading (3 Year Range): | Bullish | Bearish | Bullish |
| NET POSITION MOVEMENT INDEX: | | | |
| – 6-Week Change in Strength Index: | 3.0 | -2.6 | -3.6 |
COTTON Futures:
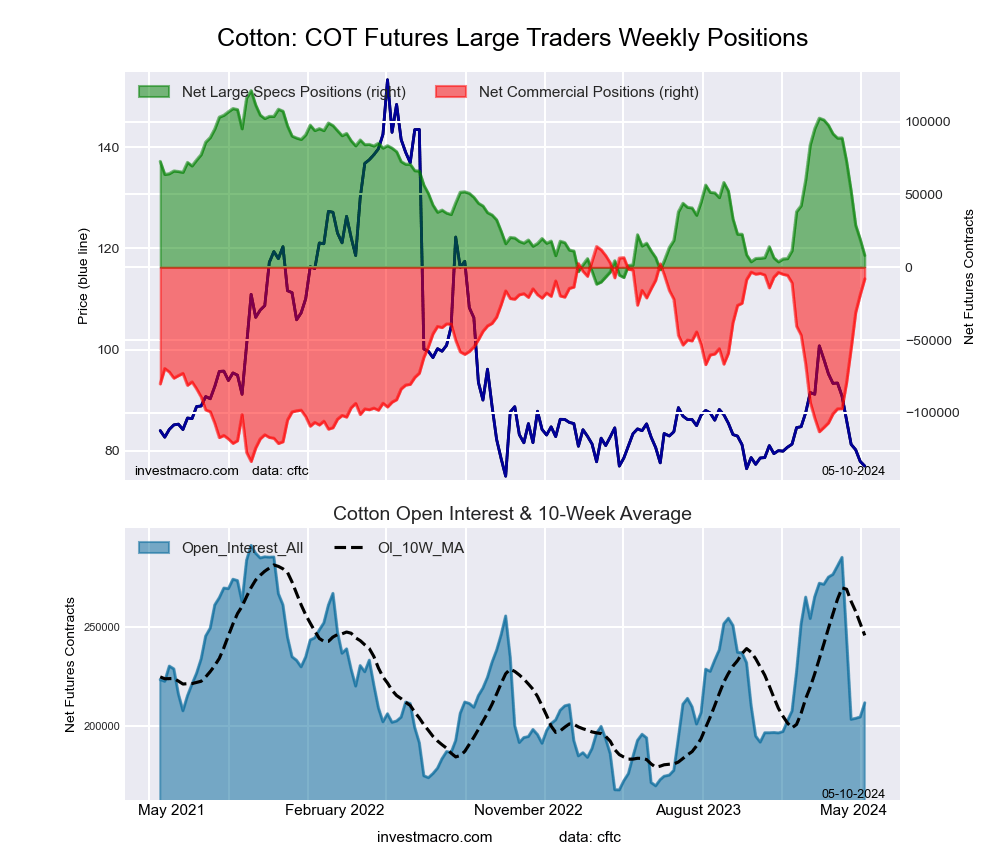 The COTTON large speculator standing this week was a net position of 8,136 contracts in the data reported through Tuesday. This was a weekly fall of -11,086 contracts from the previous week which had a total of 19,222 net contracts.
This week’s current strength score (the trader positioning range over the past three years, measured from 0 to 100) shows the speculators are currently Bearish-Extreme with a score of 14.8 percent. The commercials are Bullish-Extreme with a score of 85.0 percent and the small traders (not shown in chart) are Bearish-Extreme with a score of 15.0 percent.
Price Trend-Following Model: Strong Downtrend
Our weekly trend-following model classifies the current market price position as: Strong Downtrend. The current action for the model is considered to be: New Sell – Short Position.
| COTTON Futures Statistics | SPECULATORS | COMMERCIALS | SMALL TRADERS |
| – Percent of Open Interest Longs: | 31.2 | 44.2 | 5.9 |
| – Percent of Open Interest Shorts: | 27.4 | 48.0 | 6.0 |
| – Net Position: | 8,136 | -7,960 | -176 |
| – Gross Longs: | 66,141 | 93,741 | 12,568 |
| – Gross Shorts: | 58,005 | 101,701 | 12,744 |
| – Long to Short Ratio: | 1.1 to 1 | 0.9 to 1 | 1.0 to 1 |
| NET POSITION TREND: | | | |
| – Strength Index Score (3 Year Range Pct): | 14.8 | 85.0 | 15.0 |
| – Strength Index Reading (3 Year Range): | Bearish-Extreme | Bullish-Extreme | Bearish-Extreme |
| NET POSITION MOVEMENT INDEX: | | | |
| – 6-Week Change in Strength Index: | -60.6 | 60.5 | -52.8 |
COCOA Futures:
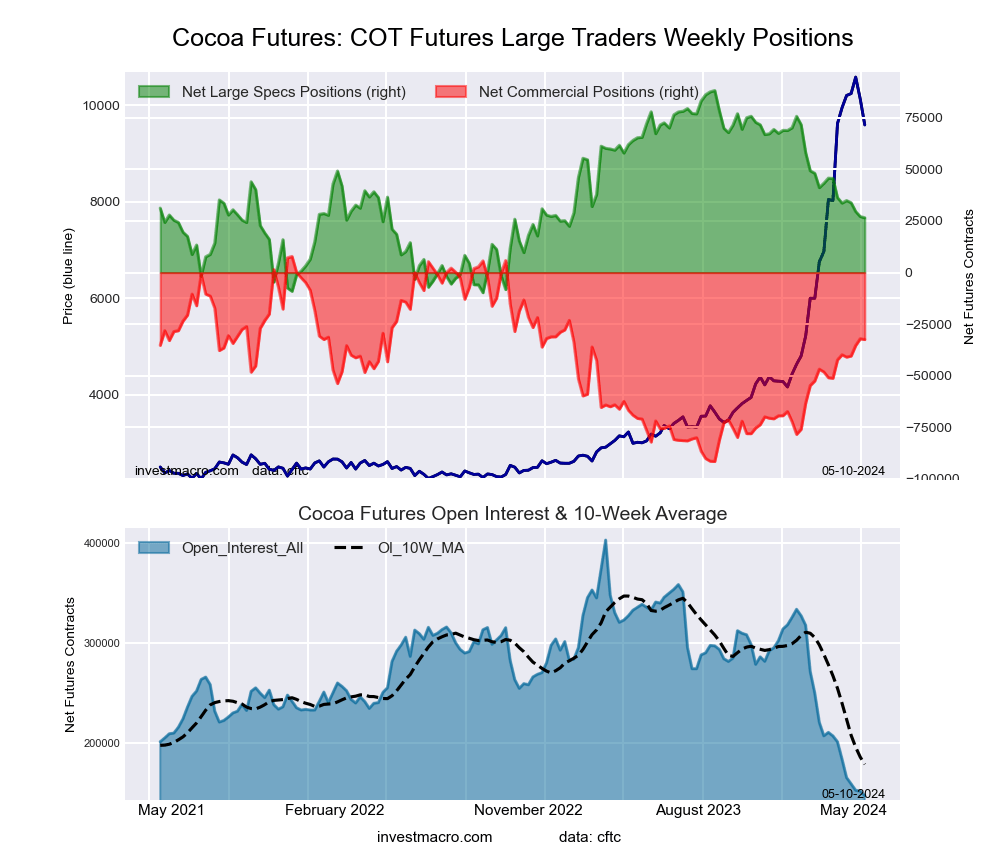 The COCOA large speculator standing this week was a net position of 26,562 contracts in the data reported through Tuesday. This was a weekly fall of -590 contracts from the previous week which had a total of 27,152 net contracts.
This week’s current strength score (the trader positioning range over the past three years, measured from 0 to 100) shows the speculators are currently Bearish with a score of 37.1 percent. The commercials are Bullish with a score of 59.5 percent and the small traders (not shown in chart) are Bullish with a score of 62.7 percent.
Price Trend-Following Model: Uptrend
Our weekly trend-following model classifies the current market price position as: Uptrend. The current action for the model is considered to be: Hold – Maintain Long Position.
| COCOA Futures Statistics | SPECULATORS | COMMERCIALS | SMALL TRADERS |
| – Percent of Open Interest Longs: | 30.2 | 35.1 | 7.9 |
| – Percent of Open Interest Shorts: | 12.2 | 57.1 | 3.9 |
| – Net Position: | 26,562 | -32,495 | 5,933 |
| – Gross Longs: | 44,579 | 51,829 | 11,641 |
| – Gross Shorts: | 18,017 | 84,324 | 5,708 |
| – Long to Short Ratio: | 2.5 to 1 | 0.6 to 1 | 2.0 to 1 |
| NET POSITION TREND: | | | |
| – Strength Index Score (3 Year Range Pct): | 37.1 | 59.5 | 62.7 |
| – Strength Index Reading (3 Year Range): | Bearish | Bullish | Bullish |
| NET POSITION MOVEMENT INDEX: | | | |
| – 6-Week Change in Strength Index: | -10.0 | 9.9 | -1.0 |
WHEAT Futures:
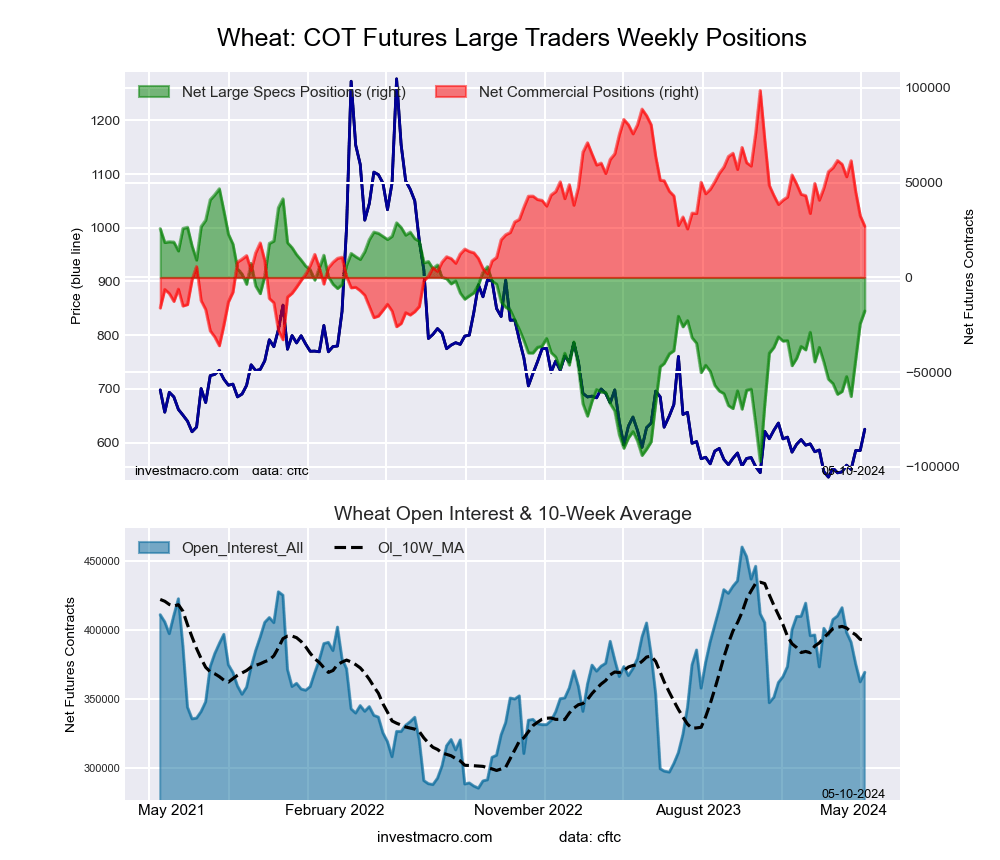 The WHEAT large speculator standing this week was a net position of -17,785 contracts in the data reported through Tuesday. This was a weekly gain of 6,671 contracts from the previous week which had a total of -24,456 net contracts.
This week’s current strength score (the trader positioning range over the past three years, measured from 0 to 100) shows the speculators are currently Bullish with a score of 55.2 percent. The commercials are Bearish with a score of 46.8 percent and the small traders (not shown in chart) are Bearish with a score of 26.1 percent.
Price Trend-Following Model: Weak Downtrend
Our weekly trend-following model classifies the current market price position as: Weak Downtrend. The current action for the model is considered to be: Hold – Maintain Short Position.
| WHEAT Futures Statistics | SPECULATORS | COMMERCIALS | SMALL TRADERS |
| – Percent of Open Interest Longs: | 33.2 | 36.6 | 6.8 |
| – Percent of Open Interest Shorts: | 38.0 | 29.3 | 9.3 |
| – Net Position: | -17,785 | 27,005 | -9,220 |
| – Gross Longs: | 122,686 | 135,193 | 25,281 |
| – Gross Shorts: | 140,471 | 108,188 | 34,501 |
| – Long to Short Ratio: | 0.9 to 1 | 1.2 to 1 | 0.7 to 1 |
| NET POSITION TREND: | | | |
| – Strength Index Score (3 Year Range Pct): | 55.2 | 46.8 | 26.1 |
| – Strength Index Reading (3 Year Range): | Bullish | Bearish | Bearish |
| NET POSITION MOVEMENT INDEX: | | | |
| – 6-Week Change in Strength Index: | 30.5 | -25.7 | -40.2 |
Article By InvestMacro – Receive our weekly COT Newsletter
*COT Report: The COT data, released weekly to the public each Friday, is updated through the most recent Tuesday (data is 3 days old) and shows a quick view of how large speculators or non-commercials (for-profit traders) were positioned in the futures markets.
The CFTC categorizes trader positions according to commercial hedgers (traders who use futures contracts for hedging as part of the business), non-commercials (large traders who speculate to realize trading profits) and nonreportable traders (usually small traders/speculators) as well as their open interest (contracts open in the market at time of reporting). See CFTC criteria here.