
By RoboForex Analytical Department
The Japanese yen continues its recovery rally. The USDJPY pair falls to 143.38 on Monday.
This development is likely only the midpoint of the process as the market regains past losses and brings the JPY to equilibrium. USDJPY is currently at its lowest level since 3 January.
Several reasons are driving this movement. The first is the winding down of carry trade operations on the yen. The process started earlier when it became clear that the Bank of Japan was moving towards tightening monetary conditions.
The second concern is that a US recession is playing an important role. Friday’s employment data was weaker than expected, triggering fears that the Federal Reserve might delay its decision on interest rate cuts. The market is worried the Fed could be late in making a crucial decision.
The third key factor for the JPY is the increased attractiveness of the yen as a safe-haven asset amid escalating geopolitical tensions in the Middle East. The ongoing conflict in the region poses a hypothetical threat to global stability, and investors are factoring in this risk and favouring safe-haven assets.
Free Reports:
 Sign Up for Our Stock Market Newsletter – Get updated on News, Charts & Rankings of Public Companies when you join our Stocks Newsletter
 Get our Weekly Commitment of Traders Reports - See where the biggest traders (Hedge Funds and Commercial Hedgers) are positioned in the futures markets on a weekly basis.
Technical analysis: USD/JPY
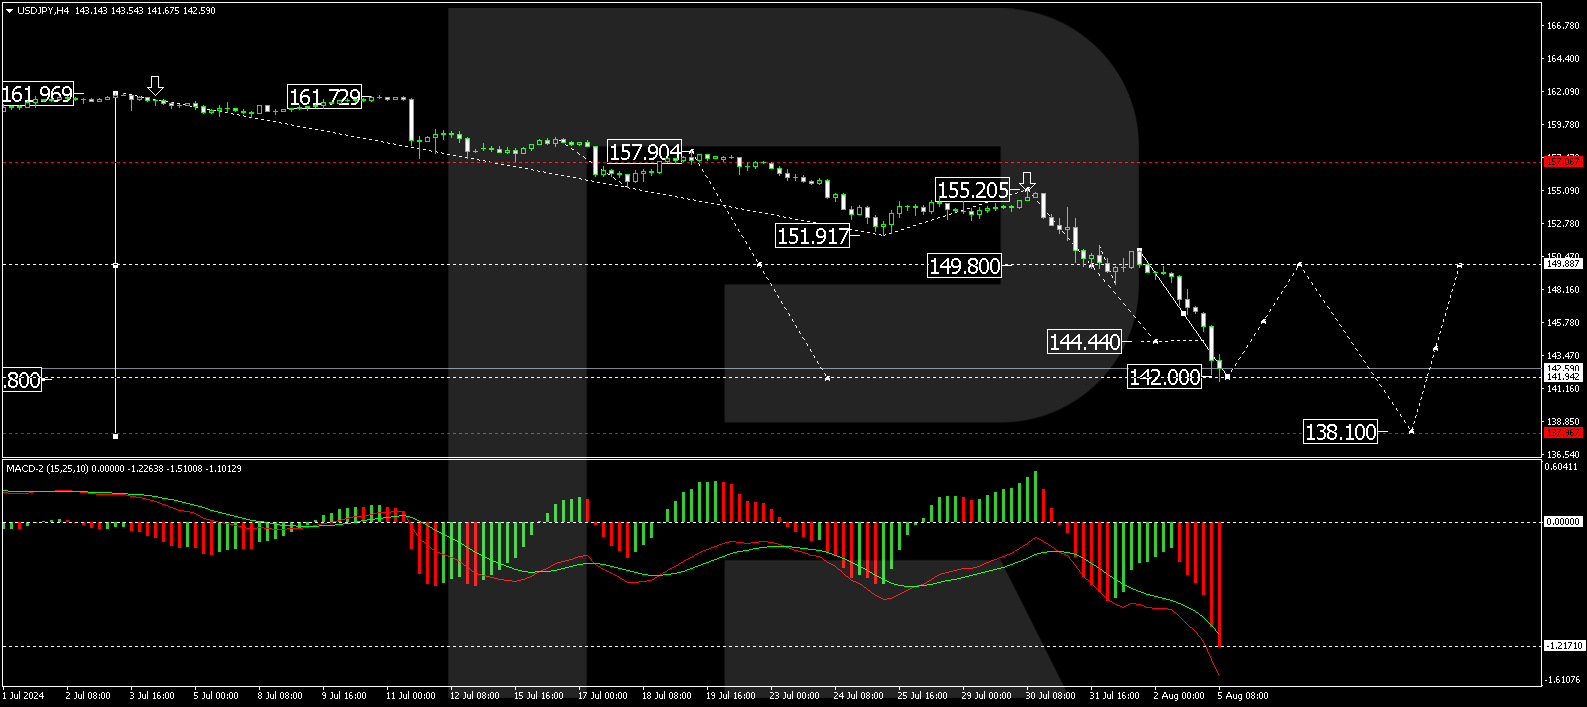
The USD/JPY pair formed a consolidation range of around 149.80 before breaking downwards on impactful news. The decline reached 142.00, setting a local low. We anticipate a new consolidation phase above this level. An upward break could see a corrective move towards 149.80. Conversely, a downward exit might extend losses towards 138.10. The MACD indicator supports this bearish outlook, showing continued downward momentum.
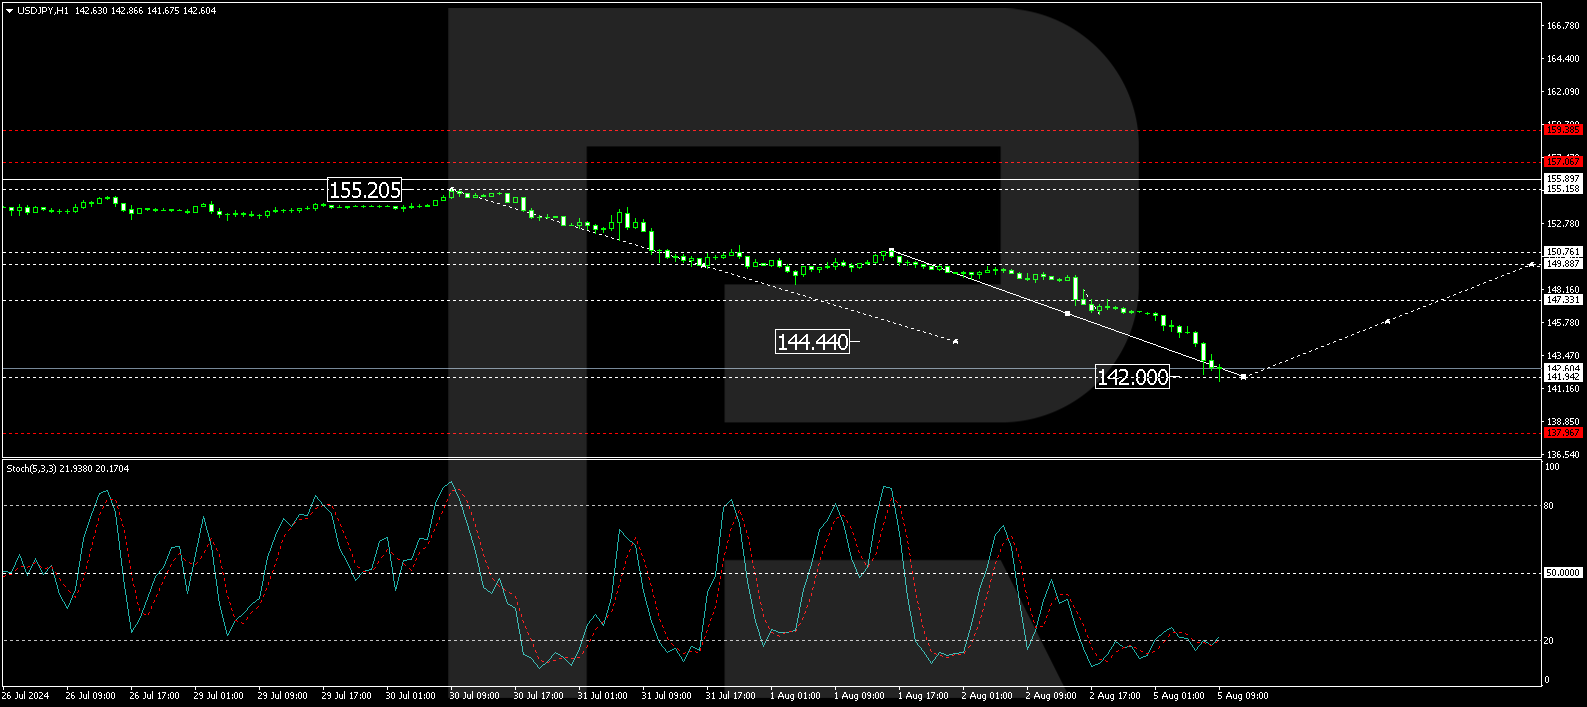
After reaching 142.00, a corrective phase to 147.33 may unfold, representing an intermediate target. Following this correction, a further decline to 144.66 could occur. This analysis aligns with the Stochastic oscillator, indicating a potential for an upward correction from oversold levels.
Disclaimer
Any forecasts contained herein are based on the author’s particular opinion. This analysis may not be treated as trading advice. RoboForex bears no responsibility for trading results based on trading recommendations and reviews contained herein.

- EUR/USD: Busy Week Ahead Aug 3, 2026
- Positive sentiment in the AI sector supported stock indices. Oil prices remain volatile Aug 3, 2026
- The Tech‑heavy NASDAQ Index jumped by more than 3.3%. The offshore yuan is trading at its highest level since 2023 Jul 31, 2026
- USD/JPY After Volatility: Multiple Events in One Day Jul 31, 2026
- The US indices sell off amid renewed US-Iran clashes. Oil jumps by 7% Jul 30, 2026
- USD/JPY Temporary in Equilibrium: Multiple Factors in Focus Jul 30, 2026
- GBP/USD at Month’s Lows: The Outlook Remains Weak Jul 29, 2026
- Crude oil falls below $80 per barrel. Australia sees inflation slowdown Jul 29, 2026
- The US Tech sector hit by sell‑off. Oil prices decline on renewed negotiations Jul 28, 2026
- Gold Declines, Focus on Fed and Falling Oil Prices Jul 28, 2026
