­

Archive for Energy – Page 19

Influential oil company scenarios for combating climate change don’t actually meet the Paris Agreement goals, our new analysis shows

By Robert Brecha, University of Dayton and Gaurav Ganti, Humboldt University of Berlin 

Several major oil companies, including BP and Shell, periodically publish scenarios forecasting the future of the energy sector. In recent years, they have added visions for how climate change might be addressed, including scenarios that they claim are consistent with the international Paris climate agreement.

These scenarios are hugely influential. They are used by companies making investment decisions and, importantly, by policymakers as a basis for their decisions.

But are they really compatible with the Paris Agreement?

Many of the future scenarios show continued reliance on fossil fuels. But data gaps and a lack of transparency can make it difficult to compare them with independent scientific assessments, such as the global reviews by the Intergovernmental Panel on Climate Change.

In a study published Aug. 16, 2022, in Nature Communications, our international team analyzed four of these scenarios and two others by the International Energy Agency using a new method we developed for comparing such energy scenarios head-to-head. We determined that five of them – including frequently cited scenarios from BP, Shell and Equinor – were not consistent with the Paris goals.

What the Paris Agreement expects

The 2015 Paris Agreement, signed by nearly all countries, sets out a few criteria to meet its objectives.

One is to ensure the global average temperature increase stays well below 2 degrees Celsius (3.6 F) compared to pre-industrial era levels, and to pursue efforts to keep warming under 1.5°C (2.7 F). The agreement also states that global emissions should peak as soon as possible and reach at least net zero greenhouse gas emissions in the second half of the century. Pathways that meet these objectives show that carbon dioxide emissions should fall even faster, reaching net zero by about 2050.

Scientific evidence shows that overshooting 1.5°C of warming, even temporarily, would have harmful consequences for the global climate. Those consequences are not necessarily reversible, and it’s unclear how well people, ecosystems and economies would be able to adapt.

How the scenarios perform

We have been working with the nonprofit science and policy research institute Climate Analytics to better understand the implications of the Paris Agreement for global and national decarbonization pathways – the paths countries can take to cut their greenhouse gas emissions. In particular, we have explored the roles that coal and natural gas can play as the world transitions away from fossil fuels.

When we analyzed the energy companies’ decarbonization scenarios, we found that BP’s, Shell’s and Equinor’s scenarios overshoot the 1.5°C limit of the Paris Agreement by a significant margin, with only BP’s having a greater than 50% chance of subsequently drawing temperatures down to 1.5°C by 2100.

These scenarios also showed higher near-term use of coal and long-term use of gas for electricity production than Paris-compatible scenarios, such as those assessed by the IPCC. Overall, the energy company scenarios also feature higher levels of carbon dioxide emissions than Paris-compatible scenarios.

Of the six scenarios, we determined that only the International Energy Agency’s Net Zero by 2050 scenario sketches out an energy future that is compatible with the 1.5°C Paris Agreement goal.

We found this scenario has a greater than 33% chance of keeping warming from ever exceeding 1.5°C, a 50% chance of having temperatures 1.5°C warmer or less in 2100, and a nearly 90% chance of keeping warming always below 2°C. This is in line with the criteria we use to assess Paris Agreement consistency, and also in line with the approach taken in the IPCC’s Special Report on 1.5°C, which highlights pathways with no or limited overshoot to be 1.5°C compatible.

Getting the right picture of decarbonization

When any group publishes future energy scenarios, it’s useful to have a transparent way to make an apples-to-apples comparison and evaluate the temperature implications. Most of the corporate scenarios, with the exception of Shell’s Sky 1.5 scenario, don’t extend beyond midcentury and focus on carbon dioxide without assessing other greenhouse gases.

Our method uses a transparent procedure to extend each pathway to 2100 and estimate emissions of other gases, which allows us to calculate the temperature outcomes of these scenarios using simple climate models.

Without a consistent basis for comparison, there is a risk that policymakers and businesses will have an inaccurate picture about the pathways available for decarbonizing economies.

Meeting the 1.5°C goal will be challenging. The planet has already warmed about 1.1°C since pre-industrial times, and people are suffering through deadly heat waves, droughts, wildfires and extreme storms linked to climate change. There is little room for false starts and dead-ends as countries transform their energy, agricultural and industrial systems on the way to net-zero greenhouse gas emissions.The Conversation

About the Author:

Robert Brecha, Professor of Sustainability, University of Dayton and Gaurav Ganti, Ph.D. Student in Geography, Humboldt University of Berlin

This article is republished from The Conversation under a Creative Commons license. Read the original article.

Next US energy boom could be wind power in the Gulf of Mexico

By Michael E. Webber, University of Texas at Austin and Hugh Daigle, University of Texas at Austin 

With passage of the Inflation Reduction Act, which contains US$370 billion for climate and energy programs, policy experts are forecasting a big expansion in clean electricity generation. One source that’s poised for growth is offshore wind power.

Today the U.S. has just two operating offshore wind farms, off of Rhode Island and North Carolina, with a combined generating capacity of 42 megawatts. For comparison, the new Traverse Wind Energy Center in Oklahoma has 356 turbines and a 998-megawatt generating capacity. But many more projects are in development, mostly along the Atlantic coast.

The Biden administration has identified two zones for offshore wind power development in the Gulf of Mexico, which up until now has been firmly identified with oil and gas production. As part of his climate strategy, President Joe Biden has set a goal for the deployment of 30 gigawatts (30,000 megawatts) of offshore wind generating capacity by 2030 – enough to power 10 million homes with carbon-free electricity.

As energy researchers based in Texas, we see this as an exciting new phase in our nation’s ongoing clean power transition. In our view, offshore wind in the Gulf of Mexico presents a unique opportunity for a geographic region with a strong energy workforce and infrastructure to help meet society’s need for reliable low-carbon energy.

Why go offshore?

Wind power on land has seen remarkable growth in the U.S. over the last 15 years, including in Texas, the top wind-generating state in the nation. Wind power’s comparative ease of permitting and siting, affordable installation costs, abundant resources, free fuel and low marginal operating costs have reduced electricity costs for consumers. And wind power avoids significant amounts of air pollution, greenhouse gas emissions and water demand for cooling – impacts associated with power plants that burn coal, oil or natural gas.

But onshore wind has downsides. Winds often are weakest in the hottest hours of summer, when air conditioners are working hard to keep people cool. And many of the best wind energy zones are far from electricity demand centers. For example, most wind farms here in the Lone Star State are located on the high plains in west Texas, and were only built after the state spent billions of dollars on long-distance transmission lines to move their power to where it’s needed.

U.S. map showing wind speeds onshore and offshore
Many of the best U.S. land-based wind generating areas (dark blue zones) are far from coastal population centers, but those cities could be served by offshore wind farms.
NREL

Solar power and batteries can solve some of these problems. But generating wind offshore also offers many benefits.

Just as onshore wind lowered electricity costs for consumers, offshore wind is expected to do the same.

More than half of the U.S. population lives within 50 miles of a coast, so offshore wind sites are close to electricity demand centers. This is especially true in the Gulf of Mexico, which is home to major cities such as Houston and New Orleans and a large concentration of petrochemical facilities and ports. Power companies can use subsea cables to bring wind energy to industrial facilities, instead of building hundreds of miles of overhead wires, with associated right-of-way and land access disputes.

Importantly, offshore wind complements onshore wind. As air speeds slow in west Texas on a hot summer afternoon, coastal winds pick up, helping to meet summer peak demand and improving grid reliability.

The offshore wind market is already robust globally, but until now has been practically non-existent in the U.S. Abundant land here has spurred growth of onshore wind, but inhibited a rush to the water.

That’s changing with tighter setback rules in leading wind states like Iowa that limit how close to homes turbines can be placed, which are driving up construction costs and limiting the availability of acceptable sites. Transmission capacity limits on the U.S. power grid are also making it harder to move wind-generated electrons to market.

Constructing offshore wind farms requires specialized ships, port facilities and labor. Many of these resources are already available along the U.S. Gulf Coast, a major offshore oil and gas production region.

Welcome to the Gulf, y’all

Thanks to these development trends, plus measures in the climate bill that increase support for offshore wind, it looks as though a U.S. offshore wind industry is finally ready for prime time. We see the Gulf of Mexico as an especially attractive place to do business.

Compared to cold and bitter conditions in regions like the North Sea, the North Atlantic and coastal Japan, where offshore wind generation is already happening, the Gulf’s shallower water depths, warmer temperatures and calmer waves are relatively easy to manage. Water depths up to 160 feet – currently the maximum depth for fixed-bottom wind turbines – extend nearly 90 miles off the coasts of southeast Texas and southern Louisiana, compared with only about 40 miles off Nantucket and Martha’s Vineyard in the Northeast.

The Gulf’s seafloor topography features a more even and gentle slope than areas already under consideration for development off the coast of Virginia. This means that fixed-bottom wind turbines can be used in more places, rather than floating systems, which reduces complexity.

Importantly, the Gulf Coast has a robust offshore industry that was established to serve oil and gas producers, with many specialized companies offering services such as underwater welding, platform manufacturing and helicopter and boat services to get people and equipment to sea. Gulf of Mexico oil and gas production supported an estimated 345,000 jobs in 2019.

Wind farms in the Gulf can leverage existing infrastructure. There are nearly 1,200 miles of existing subsea power cables that could transfer wind energy to shore. Wind generation could also be incorporated into a larger energy system that includes green hydrogen generation and storage and carbon sequestration.

A boost for workers and vulnerable communities

We also believe that offshore wind energy can help advance environmental justice goals. Generating more clean, carbon-free electricity will help to displace refineries and plants that process fossil fuels and generate power from them. These facilities disproportionately harm the health of communities of color in cities like Houston and across the U.S..

Wind power development in the Gulf also offers an opportunity for a smooth labor transition as the U.S. gradually reduces its reliance on fossil fuels. Louisiana is already moving to set rules for offshore wind in state waters, and is seeking federal funding together with Arkansas and Oklahoma for a regional clean hydrogen hub.

Green means go

Permitting for energy projects is notoriously slow at the federal level, and wind energy projects in federal waters may require multi-year lead times. But projects in state waters – extending up to three nautical miles from shore in most areas, and nine miles from shore in Texas – could proceed more rapidly.

Much depends on whether energy states like Texas and Louisiana see opportunities to extend their reputations as energy leaders into offshore wind. As we see it, an offshore wind boom in the Gulf would be good for the region, the nation and the world’s climate.The Conversation

About the Author:

Michael E. Webber, Josey Centennial Professor of Energy Resources, University of Texas at Austin and Hugh Daigle, Associate Professor of Petroleum and Geosystems Engineering, University of Texas at Austin

This article is republished from The Conversation under a Creative Commons license. Read the original article.

Crude Oil is Depressed Again

By RoboForex Analytical Department

The commodity market remains under bearish control on Monday; Brent is falling to reach $95.45.

Oil is being pressured by the expensive “greenback”, as well as public concerns about a global recession around the world. Today’s economic slump might reduce interest in energies, having a negative impact on prices.

Investors are still waiting for the news on the nuclear deal between the US and Iran. Of course, no rash decisions are expected, but any positive progress would have a positive influence on market sentiment.

According to the CFTC, last week, big-time investors, including hedge funds, decreased their long positions to 290,388 contracts. It’s the lowest number in more than two years. The total long position in futures and options on Brent and WTI dropped to 9-year lows.

On the H4 chart, having completed the first ascending wave at 98.20, Brent is expected to correct down to 93.60 and may later form one more ascending structure with the short-term target at 106.00. After that, the instrument may start another correction towards 99.60 and then resume trading upwards to reach 107.20. From the technical point of view, this scenario is confirmed by the MACD Oscillator: its signal line is moving close to 0 and may yet continue falling. Later, it may grow to break 0 and continue moving to reach new highs.

As we can see in the H1 chart, after finishing the ascending structure at 98.20 and breaking the ascending channel at 95.90, Brent is consolidating around the latter level. Possibly, the asset may extend this correction down to 93.60 and then start another growth with the target at 99.60. And it’s just half of the third ascending wave. From the technical point of view, this idea is confirmed by the Stochastic Oscillator: its signal line is moving near the lows below 20. Later, the line may grow to rebound from 50 and resume falling to return to 20. After that, it may reverse and move to reach new highs.

Disclaimer

Any forecasts contained herein are based on the author’s particular opinion. This analysis may not be treated as trading advice. RoboForex bears no responsibility for trading results based on trading recommendations and reviews contained herein.


Chart Spotlight: Canadian Solar (CSIQ)

By Ino.com

Over the last few weeks, I highlighted a few opportunities with Chart Spotlight.

  • On July 13, for example, I highlighted Generac Holdings (GNRC), as it traded around $212. It’s now up to $265.50.
  • On July 26, I highlighted Albemarle (ALB), as it traded at $224. It’s now up to $280.15.
  • On August 3, I highlighted Marathon Digital Holdings (MARA), as it traded around $13. It’s now up to $15.26, and could still move higher with Bitcoin.
  • On August 5, I spoke about Tellurian (TELL), as it traded at $3.15. It’s now at $4.35.

With the help of the screeners at MarketClub, that’s not bad at all.

Today, I’m taking a look at solar stocks, like Canadian Solar (CSIQ), which MarketClub is rating with a strong +100. Not only is this an indication of a strong long-term trend, it’s also telling us the intermediate and short-term trend is up for CSIQ, as well.

In fact according to the Chart Analysis Score, at a +100, CSIQ is in a strong uptrend that is likely to continue. With short-term, intermediate, and long-term bullish momentum, CSIQ continues to climb. MarketClub’s most recent green monthly Trade Triangle occurred on August 5 at $38.18.

CSIQ Chart With Trade Triangles

Source: MarketClub


Why is Canadian Solar running like this?

There are a few reasons.

For one, solar stocks are riding the momentum behind the $370 billion clean energy bill.

According to U.S. Senator Joe Manchin’s site, “The Inflation Reduction Act of 2022 invests in the technologies needed for all fuel types – from hydrogen, nuclear, renewables, fossil fuels and energy storage – to be produced and used in the cleanest way possible. It is truly all of the above, which means this bill does not arbitrarily shut off our abundant fossil fuels. It invests heavily in technologies to help us reduce our domestic methane and carbon emissions and also helps decarbonize around the world as we displace dirtier products.”

Two, that bill includes a 10-year extension on a 30% tax credit for solar projects. It was supposed to expire by next year.

Plus, according to DLA Piper, “For facilities beginning construction before January 1, 2025, the bill will extend the ITC for up to 30 percent of the cost of installed equipment for ten years and will then step down to 26 percent in 2033 and 22 percent in 2034. For projects beginning construction after 2019 that are placed in service before January 1, 2022, the ITC would be set at 26 percent.”

Three, solar stocks, like Canadian Solar (CSIQ) are producing solid earnings and guidance.

For its second quarter, the company saw sales growth of 62% to $2.31 billion. That was higher than expectations for $2.23 billion. EPS of $1.07 was also higher than expectations for 33 cents. Then, the company hiked its 2022 sales forecast to $7.5 billion to $8 billion, which is higher than the initial forecast for a range of $7 billion to $7.5 billion.

Ian Cooper
INO.com Contributor

The above analysis of Canadian Solar (CSIQ) was provided by financial writer Ian Cooper. Ian Cooper is not a Registered Investment Advisor or Financial Planner. This writing is for informational purposes only. It does not constitute an offer to sell, a solicitation to buy, or a recommendation regarding any securities transaction. The information contained in this writing should not be construed as financial or investment advice on any subject matter. Ian Cooper expressly disclaims all liability in respect to actions taken based on any or all of the information on this writing.

By Ino.com – See our Trader Blog, INO TV Free & Market Analysis Alerts

Source: Chart Spotlight: Canadian Solar (CSIQ)

Energy Speculators push Heating Oil bets higher for 6th week to 42-week high

By InvestMacro | COT | Data Tables | COT Leaders | Downloads | COT Newsletter

Here are the latest charts and statistics for the Commitment of Traders (COT) data published by the Commodities Futures Trading Commission (CFTC).

The latest COT data (Week 33) is updated through Tuesday August 16th and shows a quick view of how large traders (for-profit speculators and commercial entities) were positioned in the futures markets.

Weekly Speculator Changes: Week 33 – Heating Oil bets rise for 6th week

COT energy market speculator bets were higher this week as four out of the six energy markets we cover had higher positioning this week while two markets had lower contracts.

Leading the gains for energy markets was Natural Gas (4,508 contracts) with WTI Crude Oil (4,289 contracts), Gasoline (2,163 contracts) and Heating Oil (462 contracts) also showing positive weeks.

The energy markets leading the declines in speculator bets this week was Brent Crude Oil (-1,801 contracts) with the Bloomberg Commodity Index (-231 contracts) also registering lower bets on the week.

Heating Oil speculator contracts edged higher this week and rose for a sixth straight week. Speculator positions are now in bullish territory for the twelfth week after turning from bearish to bullish on May 31st. These increases have pushed the Heating Oil speculator standing to just about +25,000 contracts and to the highest level since October 26th of 2021, a span of forty-two weeks.


Data Snapshot of Commodity Market Traders | Columns Legend
Aug-16-2022
OI
OI-Index
Spec-Net
Spec-Index
Com-Net
COM-Index
Smalls-Net
Smalls-Index
WTI Crude1,557,3490214,9401-239,29110024,35148
Corn1,316,4621220,12958-166,31848-53,81112
Natural Gas983,4605-120,9114282,8625738,04970
Sugar737,535749,97047-61,8375611,86723
Soybeans595,095583,18339-51,65068-31,53318
Gold453,9600141,16419-153,7098412,5454
Wheat313,23711-1,908177,44870-5,54082
Heating Oil296,9873424,92679-40,0222915,09651
Coffee190,302033,47168-35,318371,84716
Copper183,50017-28,2202228,93279-71221
Brent176,90221-36,0125134,290501,72233
Silver144,314113,50810-12,451908,94312
Platinum57,254172,94012-6,361903,42110
Palladium7,9517-1,599141,536836348


Strength Scores

Strength Scores (a normalized measure of Speculator positions over a 3-Year range, from 0 to 100 where above 80 is extreme bullish and below 20 is extreme bearish) show that Heating Oil (79.1 percent) leads the energy currently and is up a bit from last week’s score of 78.4 percent. The Bloomberg Commodity Index (58.2 percent) and Brent Crude Oil (50.8 percent) come in as the next highest energy markets in strength scores. On the downside, the WTI Crude Oil (1.1 percent) and Gasoline (19.7 percent) come in at the lowest strength levels and are both in bearish extreme levels (below 20 percent).


Strength Statistics:
WTI Crude Oil (1.1 percent) vs WTI Crude Oil previous week (0.0 percent)
Brent Crude Oil (50.8 percent) vs Brent Crude Oil previous week (53.8 percent)
Natural Gas (42.3 percent) vs Natural Gas previous week (40.9 percent)
Gasoline (19.7 percent) vs Gasoline previous week (17.5 percent)
Heating Oil (79.1 percent) vs Heating Oil previous week (78.4 percent)
Bloomberg Commodity Index (58.2 percent) vs Bloomberg Commodity Index previous week (59.1 percent)

Strength Trends

Strength Score Trends (or move index, calculates the 6-week changes in strength scores) show that Heating Oil (27.1 percent) is getting the most love from speculators lately and leads the past six weeks trends for energy. Gasoline (19.7 percent), Brent Crude Oil (4.2 percent) and Natural Gas (2.9 percent) fill out the other positive movers in the latest trends data. The Bloomberg Commodity Index (-20.7 percent) leads the downside trend scores currently while the next market with lower trend scores is WTI Crude Oil (-17.3 percent).


Strength Trend Statistics:
WTI Crude Oil (-17.3 percent) vs WTI Crude Oil previous week (-23.5 percent)
Brent Crude Oil (4.2 percent) vs Brent Crude Oil previous week (14.2 percent)
Natural Gas (2.9 percent) vs Natural Gas previous week (1.2 percent)
Gasoline (19.7 percent) vs Gasoline previous week (13.4 percent)
Heating Oil (27.1 percent) vs Heating Oil previous week (24.9 percent)
Bloomberg Commodity Index (-20.7 percent) vs Bloomberg Commodity Index previous week (-20.3 percent)


Individual Markets:

WTI Crude Oil Futures:

WTI Crude Oil Futures COT ChartThe WTI Crude Oil Futures large speculator standing this week reached a net position of 214,940 contracts in the data reported through Tuesday. This was a weekly increase of 4,289 contracts from the previous week which had a total of 210,651 net contracts.

This week’s current strength score (the trader positioning range over the past three years, measured from 0 to 100) shows the speculators are currently Bearish-Extreme with a score of 1.1 percent. The commercials are Bullish-Extreme with a score of 99.7 percent and the small traders (not shown in chart) are Bearish with a score of 48.3 percent.

WTI Crude Oil Futures StatisticsSPECULATORSCOMMERCIALSSMALL TRADERS
– Percent of Open Interest Longs:22.341.05.1
– Percent of Open Interest Shorts:8.556.43.5
– Net Position:214,940-239,29124,351
– Gross Longs:346,865638,97178,715
– Gross Shorts:131,925878,26254,364
– Long to Short Ratio:2.6 to 10.7 to 11.4 to 1
NET POSITION TREND:
– Strength Index Score (3 Year Range Pct):1.199.748.3
– Strength Index Reading (3 Year Range):Bearish-ExtremeBullish-ExtremeBearish
NET POSITION MOVEMENT INDEX:
– 6-Week Change in Strength Index:-17.317.50.9


Brent Crude Oil Futures:

Brent Last Day Crude Oil Futures COT ChartThe Brent Crude Oil Futures large speculator standing this week reached a net position of -36,012 contracts in the data reported through Tuesday. This was a weekly lowering of -1,801 contracts from the previous week which had a total of -34,211 net contracts.

This week’s current strength score (the trader positioning range over the past three years, measured from 0 to 100) shows the speculators are currently Bullish with a score of 50.8 percent. The commercials are Bullish with a score of 50.3 percent and the small traders (not shown in chart) are Bearish with a score of 32.5 percent.

Brent Crude Oil Futures StatisticsSPECULATORSCOMMERCIALSSMALL TRADERS
– Percent of Open Interest Longs:18.750.84.1
– Percent of Open Interest Shorts:39.031.43.1
– Net Position:-36,01234,2901,722
– Gross Longs:33,01789,8287,241
– Gross Shorts:69,02955,5385,519
– Long to Short Ratio:0.5 to 11.6 to 11.3 to 1
NET POSITION TREND:
– Strength Index Score (3 Year Range Pct):50.850.332.5
– Strength Index Reading (3 Year Range):BullishBullishBearish
NET POSITION MOVEMENT INDEX:
– 6-Week Change in Strength Index:4.2-5.07.0


Natural Gas Futures:

Natural Gas Futures COT ChartThe Natural Gas Futures large speculator standing this week reached a net position of -120,911 contracts in the data reported through Tuesday. This was a weekly lift of 4,508 contracts from the previous week which had a total of -125,419 net contracts.

This week’s current strength score (the trader positioning range over the past three years, measured from 0 to 100) shows the speculators are currently Bearish with a score of 42.3 percent. The commercials are Bullish with a score of 57.0 percent and the small traders (not shown in chart) are Bullish with a score of 70.2 percent.

Natural Gas Futures StatisticsSPECULATORSCOMMERCIALSSMALL TRADERS
– Percent of Open Interest Longs:17.342.26.9
– Percent of Open Interest Shorts:29.633.83.0
– Net Position:-120,91182,86238,049
– Gross Longs:170,133415,17167,826
– Gross Shorts:291,044332,30929,777
– Long to Short Ratio:0.6 to 11.2 to 12.3 to 1
NET POSITION TREND:
– Strength Index Score (3 Year Range Pct):42.357.070.2
– Strength Index Reading (3 Year Range):BearishBullishBullish
NET POSITION MOVEMENT INDEX:
– 6-Week Change in Strength Index:2.9-2.9-1.2


Gasoline Blendstock Futures:

RBOB Gasoline Energy Futures COT ChartThe Gasoline Blendstock Futures large speculator standing this week reached a net position of 47,669 contracts in the data reported through Tuesday. This was a weekly advance of 2,163 contracts from the previous week which had a total of 45,506 net contracts.

This week’s current strength score (the trader positioning range over the past three years, measured from 0 to 100) shows the speculators are currently Bearish-Extreme with a score of 19.7 percent. The commercials are Bullish-Extreme with a score of 80.9 percent and the small traders (not shown in chart) are Bearish with a score of 45.8 percent.

Nasdaq Mini Futures StatisticsSPECULATORSCOMMERCIALSSMALL TRADERS
– Percent of Open Interest Longs:31.348.17.9
– Percent of Open Interest Shorts:13.068.36.0
– Net Position:47,669-52,6304,961
– Gross Longs:81,394124,91920,499
– Gross Shorts:33,725177,54915,538
– Long to Short Ratio:2.4 to 10.7 to 11.3 to 1
NET POSITION TREND:
– Strength Index Score (3 Year Range Pct):19.780.945.8
– Strength Index Reading (3 Year Range):Bearish-ExtremeBullish-ExtremeBearish
NET POSITION MOVEMENT INDEX:
– 6-Week Change in Strength Index:19.7-19.11.9


#2 Heating Oil NY-Harbor Futures:

NY Harbor Heating Oil Energy Futures COT ChartThe #2 Heating Oil NY-Harbor Futures large speculator standing this week reached a net position of 24,926 contracts in the data reported through Tuesday. This was a weekly rise of 462 contracts from the previous week which had a total of 24,464 net contracts.

This week’s current strength score (the trader positioning range over the past three years, measured from 0 to 100) shows the speculators are currently Bullish with a score of 79.1 percent. The commercials are Bearish with a score of 28.6 percent and the small traders (not shown in chart) are Bullish with a score of 50.6 percent.

Heating Oil Futures StatisticsSPECULATORSCOMMERCIALSSMALL TRADERS
– Percent of Open Interest Longs:15.552.113.8
– Percent of Open Interest Shorts:7.165.68.7
– Net Position:24,926-40,02215,096
– Gross Longs:46,048154,77241,070
– Gross Shorts:21,122194,79425,974
– Long to Short Ratio:2.2 to 10.8 to 11.6 to 1
NET POSITION TREND:
– Strength Index Score (3 Year Range Pct):79.128.650.6
– Strength Index Reading (3 Year Range):BullishBearishBullish
NET POSITION MOVEMENT INDEX:
– 6-Week Change in Strength Index:27.1-18.4-4.1


Bloomberg Commodity Index Futures:

Bloomberg Commodity Index Futures COT ChartThe Bloomberg Commodity Index Futures large speculator standing this week reached a net position of -12,887 contracts in the data reported through Tuesday. This was a weekly lowering of -231 contracts from the previous week which had a total of -12,656 net contracts.

This week’s current strength score (the trader positioning range over the past three years, measured from 0 to 100) shows the speculators are currently Bullish with a score of 58.2 percent. The commercials are Bearish with a score of 41.7 percent and the small traders (not shown in chart) are Bearish with a score of 21.0 percent.

Bloomberg Index Futures StatisticsSPECULATORSCOMMERCIALSSMALL TRADERS
– Percent of Open Interest Longs:23.075.00.5
– Percent of Open Interest Shorts:42.356.20.1
– Net Position:-12,88712,595292
– Gross Longs:15,33050,098339
– Gross Shorts:28,21737,50347
– Long to Short Ratio:0.5 to 11.3 to 17.2 to 1
NET POSITION TREND:
– Strength Index Score (3 Year Range Pct):58.241.721.0
– Strength Index Reading (3 Year Range):BullishBearishBearish
NET POSITION MOVEMENT INDEX:
– 6-Week Change in Strength Index:-20.720.61.9


Article By InvestMacroReceive our weekly COT Reports by Email

*COT Report: The COT data, released weekly to the public each Friday, is updated through the most recent Tuesday (data is 3 days old) and shows a quick view of how large speculators or non-commercials (for-profit traders) were positioned in the futures markets.

The CFTC categorizes trader positions according to commercial hedgers (traders who use futures contracts for hedging as part of the business), non-commercials (large traders who speculate to realize trading profits) and nonreportable traders (usually small traders/speculators) as well as their open interest (contracts open in the market at time of reporting).See CFTC criteria here.

Oil prices are declining. Investors buy Asian shares on expectations of stimulus from the People’s Bank of China

By JustForex

US stock indexes were trading up yesterday. By Monday’s close of trading, the Dow Jones (US30) gained 0.45%, and the S&P 500 (US500) added 0.40%. The NASDAQ Technology Index (US100) jumped by 0.62%. Investors are still focused on signals of weakening inflation in the US and an improvement in the country’s economic assessment. However, the Fed is only 60-70% of the way through its interest rate hike cycle and will begin trimming the balance sheet starting in September.

The focus for traders this week remains the FOMC minutes, data on US industrial production and retail sales for July, and quarterly reports from US retailers Walmart Inc, Target Corp, and Home Depot Inc, which should show how the US retail sector and consumers are holding up amid high inflation.

Stock markets in Europe were mostly up yesterday. Germany’s DAX (DE30) gained 0.74% on Monday, France’s CAC 40 (FR40) added 0.25%, Spain’s IBEX 35 Index (ES35) increased by 0.32%, Britain’s FTSE 100 (UK100) closed up by 0.11%.

Europe is facing rising energy bills this year, driven by global increases in wholesale electricity and gas prices. European gas prices have more than tripled this year, partly after supply disruptions related to Russia’s invasion of Ukraine.

Oil prices hit six-month lows Monday after China released weak July data on industrial production and retail sales. As a result, the People’s Bank of China poured 400 billion yuan (nearly $60 billion) into the financial system to bolster the Chinese economy to revive demand in an economy slowed by Beijing’s ongoing Covid restrictions.

Iran is due this week to finally answer the remaining three outstanding questions on the nuclear deal. If Tehran reaches an agreement with Europe and the United States, oil supplies may rise sharply soon, putting even more downward pressure on oil quotes.

The head of Saudi Aramco, the world’s largest oil exporter, unexpectedly said yesterday that the company is ready to increase production to 12 million barrels per day despite signs of a global economic slowdown. This came as a surprise to analysts, especially after the recent OPEC+ meeting, as the state-owned company rarely makes such a comment without permission from Energy Minister Abdulaziz bin Salman or his half-brother, Crown Prince Mohammed bin Salman. In the United States, the peak summer driving season is winding down, and fuel demand is expected to decline further in the next two weeks.

Asian markets traded flat yesterday. Japan’s Nikkei 225 (JP225) gained 1.14%, Hong Kong’s Hang Seng (HK50) decreased by 0.67%, and Australia’s S&P/ASX 200 (AU200) was up by 0.45%. At the market’s opening, Asian shares started to show gains on expectations that China would deploy more stimulus measures to improve economic growth.

ING Bank cut its 2022 GDP growth forecast for China to 4%, down from the previous forecast of 4.4%, and said a further downgrade is possible. The Chinese yuan fell the most among Asian currencies on Tuesday, hitting a three-month low, as the central bank’s unexpected rate cut raised fears of a slowdown in economic growth.

S&P 500 (F) (US500) 4,297.14 +16.99 (+0.40%)

Dow Jones (US30) 33,912.44 +151.39 (+0.45%)

DAX (DE40) 13,816.61 +20.76 (+0.15%)

FTSE 100 (UK100) 7,509.15 +8.26 (+0.11%)

USD Index 106.51 +0.88 (+0.83%)

Important events for today:
  • – Australia RBA Meeting Minutes at 04:30 (GMT+3);
  • – UK Average Earnings Index (m/m) at 09:00 (GMT+3);
  • – UK Claimant Count Change (m/m) at 09:00 (GMT+3);
  • – UK Unemployment Rate (m/m) at 09:00 (GMT+3);
  • – Eurozone German ZEW Economic Sentiment (m/m) at 12:00 (GMT+3);
  • – Eurozone ZEW Economic Sentiment (m/m) at 12:00 (GMT+3);
  • – US Building Permits (m/m) at 15:30 (GMT+3);
  • – Canada Consumer Price Index (m/m) at 15:30 (GMT+3);
  • – US Industrial Production (m/m) at 16:15 (GMT+3).

By JustForex


This article reflects a personal opinion and should not be interpreted as an investment advice, and/or offer, and/or a persistent request for carrying out financial transactions, and/or a guarantee, and/or a forecast of future events.

Energy crisis: why French households are largely protected from soaring costs while British families struggle

By Renaud Foucart, Lancaster University 

British households are bracing for a winter of massive energy price increases. The average annual bill is forecast to rise above £4,000, which is more than three times what Britons were paying just 12 months ago.

French households, meanwhile, will barely see their costs increase. Their government has frozen gas prices and limited the increase of the regulated price of electricity to an annual 4%. The total impact of the cost of living squeeze from higher energy prices this year will remain well below 5% of consumption for all French households. For the poorest 20% of UK households, it could be more than 15%.

The difference between two neighbouring countries with interconnected electricity grids is staggering. As part of my ongoing research into market regulation and the systems used to allocate commodities such as electricity, I look at how economic models can help us to understand policy problems. Most recently, I’ve been researching the French power market and comparing it to other models such as those of the UK.

By reflecting the actual market price of electricity generation, the Great Britain’s model (Northern Ireland operates on a different system) forces consumers to reduce consumption and encourages investment in production. In contrast, the French approach uses a mixture of subsidies by the government and a public energy company, which costs taxpayers billions and postpones big decisions on energy efficiency and investment in future production.

But while the GB power market is certainly more efficient when it comes to energy consumption and production, the upcoming crisis shows it is far from perfect. To ensure all homes are heated this winter, the government faces a bold choice: sending billions in cash to households or learning some lessons from the neighbouring French market – even if it means sacrificing some efficiency.

Great Britain: free market, marginal pricing

UK energy regulator Ofgem determines the maximum price an energy provider can charge households for the gas and electricity they use. This price cap, designed to protect consumers from unfair rises, should also enable suppliers to buy energy on the wholesale market at cheaper prices to satisfy contracts with consumers and still make a profit.

Indeed, the wholesale price of energy is the main factor Ofgem uses to calculate the cap. This price varies depending on the type of power being purchased.

Under what’s called a marginal price model, cheaper sources such as renewables and nuclear are used to satisfy demand first. More expensive forms of power such as natural gas are brought in as demand increases, but demand is nearly always high enough to encourage gas generation.

And in free markets such as this, the most expensive unit consumed determines the price everyone pays. Since Russia invaded Ukraine in February 2022, the price of gas in the GB market has soared to more than six times prices a year ago.

Unfortunately, the price cap model has meant that recent soaring wholesale gas prices have affected both consumers and suppliers. While oil and gas producers report record profits due to rapidly rising prices, dozens of suppliers have gone bust paying these prices.

To reduce the risk of further supplier bankruptcies, Ofgem will now update the cap on a quarterly basis to enable suppliers to raise retail prices more in line with wholesale prices.

But recent rises have affected consumers. In the past, retail rates could be fixed well below the cap, but increased gas costs have pushed power prices up so much that these deals have disappeared.

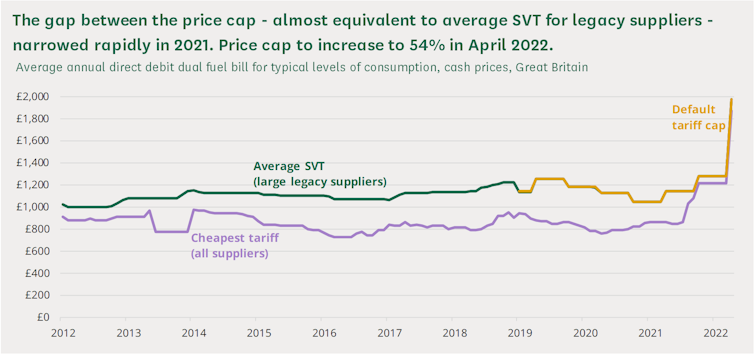
Average annual fuel bills, 2012-2022

Line graph showing different types of energy bills increasing to meet the UK price cap set by Ofgem
The gap between GB energy bills and the price cap has narrowed in 2022.
Ofgem Retail Market Indicators, House of Commons research briefing, August 2022

Capping wholesale prices is not a solution. To avoid blackouts, energy companies must either produce or import every single unit demanded by their consumers. If producers cannot recoup the cost of production of the most expensive unit of energy, they will simply not deliver it.

High energy prices and the hope of future profits encourage investment in production. The UK, for instance, is consistently ranked as one of the most attractive countries for renewable energy development. Even so, the neighbouring French market is currently doing much better to protect its consumers.

France: nationalised production, price subsidies

On paper, the French system is also market-based: energy producers sell electricity to the firms that directly supply consumers, limited by a price cap. The big difference from Britain is that the French government forces majority state-owned monopoly producer EDF to offer more than a quarter of its production to suppliers at a huge discount on the current wholesale price.

Historically, this cheap energy comes from an ageing fleet of nuclear power plants. But recent issues have forced EDF to buy back some of the electricity it had already sold into the market at more expensive wholesale prices to resell to energy suppliers for less to satisfy its contracts with them.

Last January, the French government also asked EDF to increase the quantity of discounted electricity it offers to help French households cope with rising energy prices. Together with cuts in fuel taxes, this will ensure the French regulated price barely increases this year.

The French system is far from perfect, however. The significant cost to taxpayers is not transparent and electricity prices do not reflect the cost of the most expensive unit. The absence of market incentives has also prompted the government to re-nationalise EDF to ensure future investment in renewables and next generation nuclear power plants.

As a shorter-term measure to protect consumers, the country has also introduced restrictions on energy use, particularly since it expects wholesale prices way above what GB will pay due to nuclear production uncertainty. But at least French families know their houses will be warm enough this winter.

To ensure the same for its households, the British might consider becoming a little more French by subsidising electricity. Both of the Conservative Party leadership contenders have hinted they are willing to move in that direction by cutting VAT and green levies, but the price impact would be small. Much more subsidies would be needed to protect consumers.

Up until now, an alternative strategy has been to offer unconditional cash transfers, such as rebates on council tax and energy bills. Pursuing this strategy over the winter would preserve the efficiency of the GB market, but would be politically difficult and expensive. The IMF estimates the cash needed to compensate the 40% poorer household to be around 1.5% of GDP or more than £30 billion.

The GB power market is generally an ideal way to allocate consumption and production of electricity. But efficiency is not everything. A rich country that cannot warm its homes has failed its citizens and so further action is needed to ensure this does not happen this winter.The Conversation

About the Author:

Renaud Foucart, Senior Lecturer in Economics, Lancaster University Management School, Lancaster University

This article is republished from The Conversation under a Creative Commons license. Read the original article.


COT Week 32 Charts: Energy Speculators bets fall led by WTI Crude Oil, Gasoline & Brent

By InvestMacro | COT | Data Tables | COT Leaders | Downloads | COT Newsletter

Here are the latest charts and statistics for the Commitment of Traders (COT) data published by the Commodities Futures Trading Commission (CFTC).

The latest COT data is updated through Tuesday August 9nd and shows a quick view of how large traders (for-profit speculators and commercial entities) were positioned in the futures markets.

Weekly Speculator Changes

COT energy market speculator bets were lower this week as just one out of the six energy markets we cover had higher positioning this week while the other five markets had lower contracts.

Leading the gains for energy markets was Heating Oil (2,396 contracts) which was the only market this week showing increasing speculator bets.

The energy markets leading the declines in speculator bets this week were WTI Crude Oil (-43,101 contracts) and Gasoline (-5,312 contracts) with Brent Crude Oil (-1,429 contracts), Natural Gas (-446 contracts) and the Bloomberg Commodity Index (-33 contracts) also registering lower bets on the week.


Data Snapshot of Commodity Market Traders | Columns Legend
Aug-09-2022
OI
OI-Index
Spec-Net
Spec-Index
Com-Net
COM-Index
Smalls-Net
Smalls-Index
WTI Crude1,570,1310210,6510-238,07310027,42253
Corn1,317,9131210,78657-160,65449-50,13214
Natural Gas969,5823-125,4194186,7345838,68572
Sugar765,6691226,06542-30,608624,54313
Soybeans583,208288,90141-62,97165-25,93027
Gold453,5400142,85119-154,5548311,7031
Wheat320,76714-3,426159,93974-6,51377
Heating Oil283,7492924,46478-36,4723212,00840
Coffee209,4461330,45365-31,268418157
Copper187,98821-28,4772227,7007877730
Brent175,89621-34,2115432,411471,80034
Silver141,09382,8799-13,5748910,69521
Platinum62,782268469-4,055933,2097
Palladium7,6196-1,970122,04486-7440


Strength Scores

Strength Scores (a normalized measure of Speculator positions over a 3-Year range, from 0 to 100 where above 80 is extreme bullish and below 20 is extreme bearish) showed that Heating Oil (78.4 percent) remains the leader in energy market strength scores. The Bloomberg Commodity Index (59.1 percent) and Brent Crude Oil (53.8 percent) come in as the next highest energy markets in strength scores and both are above 50 percent or the midpoint of their 3-year ranges. On the downside, WTI Crude Oil (0.0 percent) comes in at the lowest strength level currently and is at the bottom of its 3-year range. Joining WTI in a bearish extreme position (below 20 percent) is Gasoline at a 17.5 percent score.


Strength Statistics:
WTI Crude Oil (0.0 percent) vs WTI Crude Oil previous week (11.4 percent)
Brent Crude Oil (53.8 percent) vs Brent Crude Oil previous week (56.2 percent)
Natural Gas (40.9 percent) vs Natural Gas previous week (41.1 percent)
Gasoline (17.5 percent) vs Gasoline previous week (22.9 percent)
Heating Oil (78.4 percent) vs Heating Oil previous week (74.9 percent)
Bloomberg Commodity Index (59.1 percent) vs Bloomberg Commodity Index previous week (59.2 percent)

Strength Trends

Strength Score Trends (or move index, calculates the 6-week changes in strength scores) show that Heating Oil (24.9 percent) leads the past six weeks trends for energy this week. Brent Crude Oil (14.2 percent) and Gasoline (13.4 percent) fill out the next top movers in the latest trends data. WTI Crude Oil (-23.5 percent) leads the downside trend scores currently while the next market with lower trend scores is the Bloomberg Commodity Index (-20.3 percent).


Strength Trend Statistics:
WTI Crude Oil (-23.5 percent) vs WTI Crude Oil previous week (-9.4 percent)
Brent Crude Oil (14.2 percent) vs Brent Crude Oil previous week (8.8 percent)
Natural Gas (1.2 percent) vs Natural Gas previous week (1.8 percent)
Gasoline (13.4 percent) vs Gasoline previous week (19.5 percent)
Heating Oil (24.9 percent) vs Heating Oil previous week (18.4 percent)
Bloomberg Commodity Index (-20.3 percent) vs Bloomberg Commodity Index previous week (-17.5 percent)


Individual Markets:

WTI Crude Oil Futures:

WTI Crude Oil Futures COT ChartThe WTI Crude Oil Futures large speculator standing this week equaled a net position of 210,651 contracts in the data reported through Tuesday. This was a weekly decline of -43,101 contracts from the previous week which had a total of 253,752 net contracts.

This week’s current strength score (the trader positioning range over the past three years, measured from 0 to 100) shows the speculators are currently Bearish-Extreme with a score of 0.0 percent. The commercials are Bullish-Extreme with a score of 100.0 percent and the small traders (not shown in chart) are Bullish with a score of 52.7 percent.

WTI Crude Oil Futures StatisticsSPECULATORSCOMMERCIALSSMALL TRADERS
– Percent of Open Interest Longs:21.540.64.9
– Percent of Open Interest Shorts:8.155.73.2
– Net Position:210,651-238,07327,422
– Gross Longs:338,172636,98076,995
– Gross Shorts:127,521875,05349,573
– Long to Short Ratio:2.7 to 10.7 to 11.6 to 1
NET POSITION TREND:
– Strength Index Score (3 Year Range Pct):0.0100.052.7
– Strength Index Reading (3 Year Range):Bearish-ExtremeBullish-ExtremeBullish
NET POSITION MOVEMENT INDEX:
– 6-Week Change in Strength Index:-23.524.3-1.2


Brent Crude Oil Futures:

Brent Last Day Crude Oil Futures COT ChartThe Brent Crude Oil Futures large speculator standing this week equaled a net position of -34,211 contracts in the data reported through Tuesday. This was a weekly fall of -1,429 contracts from the previous week which had a total of -32,782 net contracts.

This week’s current strength score (the trader positioning range over the past three years, measured from 0 to 100) shows the speculators are currently Bullish with a score of 53.8 percent. The commercials are Bearish with a score of 47.2 percent and the small traders (not shown in chart) are Bearish with a score of 33.6 percent.

Brent Crude Oil Futures StatisticsSPECULATORSCOMMERCIALSSMALL TRADERS
– Percent of Open Interest Longs:18.049.93.9
– Percent of Open Interest Shorts:37.431.52.9
– Net Position:-34,21132,4111,800
– Gross Longs:31,57887,8466,819
– Gross Shorts:65,78955,4355,019
– Long to Short Ratio:0.5 to 11.6 to 11.4 to 1
NET POSITION TREND:
– Strength Index Score (3 Year Range Pct):53.847.233.6
– Strength Index Reading (3 Year Range):BullishBearishBearish
NET POSITION MOVEMENT INDEX:
– 6-Week Change in Strength Index:14.2-15.07.5


Natural Gas Futures:

Natural Gas Futures COT ChartThe Natural Gas Futures large speculator standing this week equaled a net position of -125,419 contracts in the data reported through Tuesday. This was a weekly decrease of -446 contracts from the previous week which had a total of -124,973 net contracts.

This week’s current strength score (the trader positioning range over the past three years, measured from 0 to 100) shows the speculators are currently Bearish with a score of 40.9 percent. The commercials are Bullish with a score of 58.2 percent and the small traders (not shown in chart) are Bullish with a score of 71.7 percent.

Natural Gas Futures StatisticsSPECULATORSCOMMERCIALSSMALL TRADERS
– Percent of Open Interest Longs:17.541.77.0
– Percent of Open Interest Shorts:30.532.73.0
– Net Position:-125,41986,73438,685
– Gross Longs:169,972404,07767,512
– Gross Shorts:295,391317,34328,827
– Long to Short Ratio:0.6 to 11.3 to 12.3 to 1
NET POSITION TREND:
– Strength Index Score (3 Year Range Pct):40.958.271.7
– Strength Index Reading (3 Year Range):BearishBullishBullish
NET POSITION MOVEMENT INDEX:
– 6-Week Change in Strength Index:1.2-1.30.2


Gasoline Blendstock Futures:

RBOB Gasoline Energy Futures COT ChartThe Gasoline Blendstock Futures large speculator standing this week equaled a net position of 45,506 contracts in the data reported through Tuesday. This was a weekly lowering of -5,312 contracts from the previous week which had a total of 50,818 net contracts.

This week’s current strength score (the trader positioning range over the past three years, measured from 0 to 100) shows the speculators are currently Bearish-Extreme with a score of 17.5 percent. The commercials are Bullish-Extreme with a score of 83.1 percent and the small traders (not shown in chart) are Bearish with a score of 44.4 percent.

Nasdaq Mini Futures StatisticsSPECULATORSCOMMERCIALSSMALL TRADERS
– Percent of Open Interest Longs:29.848.87.6
– Percent of Open Interest Shorts:11.668.85.7
– Net Position:45,506-50,2544,748
– Gross Longs:74,516122,09318,926
– Gross Shorts:29,010172,34714,178
– Long to Short Ratio:2.6 to 10.7 to 11.3 to 1
NET POSITION TREND:
– Strength Index Score (3 Year Range Pct):17.583.144.4
– Strength Index Reading (3 Year Range):Bearish-ExtremeBullish-ExtremeBearish
NET POSITION MOVEMENT INDEX:
– 6-Week Change in Strength Index:13.4-7.5-37.3


#2 Heating Oil NY-Harbor Futures:

NY Harbor Heating Oil Energy Futures COT ChartThe #2 Heating Oil NY-Harbor Futures large speculator standing this week equaled a net position of 24,464 contracts in the data reported through Tuesday. This was a weekly gain of 2,396 contracts from the previous week which had a total of 22,068 net contracts.

This week’s current strength score (the trader positioning range over the past three years, measured from 0 to 100) shows the speculators are currently Bullish with a score of 78.4 percent. The commercials are Bearish with a score of 32.4 percent and the small traders (not shown in chart) are Bearish with a score of 39.9 percent.

Heating Oil Futures StatisticsSPECULATORSCOMMERCIALSSMALL TRADERS
– Percent of Open Interest Longs:16.152.614.4
– Percent of Open Interest Shorts:7.565.510.2
– Net Position:24,464-36,47212,008
– Gross Longs:45,620149,37240,817
– Gross Shorts:21,156185,84428,809
– Long to Short Ratio:2.2 to 10.8 to 11.4 to 1
NET POSITION TREND:
– Strength Index Score (3 Year Range Pct):78.432.439.9
– Strength Index Reading (3 Year Range):BullishBearishBearish
NET POSITION MOVEMENT INDEX:
– 6-Week Change in Strength Index:24.9-11.4-21.6


Bloomberg Commodity Index Futures:

Bloomberg Commodity Index Futures COT ChartThe Bloomberg Commodity Index Futures large speculator standing this week equaled a net position of -12,656 contracts in the data reported through Tuesday. This was a weekly decline of -33 contracts from the previous week which had a total of -12,623 net contracts.

This week’s current strength score (the trader positioning range over the past three years, measured from 0 to 100) shows the speculators are currently Bullish with a score of 59.1 percent. The commercials are Bearish with a score of 40.9 percent and the small traders (not shown in chart) are Bearish with a score of 20.5 percent.

Bloomberg Index Futures StatisticsSPECULATORSCOMMERCIALSSMALL TRADERS
– Percent of Open Interest Longs:23.974.00.6
– Percent of Open Interest Shorts:42.755.70.2
– Net Position:-12,65612,375281
– Gross Longs:16,11549,878386
– Gross Shorts:28,77137,503105
– Long to Short Ratio:0.6 to 11.3 to 13.7 to 1
NET POSITION TREND:
– Strength Index Score (3 Year Range Pct):59.140.920.5
– Strength Index Reading (3 Year Range):BullishBearishBearish
NET POSITION MOVEMENT INDEX:
– 6-Week Change in Strength Index:-20.320.5-1.1


Article By InvestMacroReceive our weekly COT Reports by Email

*COT Report: The COT data, released weekly to the public each Friday, is updated through the most recent Tuesday (data is 3 days old) and shows a quick view of how large speculators or non-commercials (for-profit traders) were positioned in the futures markets.

The CFTC categorizes trader positions according to commercial hedgers (traders who use futures contracts for hedging as part of the business), non-commercials (large traders who speculate to realize trading profits) and nonreportable traders (usually small traders/speculators) as well as their open interest (contracts open in the market at time of reporting).See CFTC criteria here.

Boosting renewable energy use can happen quickly – and reduce harm to low-income people if done thoughtfully

By Erin Baker, UMass Amherst 

With many nations making efforts to transition away from fossil fuels to renewable energy, SciLine interviewed Erin Baker, a professor of industrial engineering and operations at UMass Amherst. Baker discussed the technological, political and regulatory efforts needed for this transition, as well as ways that our fossil fuel-dependent system disproportionately harms poor communities and communities of color.

The Conversation has collaborated with SciLine to bring you highlights from the discussion, which have been edited for brevity and clarity.

How is our country doing at making the transition to renewable energy?

Erin Baker: There has been amazing technological change over the past 15 years. Offshore wind costs 50% less than it did six years ago. Solar has had a sixfold decrease in costs since 2010. And I think there’s a lot of evidence that technology will adapt and improve if we set the goals and incentives for it.

In terms of policy and regulations, we are moving forward, but we need to be more aggressive. Something that we’re missing and that would be really helpful would be a coherent, federal-level climate policy – whether that is regulatory policy, such as we have for pollution, or a carbon tax or some kind of a cap. The Inflation Reduction Act would be a fantastic starting point if it becomes law.

A good example of something that has been done is President Biden’s move to coordinate and streamline the federal approval process for offshore wind. There are seven federal agencies involved, and having them all separate and moving at their own pace was really difficult for offshore wind energy developers. So Biden has coordinated that, and that’s fantastic. But there are tens of local and state-level agencies and processes that developers still have to go through. It would be really great if we could figure out ways to coordinate and streamline those.

How does our current energy system disproportionately harm poor communities and communities of color?

Erin Baker: Unfortunately, in a lot of different ways. Polluting facilities tend to be located disproportionally in areas that are low income and home to people of color, which can lead to negative health outcomes. Also, in the Texas blackout last winter that killed around 250 people, some research done by my colleague Jay Teneja showed that the long blackouts were four times as likely in communities of color as in predominantly white communities. And, unfortunately, the energy transition won’t necessarily be any more equitable.

For example, it’s common for states to subsidize rooftop solar. And this is good, but the people who get the subsidies are people who own roofs with sun shining on them. People who live in apartments and in cities don’t have access to this, and yet they’re paying for the subsidies. We take the money for the subsidies from everyone, including low-income people, and send them mostly to white, wealthy suburbs.

How can injustices in our energy system be rectified?

Erin Baker: There’s obviously no one solution, but there are a couple of categories of things we can do. One thing that would be really helpful would be to collect data. We have very little data about energy equity issues.

We also need to involve and listen to the traditionally marginalized communities that are most affected by the inequities.

What do you think of the federal and state targets set for offshore wind?

Erin Baker: The Biden administration set a target for 30 gigawatts by 2030. That’s an ambitious goal, since in 2019 the entire world had only 30 GW. But it’s growing rapidly, with global capacity at an astounding 56 GW.

Having this goal of 30 gigawatts helps to organize the supply chain – all the pieces that need to get done for this to happen. We need people who know how to install offshore wind farms. We need special ships. We need planning for transmission. Having these goals really helps to organize all that and make sure all these pieces are in place.

What are the environmental costs and benefits of offshore wind?

Erin Baker: Offshore wind is a really promising technology. The ocean has really good wind resources. And it’s near population centers – we have lots of cities up and down the coasts. Because wind energy is carbon-free, it will provide benefits by reducing emissions and reducing costs.

Some of the work I’ve done has shown that there are billions, and maybe even trillions, of dollars of climate value in offshore wind. We lose between US$10 million and $150 million per year per wind farm by delaying them. We really want to keep these large global environmental benefits in mind as we plan. These can be balanced against local environmental costs and benefits, as well as other factors, like jobs.

In terms of local environmental benefits, when you build an offshore wind farm, the stuff underneath the water ends up creating an artificial reef and actually increasing sea life in that area, which is a benefit.

Negatively, they interfere with bird migrations. Birds don’t actually fly into the wind turbines that much. They fly around them. But if there are a lot of wind farms, that’s a lot of flying around, and that can be hard on the birds. And some animals, like right whales, can get caught in mooring lines if we have floating wind turbines. So, there are local environmental costs. What we need to do is balance these with the global benefits from addressing climate change.

Are you hopeful about our ability to address climate change?

Erin Baker: I am optimistic that we can solve climate change, because humans are very inventive. My work on technological change has shown that once we have a goal or incentive, we tend to improve technologies much faster than we ever predicted. So I think we can be ambitious. We can aim for net-zero by 2030 instead of 2050. And we can solve climate change while at the same time stimulating innovation, fueling growth and increasing quality of life. But we have to set these goals. To access the benefits of the energy transition, we really need to act boldly and decisively.

Watch the full interview to hear more about what’s required for a just, renewable energy transition.

SciLine is a free service based at the nonprofit American Association for the Advancement of Science that helps journalists include scientific evidence and experts in their news stories.The Conversation

About the Author:

Erin Baker, Professor of Industrial Engineering Applied to Energy Policy, UMass Amherst

This article is republished from The Conversation under a Creative Commons license. Read the original article.

Brent is Stressed and Continues to Decline

By RoboForex Analytical Department

The commodity market suffered another stress last week. On Monday, the situation reached stability, but it remains quite complicated; Brent is trading at $95.60.

The asset closed last trading week near its 5-month lows.

The key reason for these negative vibes is the same’ global expectations of a worldwide recession. Economic slumps all over the world will eventually lead to a decline in demand for fuel, hence a drop in energy prices.

Another local factor that puts pressure on is the USD strengthening.

Last Friday’s report from Baker Hughes showed that over the past week, the Oil Rig Count in the US lost 7 units, down to 598. In Canada, the indicator increased by 3 units, up to 140. Shale oil companies are in no hurry to invest more money in production.

On the H4 chart, after breaking 100.00 downwards, Brent is still correcting and has already reached the short-term target at 94.80. Possibly, today the pair may form one more ascending structure to test 99.90 from below and then complete the descending wave by reaching 90.00. After that, the instrument may resume trading upwards with the target at 122.00. From the technical point of view, this scenario is confirmed by the MACD Oscillator: its signal line is moving near the lows outside the histogram area and may later grow to reach 0.

As we can see in the H1 chart, after finishing the descending correctional structure at 95.15, Brent is consolidating above this level. Possibly, the asset may break the range to the upside and start another growth with the target at 100.00. Later, the market may resume falling to reach 90.00. From the technical point of view, this idea is confirmed by the Stochastic Oscillator: its signal line is moving near the highs above 80. Later, the line may fall to break 50 and continue falling to reach 20.

Disclaimer

Any forecasts contained herein are based on the author’s particular opinion. This analysis may not be treated as trading advice. RoboForex bears no responsibility for trading results based on trading recommendations and reviews contained herein.