
By RoboForex Analytical Department
The commodity market remains under bearish control on Monday; Brent is falling to reach $95.45.
Oil is being pressured by the expensive “greenback”, as well as public concerns about a global recession around the world. Today’s economic slump might reduce interest in energies, having a negative impact on prices.
Investors are still waiting for the news on the nuclear deal between the US and Iran. Of course, no rash decisions are expected, but any positive progress would have a positive influence on market sentiment.
According to the CFTC, last week, big-time investors, including hedge funds, decreased their long positions to 290,388 contracts. It’s the lowest number in more than two years. The total long position in futures and options on Brent and WTI dropped to 9-year lows.
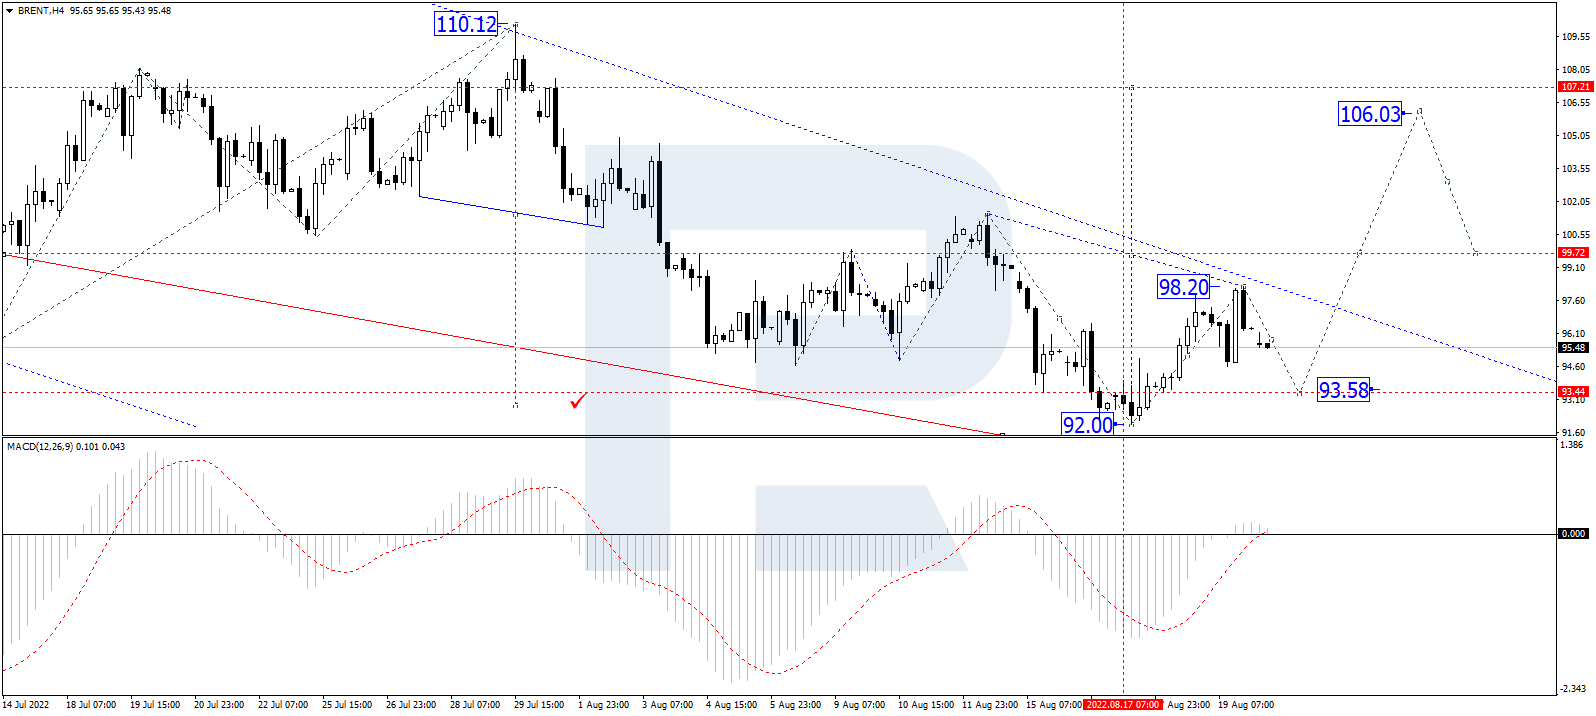
On the H4 chart, having completed the first ascending wave at 98.20, Brent is expected to correct down to 93.60 and may later form one more ascending structure with the short-term target at 106.00. After that, the instrument may start another correction towards 99.60 and then resume trading upwards to reach 107.20. From the technical point of view, this scenario is confirmed by the MACD Oscillator: its signal line is moving close to 0 and may yet continue falling. Later, it may grow to break 0 and continue moving to reach new highs.
Free Reports:
 Get our Weekly Commitment of Traders Reports - See where the biggest traders (Hedge Funds and Commercial Hedgers) are positioned in the futures markets on a weekly basis.
 Sign Up for Our Stock Market Newsletter – Get updated on News, Charts & Rankings of Public Companies when you join our Stocks Newsletter
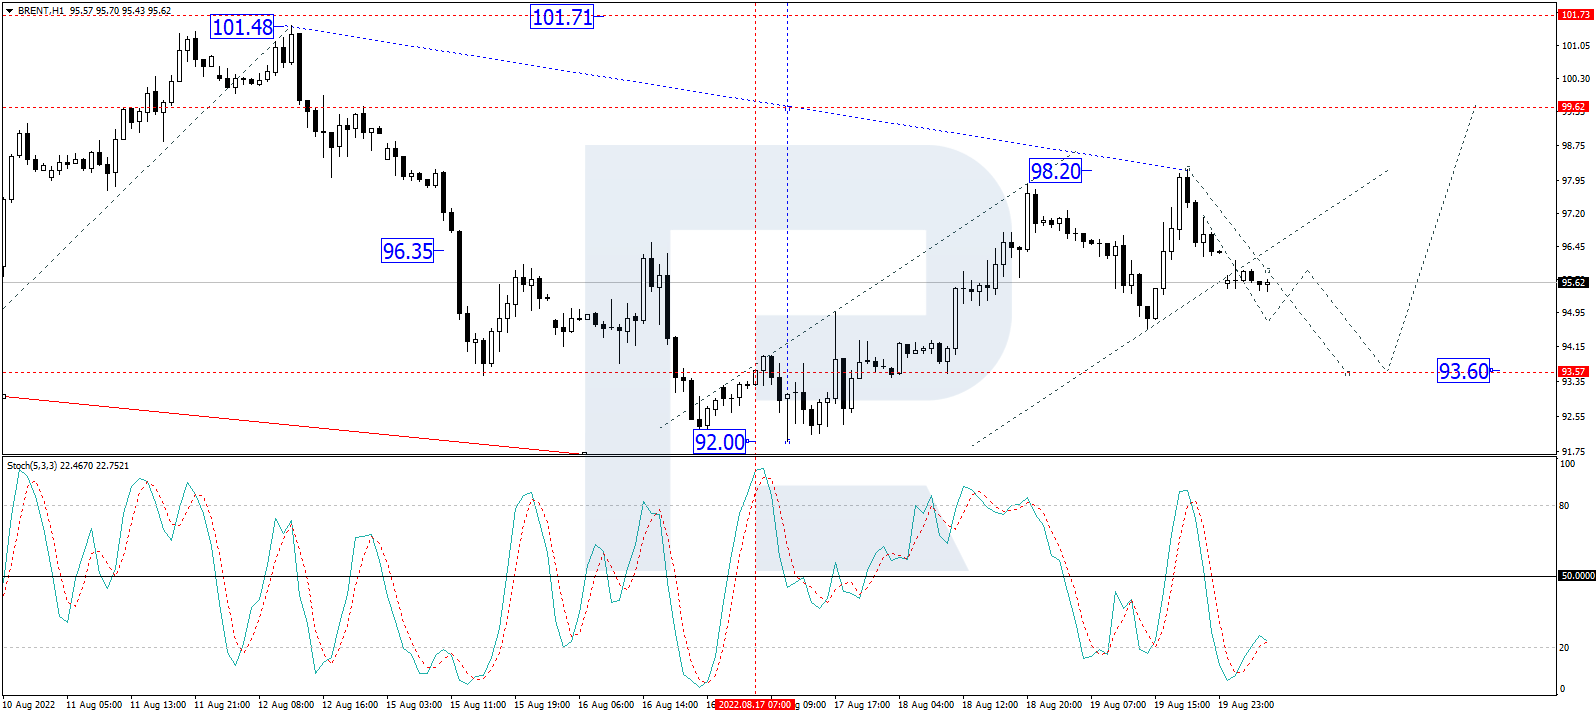
As we can see in the H1 chart, after finishing the ascending structure at 98.20 and breaking the ascending channel at 95.90, Brent is consolidating around the latter level. Possibly, the asset may extend this correction down to 93.60 and then start another growth with the target at 99.60. And it’s just half of the third ascending wave. From the technical point of view, this idea is confirmed by the Stochastic Oscillator: its signal line is moving near the lows below 20. Later, the line may grow to rebound from 50 and resume falling to return to 20. After that, it may reverse and move to reach new highs.
Disclaimer
Any forecasts contained herein are based on the author’s particular opinion. This analysis may not be treated as trading advice. RoboForex bears no responsibility for trading results based on trading recommendations and reviews contained herein.

- Geopolitical and macroeconomic conditions continue to pressure market sentiment Jul 20, 2026
- USD/JPY Poised to Continue Gains as Expensive Oil and Lack of Support Weigh on Yen Jul 20, 2026
- COT Metals Charts: Weekly Speculator Bets led by Copper & Steel Jul 18, 2026
- COT Bonds Charts: Weekly Speculator Bets led by 2-Year, SOFR 3M & 5-Year Bonds Jul 18, 2026
- COT Energy Charts: Weekly Speculator Bets led by Brent Oil & Heating Oil Jul 18, 2026
- COT Soft Commodities Charts: Weekly Speculator Bets led by Wheat, Corn & Soybean Meal Jul 18, 2026
- The Bank of Canada kept its interest rate unchanged. Platinum prices reached a three‑week high Jul 16, 2026
- Stock indices rose after the release of US inflation data. China’s GDP slowed sharply Jul 15, 2026
- GBP/USD Awaits Political News: What Will Happen Next Jul 15, 2026
- USD/JPY Holds at Highs: Pressure Lingers on Yen Jul 14, 2026