The price of Brent crude oil commenced the new week in June with a marginal decline, reaching $75.70 per barrel.
Investor uncertainty regarding the expansion of energy demand remains a significant factor restricting the potential for price increases in the “black gold” market. There are currently no clear indications from global economies, particularly the United States and China, suggesting a rapid acceleration in GDP growth. Moreover, various pressures on economies, such as disruptions in the supply chain and subdued consumer demand, further contribute to this situation.
It is worth highlighting the weakened position of the US dollar, which provides some local support for oil prices. During periods of US currency depreciation, commodities tend to become more appealing for investment.
Technical Analysis:
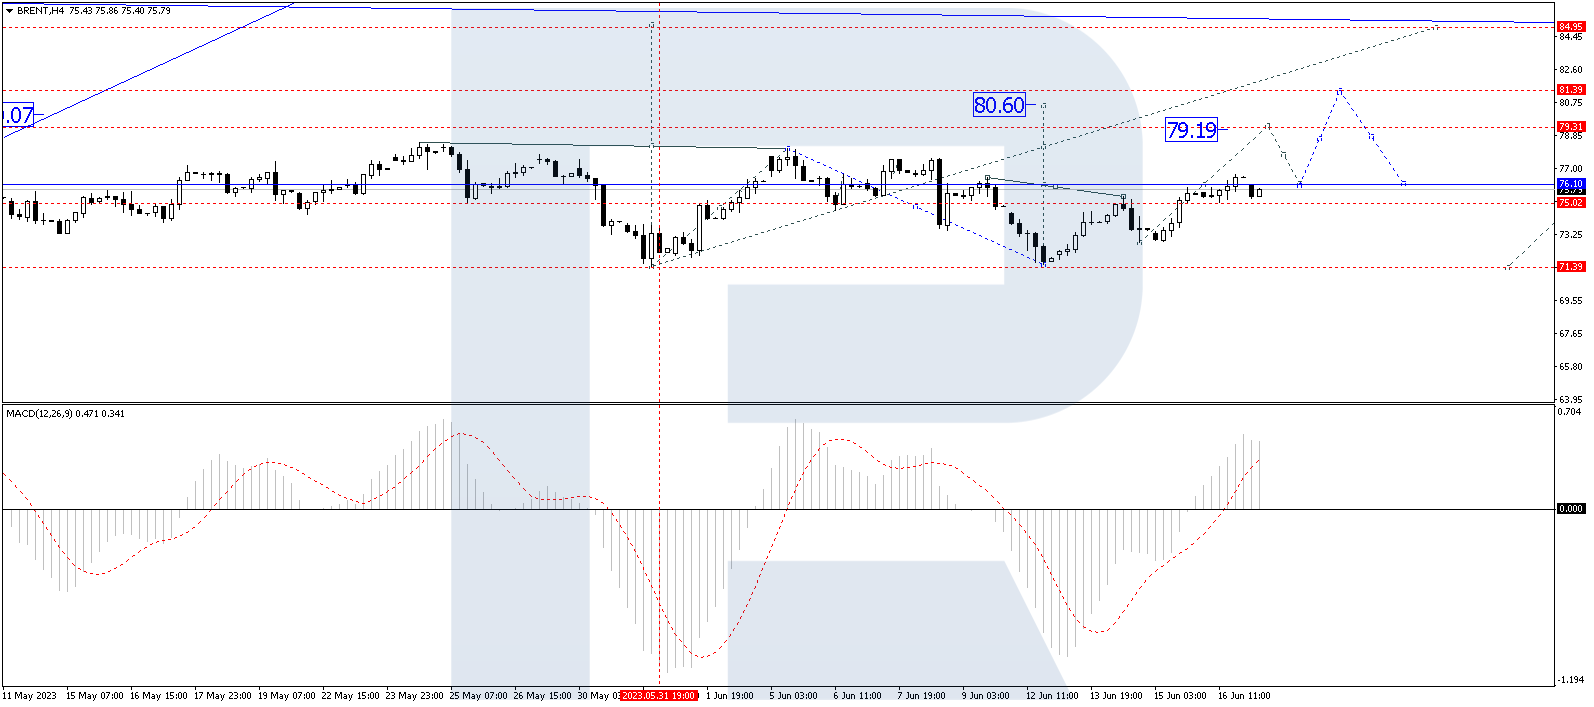
On the H4 timeframe, Brent crude oil appears to be forming the structure of a third upward wave. Currently, it has risen to 76.06, and the market continues to consolidate around this level. There is a possibility of a breakout above this range, leading to the continuation of the third wave towards 79.19. Following the attainment of this level, a corrective pullback to 76.66 cannot be ruled out. Subsequently, there is a potential for further growth towards 80.60. The technical analysis supports this scenario, as the MACD indicator’s signal line has recently broken above the zero level, displaying confident growth towards new highs.
On the H1 timeframe, Brent has already formed an upward wave structure, reaching 76.06. The market is presently consolidating around this level, indicating a pattern of a continued upward trend. The projected target for this wave of growth is 79.30. Technical confirmation is provided by the Stochastic oscillator, with its signal line surpassing the level of 50 and exhibiting steady growth towards 80.
Disclaimer
Any forecasts contained herein are based on the author’s particular opinion. This analysis may not be treated as trading advice. RoboForex bears no responsibility for trading results based on trading recommendations and reviews contained herein.
The commodity market is currently being impacted by various factors, causing Brent crude oil prices to decline. Currently, the price of a barrel of Brent is hovering around $72.35, reflecting a loss of approximately 4% within a 24-hour period.
Bearish sentiment in the oil market has been bolstered by Goldman Sachs’ updated price forecast. The investment bank now estimates that the average price per barrel will drop to $86.00, down from the previous forecast of $95.00 at the end of last year. Similarly, the outlook for WTI has worsened, with expectations declining from $89.00 to $81.00 per barrel.
Goldman Sachs analysts had previously held a more optimistic view on oil prices.
Furthermore, the pressure on commodity prices is being exerted by market anticipation of interest rate decisions by the Federal Reserve (Fed) and the European Central Bank (ECB). Both central banks are scheduled to hold their meetings later this week, on Wednesday and Thursday respectively.
Technical Analysis
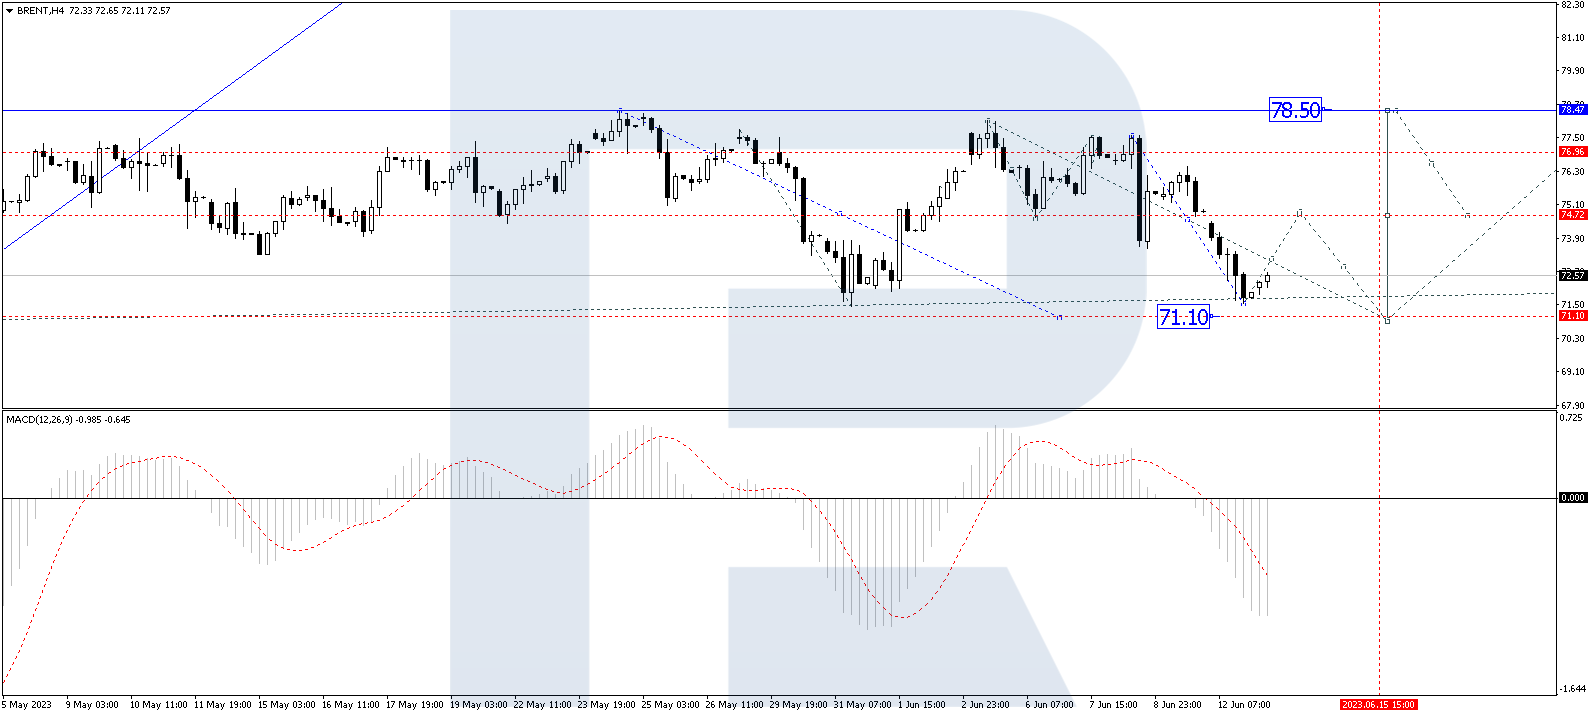
On the H4 timeframe, Brent crude oil is currently forming a wide consolidation range, centered around 74.55. However, the market has extended this range downwards to 71.55, indicating a potential for further correction. Today, we expect to see a potential upward movement towards 74.55, which will be tested from below. Following this, a downward trend towards 71.10 and subsequent upward movement towards 78.50 cannot be ruled out. This is the initial target. Technically, this scenario is supported by the MACD indicator, as its signal line is currently below zero and preparing to exit the histogram area, suggesting potential price growth.
On the H1 timeframe, Brent crude oil is currently following an upward wave structure towards 73.10. Once the price reaches this level, a downward correction towards 72.30 may occur. Subsequently, if the price reaches the 72.30 level, a further rise towards 74.55 is anticipated. Technically, this scenario is confirmed by the Stochastic oscillator, as its signal line continues to decline towards 50. Once it reaches this level, an upward movement towards 80 is expected to begin.
Disclaimer
Any forecasts contained herein are based on the author’s particular opinion. This analysis may not be treated as trading advice. RoboForex bears no responsibility for trading results based on trading recommendations and reviews contained herein.
The National Environmental Policy Act, enacted in 1970, is widely viewed as a keystone U.S. environmental law. For any major federal action that affects the environment, such as building an interstate highway or licensing a nuclear power plant, NEPA requires relevant agencies to analyze environmental impacts, consider reasonable alternatives and accept public input. It also allows citizens to sue if they believe government has not complied.
Critics argue that NEPA reviews delay projects and drive up costs. In May 2023 negotiations over raising the federal debt ceiling, President Joe Biden agreed to certain changes to NEPA reviews, which both the White House and congressional Republicans said would streamline permitting for infrastructure projects. Legal scholars J.B. Ruhl and James Salzman explain these changes and what they mean for protecting the environment and expanding clean energy production.
What kinds of projects typically require NEPA reviews?
The statutory text of NEPA is quite sparse and open-ended. When people speak of what NEPA requires, they really are talking about how the White House Council on Environmental Quality, or CEQ, federal agencies and the courts have implemented the law over the past 50 years.
The simple requirement is for agencies to create a detailed statement on the impacts of any major federal action that significantly affects the environment. A whole body of law and policy creates filters that sort projects into different NEPA buckets.
NEPA requires all federal agencies to analyze the environmental impacts of their major actions, consider alternatives and receive public comment.
First, only projects that will be carried out, funded or authorized by a federal agency are subject to NEPA. That’s a pretty big universe, but it also excludes a lot. For example, a wind farm built on private land by a private utility might not require any federal funding or approval. That means it wouldn’t be subject to NEPA.
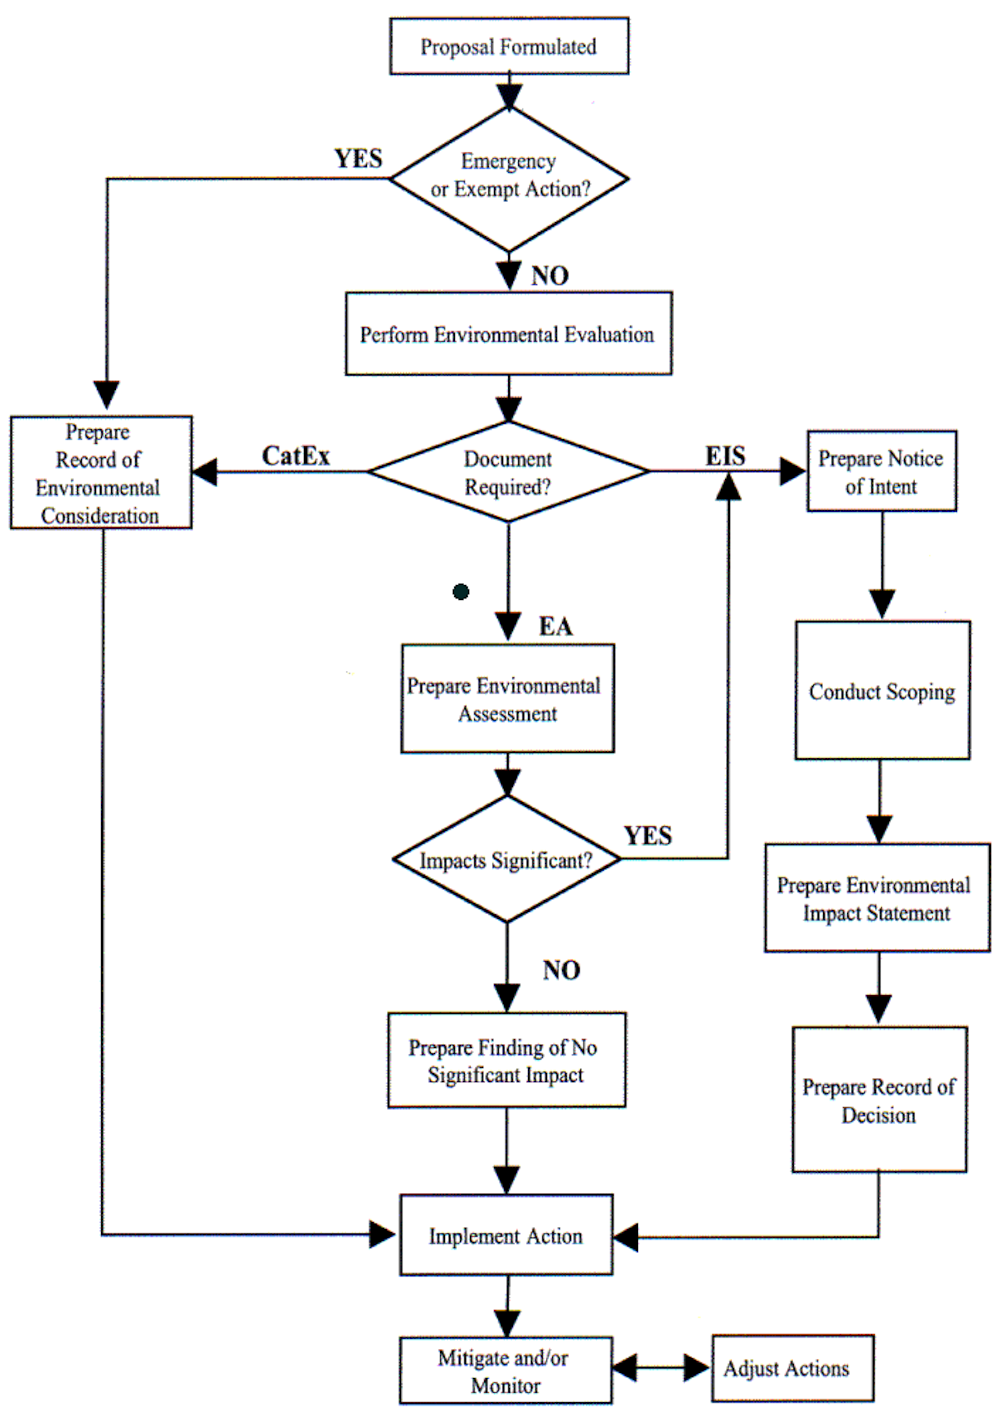
If a project is subject to NEPA, the federal agency that has primary oversight assesses its impacts to decide how much analysis is needed. Many agencies use a classification known as categorical exclusions to winnow out minor actions that they know have no significant impacts, either individually or cumulatively. For example, the Interior Department categorically excludes planned burns to clear brush on areas smaller than 4,500 acres.
If the expected impacts are more extensive, but it’s not clear by how much, the agency can prepare an environmental assessment. If that assessment finds the impacts to the human environment will not be significant, that’s the end of the NEPA process.
If the impacts are significant, the agency will prepare a full-blown environmental impact statement, or EIS, which is a far more intensive process. CEQ guidelines establish an elaborate template of topics agencies must evaluate, and the public has opportunities to comment on a draft version.
A CEQ review of EISs prepared by all federal agencies from 2010 through 2018 found that, on average, it took about four and a half years to issue an EIS, not including added time if someone sued. The lengths of these reviews ranged widely but averaged 575 pages.
If an agency conducts lots of the same actions under a particular program, such as timber leasing on federal land, it might conduct a high-level programmatic EIS to cover the large-scale issues and then follow up with individual NEPA analyses for specific projects.
Decisions not to issue an EIS can be challenged in court. So can the EIS itself if critics believe that it’s inadequate.
What are NEPA critics’ central arguments?
Critiques of NEPA come from many different interests. The law mainly affects land development, industry and resource extraction activities such as logging, mining and drilling for oil and gas, particularly on federal public lands.
NEPA requires an impact assessment, but it doesn’t prescribe any particular outcome. Still, it unquestionably can add substantial time and cost to any significant project. If a project is controversial, interested parties can submit public comments that get their views on the record. If opponents aren’t happy with the final EIS, they can sue the agency responsible for the decision in federal court.
Between agency review and litigation, NEPA can add many years to a project’s development timeline before it is “shovel ready.” For example, it takes roughly four to seven years to complete environmental reviews for prescribed burns that the U.S. Forest Service carries out to reduce wildfire risks.
Supporters argue that NEPA reviews have avoided many bad decisions. In our view, the NEPA process is an important feature of the country’s stewardship of its natural resources. But we also share the growing concern that it can be used to delay building renewable energy infrastructure that the U.S. urgently needs to mitigate climate change.
Did the debt ceiling agreement significantly change the NEPA process?
Many of the changes are little more than tweaks. Others codify long-standing practices based on how the Council on Environmental Quality, agencies and courts implement the law.
One notable change is requiring a single lead agency and a single environmental impact statement for projects, even when those projects require multiple agency approvals. There also are some new time and page limits. For example, environmental impact statements will be required to be completed within two years and be no more that 150 pages long for most projects, and 300 pages for the most complex projects.
There also are some changes to definitions, such as what constitutes a “major federal action,” that narrow NEPA’s scope to some degree, although it will take time to sort out their meaning. Overall, we do not see these changes as a major overhaul of NEPA.
Will the changes speed up work on clean energy systems?
Maybe, but not nearly as much as needed. First, NEPA applies to projects that need federal funding or approval, such as under the Endangered Species Act. Getting that money or agency green light can also involve delays and litigation independent of the NEPA review.
Second, many state and local laws can affect large renewable energy projects, and those statutes can also be used to slow projects down. The bottom line is that to move the needle, politicians will have to do more to reform the project review process.
As renewable energy scales up in the U.S., local opposition could impede some utility-scale projects.
All of these involve incredibly complex permitting processes, and tweaking NEPA won’t change that. Other hot-button issues – including federal preemption of state and local laws, impacts on Native American cultural lands, and environmental justice – will make further permitting reforms politically difficult.
Even this first small measure was hotly contested, and happened now only because it was tied to the debt limit legislation. As the inclusion of federal approval for the Mountain Valley gas pipeline in the debt ceiling agreement shows, in politics you need a quid in exchange for a quo. We expect to see a lot more deal-making if Congress takes permitting reform seriously.
Oil continues to fall at the start of another May week. A barrel of Brent crude fell to 73.70 USD.
The sell-off in the commodities market has been ongoing for several weeks. Investors tried to get a foothold above 78.00 USD, but their attempts failed. The OPEC report, which normally looks optimistic, did not give investors any reason to buy this time. The main trigger for selling remains fears that the high interest rates around the world will put pressure on global economic activity. This, in turn, will reduce the demand for energy commodities.
Data from Baker Hughes showed that US drilling activity declined. Gas rigs were primarily affected (-16) but oil rigs also declined (-2).
On H4, Brent has worked its way up to the 77.44 level. The market continues to develop a correction today. A decline to 72.33 is expected, followed by a new wave of growth to 80.07. After its breakdown, a new growth potential could open to the level of 87.77. The target is local. Technically, this scenario is confirmed by the MACD indicator: its signal line is below zero, with growth to new highs expected.
On H1, a consolidation range has formed around the 74.87 level. The market has escaped it downwards today. A decline to 72.56 is expected, followed by a rise to 74.87 and a decline to 72.33. After the price reaches this level, a wave of growth to 80.00 could begin. Technically, this scenario is confirmed by the Stochastic oscillator: Its signal line is breaking through the level of 20 upwards, aiming at 50. A rebound from this level is expected, followed by a new decline to 20. Next, growth to 80 could follow.
Disclaimer
Any forecasts contained herein are based on the author’s particular opinion. This analysis may not be treated as trading advice. RoboForex bears no responsibility for trading results based on trading recommendations and reviews contained herein.
Hydrogen is the most abundant element in the universe, but because it’s so reactive, it isn’t found on its own in nature. Instead, it is typically bound to other atoms and molecules in water, natural gas, coal and even biological matter like plants and human bodies.
Hydrogen can be isolated, however. And on its own, the H₂ molecule packs a heavy punch as a highly effective energy carrier.
Hydrogen can also be used to generate electricity with lower greenhouse gas emissions than coal or natural gas power plants. That potential is getting more attention as the U.S. government prepares new rules that would require existing power plants to cut their carbon dioxide emissions.
Because it can be stored, H₂ could help overcome intermittency issues associated with renewable power sources like wind and solar. It can also be blended with natural gas in existing power plants to reduce the plant’s emissions.
Using hydrogen in power plants can reduce carbon dioxide emissions when either blended or alone in specialized turbines, or in fuel cells, which consume H₂ and oxygen, or O₂, to produce electricity, heat and water. But it’s typically not entirely CO₂-free. That’s in part because isolating H₂ from water or natural gas takes a lot of energy.
How is hydrogen produced?
There are a few common ways to produce H₂:
Electrolysis can isolate hydrogen by splitting water – H₂O – into H₂ and O₂ using an electric current.
Methane reforming uses steam to split methane, or CH₄, into H₂ and CO₂. Oxygen and steam or CO₂ can also be used for this splitting process.
Gasification transforms hydrocarbon-based materials – including biomass, coal or even municipal waste – into synthesis gas, an H₂-rich gas that can be used as a fuel either on its own or as a precursor for producing chemicals and liquid fuels.
Each has benefits and drawbacks.
Green, blue, gray – what do the colors mean?
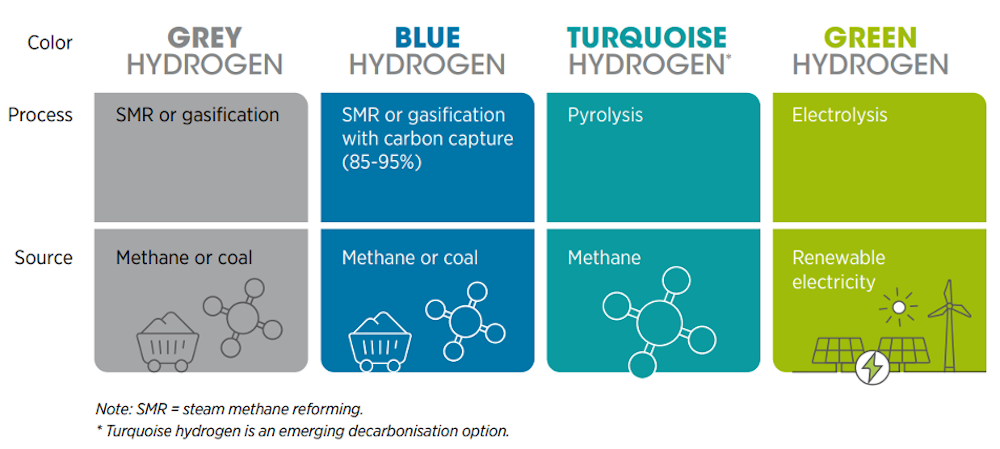
Hydrogen is often described by colors to indicate how clean, or CO₂-free, it is. The cleanest is green hydrogen.
Green H₂ is produced using electrolysis powered by renewable energy sources, such as wind, solar or hydropower. While green hydrogen is completely CO₂-free, it is costly, at around US$4-$9 per kilogram ($2-$4 per pound) because of the high energy required to split water.
Other less energy-intensive techniques can produce H₂ at a lower cost, but they still emit greenhouse gases.
Gray H₂ is the most common type of hydrogen. It is made from natural gas through methane reforming. This process releases carbon dioxide into the atmosphere and costs around $1-$2.50 per kilogram (50 cents-$1 per pound).
If gray hydrogen’s CO₂ emissions are captured and locked away so they aren’t released into the atmosphere, it can become blue hydrogen. The costs are higher, at around $1.50-$3 per kilogram (70 cents-$1.50 per pound) to produce, and greenhouse gas emissions can still escape when the natural gas is produced and transported.
Over 95% of the H₂ produced in the U.S. today is gray hydrogen made with natural gas, which still emits greenhouse gases.
Whether H₂ can ramp up as a natural gas alternative for the power industry and other uses, such as for transportation, heating and industrial processes, will depend on the availability of low-cost renewable energy for electrolysis to generate green H₂.
Without the infrastructure, H₂ use won’t grow quickly. It’s a modern-day version of “Which came first, the chicken or the egg?” Continued use of fossil fuels for H₂ production could spur investment in H₂ infrastructure, but using fossil fuels releases greenhouse gases.
Policies like Europe’s greenhouse gas emissions limits and the 2022 U.S. Inflation Reduction Act, which offers tax credits up to $3 per kilogram ($1.36 per pound) of H₂, could help make cleaner hydrogen more competitive.
Hydrogen demand is projected to increase up to two to four times its current level by 2050. For that to be green H₂ would require significant amounts of renewable energy at the same time that new solar, wind and other renewable energy power plants are being built to provide electricity directly to the power sector.
While green hydrogen is a promising trend, it is not the only solution to meeting the world’s energy needs and carbon-free energy goals. A combination of renewable energy sources and clean H₂, including blue, green or turquoise, will likely be necessary to meet the world’s energy needs in a sustainable way.
Oil markets have been plunged into a bloodbath over the past 24 hours.
The global commodity shed almost 3% this morning, extending a 5% drop on Tuesday after disappointing US economic data fuelled fears of a recession. With oil bears drawing ample strength from weak US factory data and renewed concerns about the US banking sector, further downside could be on the cards ahead of the Fed decision later today.
In the meantime, it will be wise to keep a close eye on the pending US ISM numbers and data from the Energy Information Agency (EIA) this afternoon. If the reports reinforce fears around the US economy or the EIA data shows a rise in oil inventories, this could keep bears in the driving seat.
Looking at the technical picture, both WTI and Brent Crude are under intense pressure on the daily charts. WTI extended losses on Wednesday with bears smashing into the $70 level. A strong break and daily close below this point could open a path toward $67 and $64.33 – the lowest level hit this year. Should $70 or $67 prove to be reliable support, prices may experience a technical pullback toward $74 before resuming the downtrend.
It is a similar story for Brent. Prices are trading below the 50, 100, and 200-day SMA while the MACD trades below zero. The bearish trend is healthy with the next key level of interest found at 72.50. Below this point, prices could test $70 and potentially lower.
Since we are discussing commodities, gold secured a daily close above the $2015 resistance as downbeat US economic data and renewed banking fears sparked risk aversion. However, it may take a potent fundamental spark to push prices higher with all eyes on the Fed meeting this evening. Although the central bank is widely expected to hike rates by 25 basis points, investors will be looking for any confirmation that a pause in hikes is on the table. Whatever the outcome, it will certainly impact gold.
The solid breakout above $2015 may open the doors toward $2032 and $2047. Should prices slip back below $2000, this could trigger a decline towards $1970 and $1950, respectively.
From rural Pennsylvania to Los Angeles, more than 17 million Americans live within a mile of at least one oil or gas well. Since 2014, most new oil and gas wells have been fracked.
Fracking, short for hydraulic fracturing, is a process in which workers inject fluids underground under high pressure. The fluids fracture coal beds and shale rock, allowing the gas and oil trapped within the rock to rise to the surface. Advances in fracking launched a huge expansion of U.S. oil and gas production starting in the early 2000s but also triggered intense debate over its health and environmental impacts.
Fracking fluids are up to 97% water, but they also contain a host of chemicals that perform functions such as dissolving minerals and killing bacteria. The U.S. Environmental Protection Agency classifies a number of these chemicals as toxic or potentially toxic.
We study the oil and gas industry in California and Texas and are members of the Wylie Environmental Data Justice Lab, which studies fracking chemicals in aggregate. In a recent study, we worked with colleagues to provide the first systematic analysis of chemicals found in fracking fluids that would be regulated under the Safe Drinking Water Act if they were injected underground for other purposes. Our findings show that excluding fracking from federal regulation under the Safe Drinking Water Act is exposing the public to an array of chemicals that are widely recognized as threats to public health.
Averting federal regulation
Fracking technologies were originally developed in the 1940s but only entered widespread use for fossil fuel extraction in the U.S. in the early 2000s. Since the process involves injecting chemicals underground and then disposing of contaminated water that flows back to the surface, it faced potential regulation under multiple U.S. environmental laws.
In 1997, the 11th Circuit Court of Appeals ruled that fracking should be regulated under the Safe Drinking Water Act. This would have required oil and gas producers to develop underground injection control plans, disclose the contents of their fracking fluids and monitor local water sources for contamination.
In response, the oil and gas industry lobbied Congress to exempt fracking from regulation under the Safe Drinking Water Act. Congress did so as part of the Energy Policy Act of 2005.
This provision is widely known as the Halliburton Loophole because it was championed by former U.S. Vice President Dick Cheney, who previously served as CEO of oil services company Halliburton. The company patented fracking technologies in the 1940s and remains one of the world’s largest suppliers of fracking fluid.
Though researchers have produced numerous studies on the health effects of these chemicals, federal exemptions and sparse data still make it hard to monitor the impacts of their use. Further, much existing research focuses on individual compounds, not on the cumulative effects of exposure to combinations of them.
Chemical use in fracking
For our review we consulted the FracFocus Chemical Disclosure Registry, which is managed by the Ground Water Protection Council, an organization of state government officials. Currently, 23 states – including major producers like Pennsylvania and Texas – require oil and gas companies to report to FracFocus information such as well locations, operators and the masses of each chemical used in fracking fluids.
We used a tool called Open-FracFocus, which uses open-source coding to make FracFocus data more transparent, easily accessible and ready to analyze.
This 2020 news report examines possible leakage of fracking wastewater from an underground injection well in west Texas.
We found that from 2014 through 2021, 62% to 73% of reported fracks each year used at least one chemical that the Safe Drinking Water Act recognizes as detrimental to human health and the environment. If not for the Halliburton Loophole, these projects would have been subject to permitting and monitoring requirements, providing information for local communities about potential risks.
In total, fracking companies reported using 282 million pounds of chemicals that would otherwise regulated under the Safe Drinking Water Act from 2014 through 2021. This likely is an underestimate, since this information is self-reported, covers only 23 states and doesn’t always include sufficient information to calculate mass.
Chemicals used in large quantities included ethylene glycol, an industrial compound found in substances such as antifreeze and hydraulic brake fluid; acrylamide, a widely used industrial chemical that is also present in some foods, food packaging and cigarette smoke; naphthalene, a pesticide made from crude oil or tar; and formaldehyde, a common industrial chemical used in glues, coatings and wood products and also present in tobacco smoke. Naphthalene and acrylamide are possible human carcinogens, and formaldehyde is a known human carcinogen.
The data also show a large spike in the use of benzene in Texas in 2019. Benzene is such a potent human carcinogen that the Safe Drinking Water Act limits exposure to 0.001 milligrams per liter – equivalent to half a teaspoon of liquid in an Olympic-size swimming pool.
Many states – including states that require disclosure – allow oil and gas producers to withhold information about chemicals they use in fracking that the companies declare to be proprietary information or trade secrets. This loophole greatly reduces transparency about what chemicals are in fracking fluids.
We found that the share of fracking events reporting at least one proprietary chemical increased from 77% in 2015 to 88% in 2021. Companies reported using about 7.2 billion pounds of proprietary chemicals – more than 25 times the total mass of chemicals listed under the Safe Drinking Water Act that they reported.
Closing the Halliburton loophole
Overall, our review found that fracking companies have reported using 28 chemicals that would otherwise be regulated under the Safe Drinking Water Act. Ethylene glycol was used in the largest quantities, but acrylamide, formaldehyde and naphthalene were also common.
Given that each of these chemicals has serious health effects, and that hundreds of spills are reported annually at fracking wells, we believe action is needed to protect public and environmental health, and to enable scientists to rigorously monitor and research fracking chemical use.
Based on our findings, we believe Congress should pass a law requiring full disclosure of all chemicals used in fracking, including proprietary chemicals. We also recommend disclosing fracking data in a centralized and federally mandated database, managed by an agency such as the EPA or the National Institute of Environmental Health Sciences. Finally, we recommend that Congress repeal the Halliburton Loophole and once again regulate fracking under the Safe Drinking Water Act.
As the U.S. ramps up liquefied natural gas exports in response to the war in Ukraine, fracking could continue for the foreseeable future. In our view, it’s urgent to ensure that it is carried out as safely as possible.
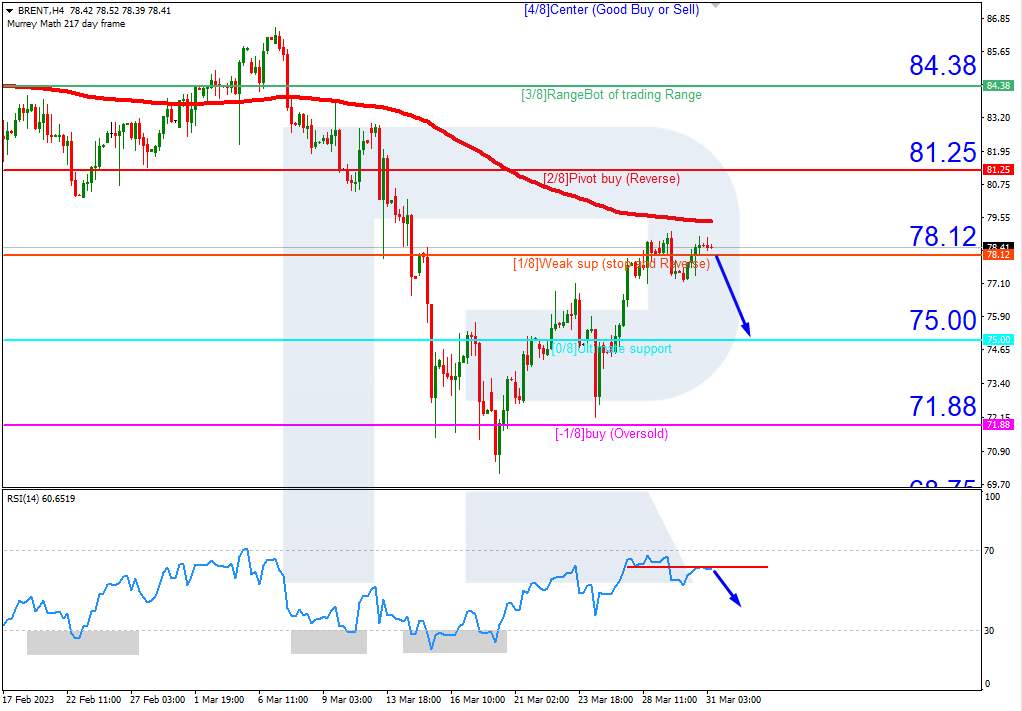
On H4, Brent quotes are under the 200-day Moving Average, which indicates the prevalence of a downtrend. The RSI is testing the resistance line. In this circumstances, we expect a downward breakout of 1/8 (78.12) and falling to the support at 0/8 (75.00). The scenario can be canceled by rising above 2/8 (81.25), which might lead to a trend reversal and growth to the resistance level of 3/8 (84.38).
On M15, a breakout of the lower line of the VoltyChannel indicator will increase the probability of further price falling.
S&P 500
On H4, the quotes of the S&P 500 index have broken the 200-day Moving Average and are now above it, which indicates a probable development of the uptrend. However, the RSI has reached the overbought area. As a result, in such a situation, a rebound from the level of 4/8 (4062.5) is expected, after which the price could fall to the support at 3/8 (3984.4). The scenario can be canceled by rising above the resistance at 4/8 (4062.5). In this case, the growth of the S&P 500 index will continue, and the index could reach 5/8 (4140.6).
On M15, further price falling can be supported by a breakout of the lower border of VoltyChannel.
Attention! Forecasts presented in this section only reflect the author’s private opinion and should not be considered as guidance for trading. RoboForex LP bears no responsibility for trading results based on trading recommendations described in these analytical reviews.
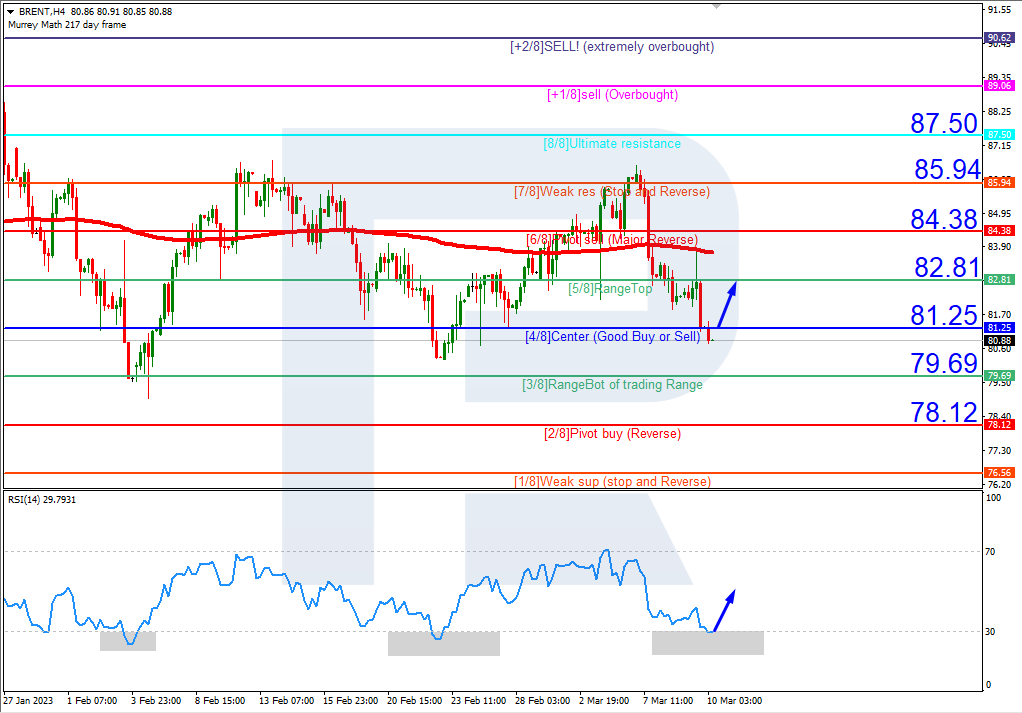
On H4, the 200-day Moving Average has broken, and Brent quotes are now below it, which means they might develop a downtrend. However, the RSI has already reached the oversold area. As a result, we should expect a breakaway of 4/8 (81.25) upwards and growth of the price to the resistance level of 5/8 (82.81). The scenario can be cancelled by a downwards breakaway of the support at 3/8 (79.69), in which case Brent quotes will continue falling and might reach 2/8 (78.12).
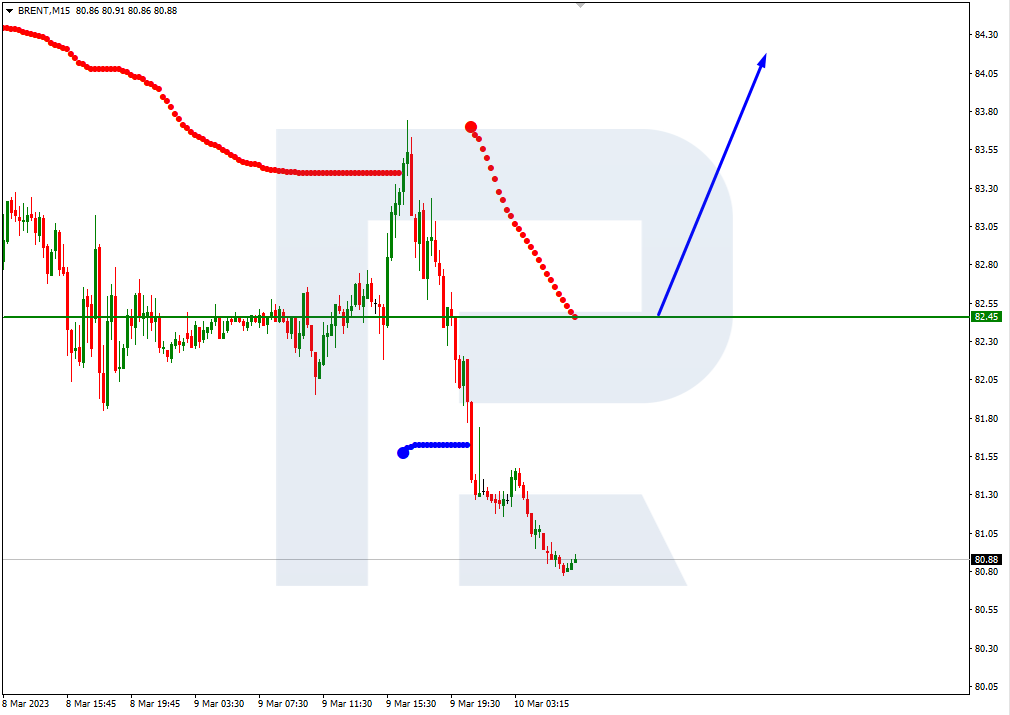
On M15, price growth can additionally be supported by a breakaway of the upper border of the VoltyChannel indicator.
S&P 500
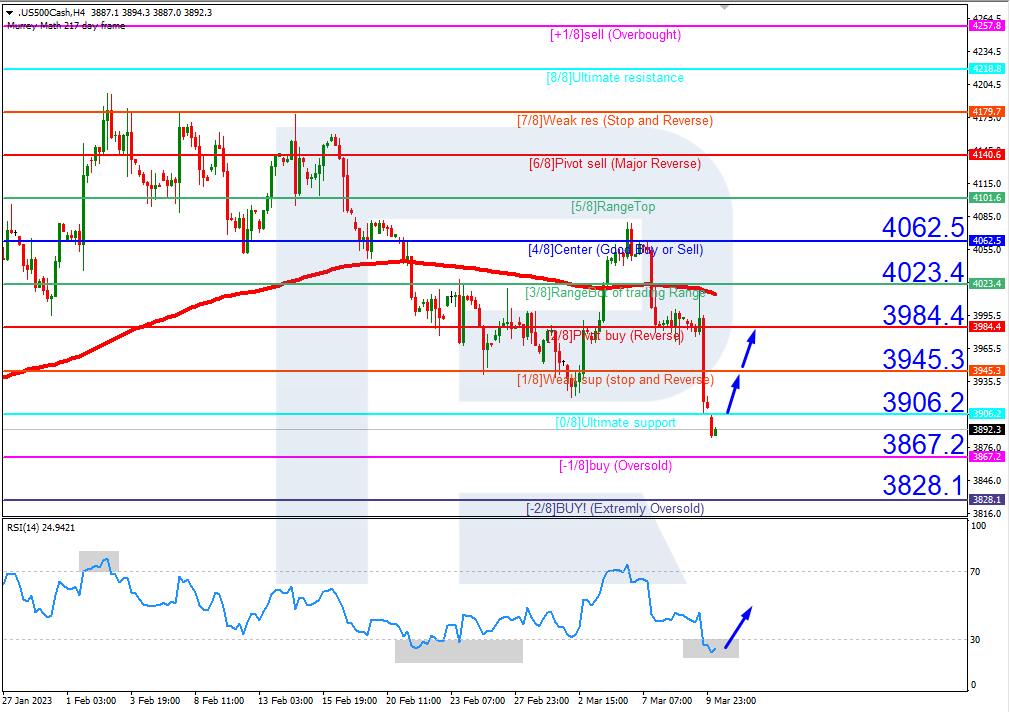
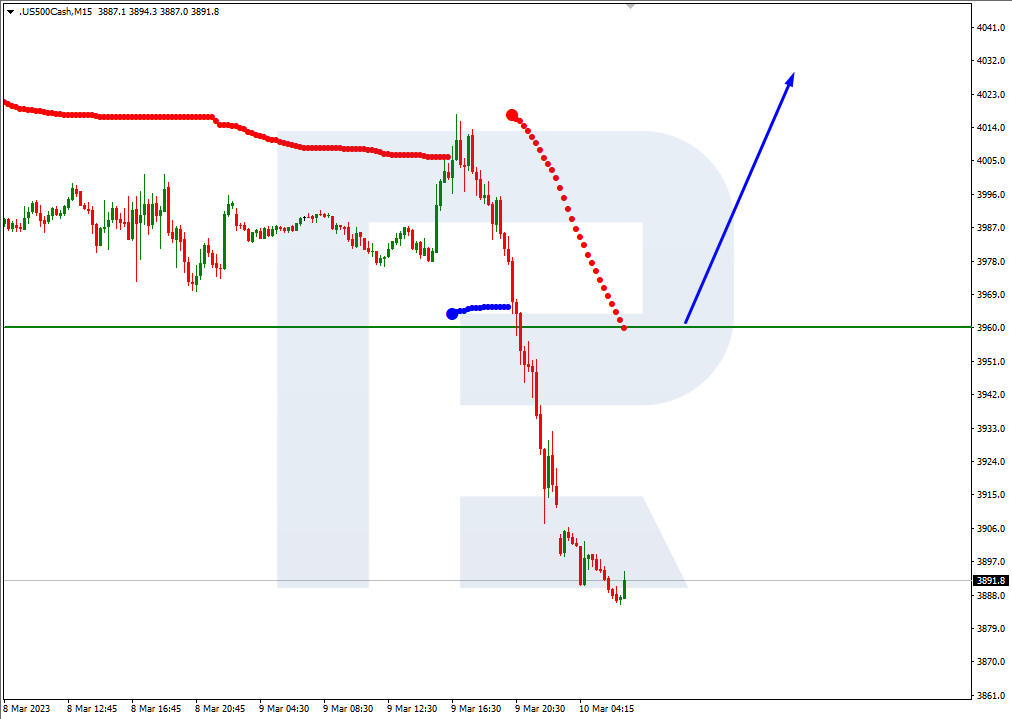
On H4, the S&P 500 index quotes and the RSI are in the oversold area, which points on a possible increase in the price. The quotes are expected to rise above 0/8 (3906.2) and then reach the resistance level of 2/8 (3984.4). The scenario can be cancelled by a downward breakaway of the support at -1/8 (3867.2). In this case, quotes might drop to -2/8 (3828.1).
On M15, a breakaway of the upper border of VoltyChannel will increase the probability of an increase in the price.
Attention! Forecasts presented in this section only reflect the author’s private opinion and should not be considered as guidance for trading. RoboForex LP bears no responsibility for trading results based on trading recommendations described in these analytical reviews.
Our dependence on fossil fuels is one of the biggest challenges to overcome in the fight against climate change. But production and consumption of fossil fuels is on the rise, and expected to peak within the next decade.
In this episode of The Conversation Weekly, we speak to two researchers who examine the political challenges of transitioning to a world after oil, and what it means for those states who rely on oil for resources.
Oil is not only used as a fuel, but is integral to everyday life through its applications in plastics, manufacturing processes, fabrics, paints and chemicals. In order to consider alternatives to oil, we need to be aware of the scale of its integration into our lives.
Caleb Wellum is an assistant professor of U.S. history at the University of Toronto Mississauga, Canada.
“I almost hesitate to say this, because this kind of depiction of deep dependence on oil has actually been a strategy of oil companies themselves to say, look, you can’t have a modern world, a modern way of life without oil,” Wellum points out. “So this is not to say it’s inescapable, but it’s to say that the challenges are significant to transitioning to some kind of after-oil.”
Defining that transition can be tricky, because it carries different stakes depending on how it is interpreted: does it mean continuing to extract oil “until the last drop,” or finding alternatives right now?
Wellum notes that the 1970s oil crisis was a significant moment in human history that helped shape our current consumption patterns. There was a debate between environmentalists and economists that signalled a moment at the crossroads for our current relationship with oil.
“I noticed there was a need to transition away from oil. And there was also a free market argument that argued the energy crisis was a sign of bad government policy of governments intervening in markets and making it inefficient,” he said. “Eventually, this market argument won out and there was no energy transition.”
There was a growing awareness of the environmental impact of the extraction and consumption of fossil fuels, and the urgent need to combat climate change to reduce global warming. And recently, governments around the world — including in countries dependent on oil revenues — are committing to finding energy alternatives.
“There’s a focus on spectacular sustainability projects, and by that you see the scale and the size is just enormous. And that’s what spectacle does — it’s supposed to attract a lot of attention because the size range of the project is really quite impressive,” Koch said.
But these ambitious alternative energy projects aren’t all as they seem, she cautions. Koch describes how a solar farm in the desert in Morocco — one of the largest such projects in the world — is facing challenges because of the amount of water required.
A PBS report on the world’s largest solar farm in Morocco.
To transition to a world post-oil, whatever that may look like, requires more than successful and sustainable alternative technologies.
“There are a lot of factors that go into why it is that we’re dependent on oil, but they’re not just about the convenience of the source of energy,” Wellum points out. “It’s about political decisions.”
Listen to the full episode of The Conversation Weekly to find out more.
This episode of The Conversation Weekly was produced and written by Mend Mariwany, who is also the show’s executive producer. Sound design is by Eloise Stevens, and our theme music is by Neeta Sarl.