By InvestMacro
Here are the latest charts and statistics for the Commitment of Traders (COT) reports data published by the Commodities Futures Trading Commission (CFTC).
The latest COT data is updated through Tuesday June 9th and shows a quick view of how large traders (for-profit speculators and commercial hedgers) were positioned in the futures markets.
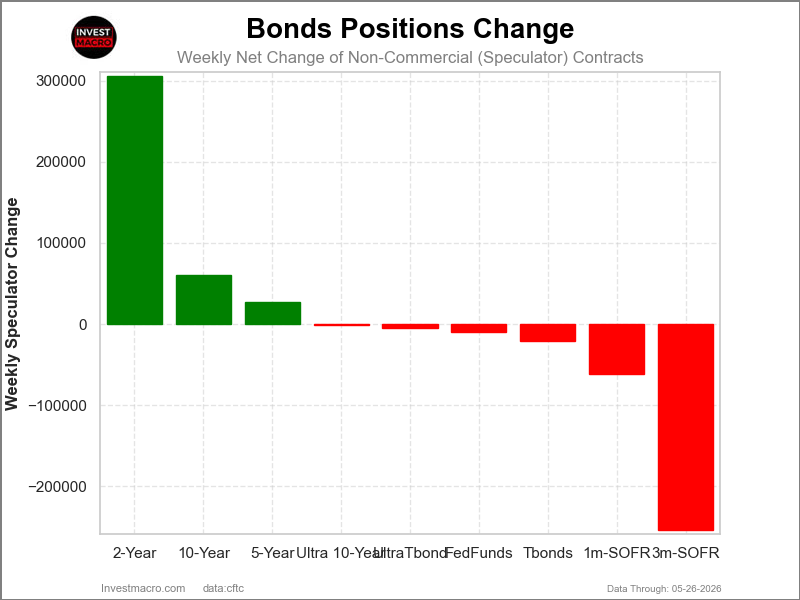
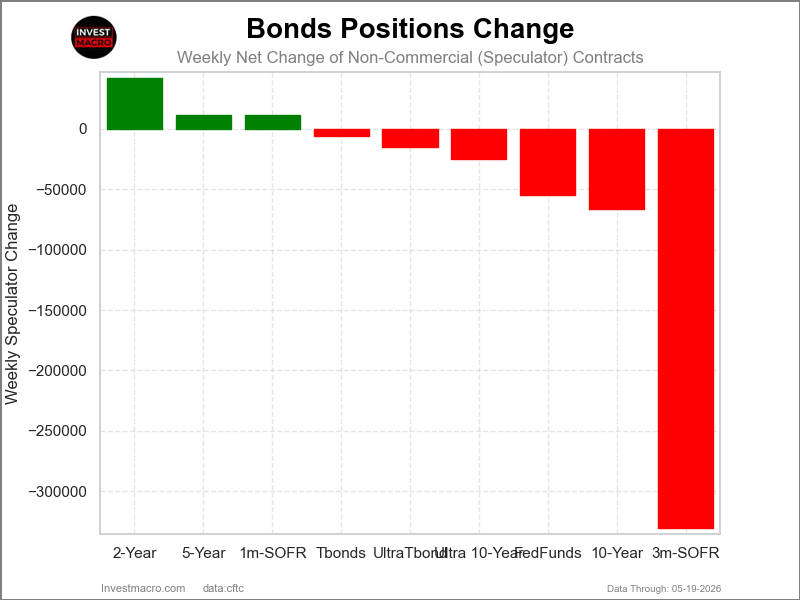
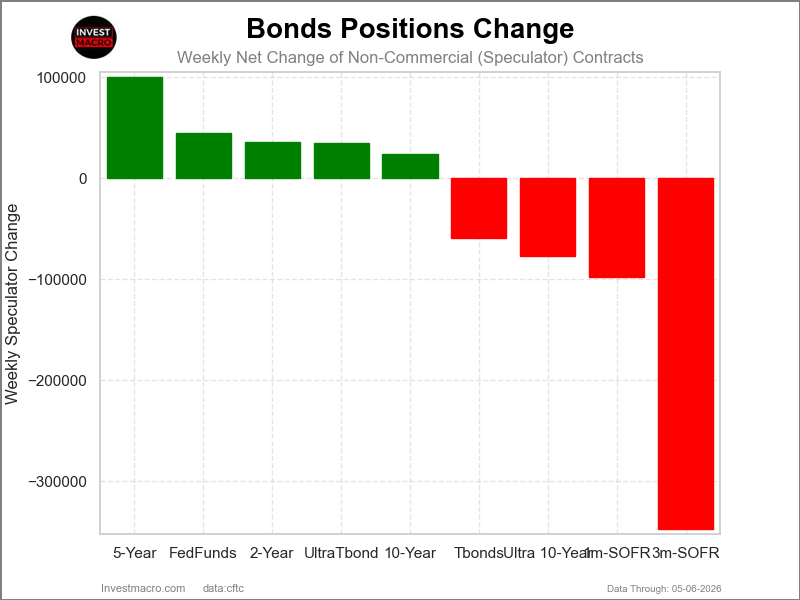
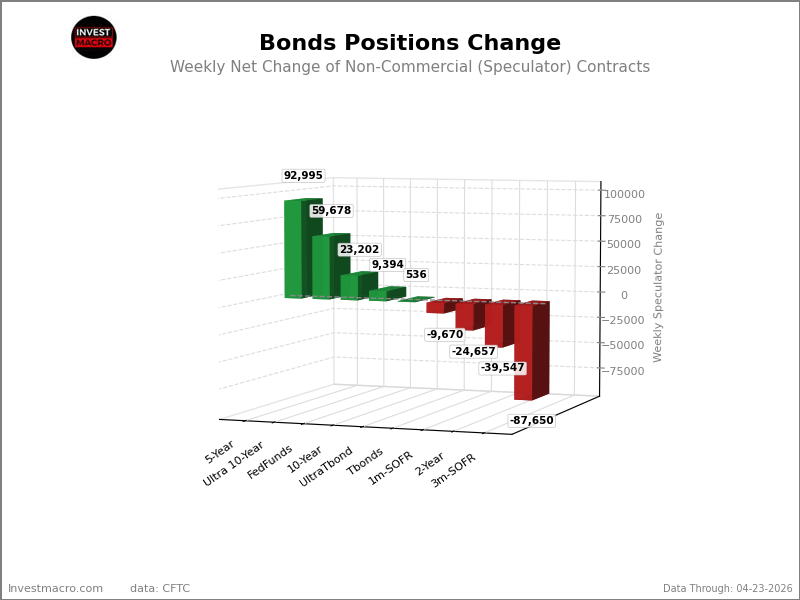
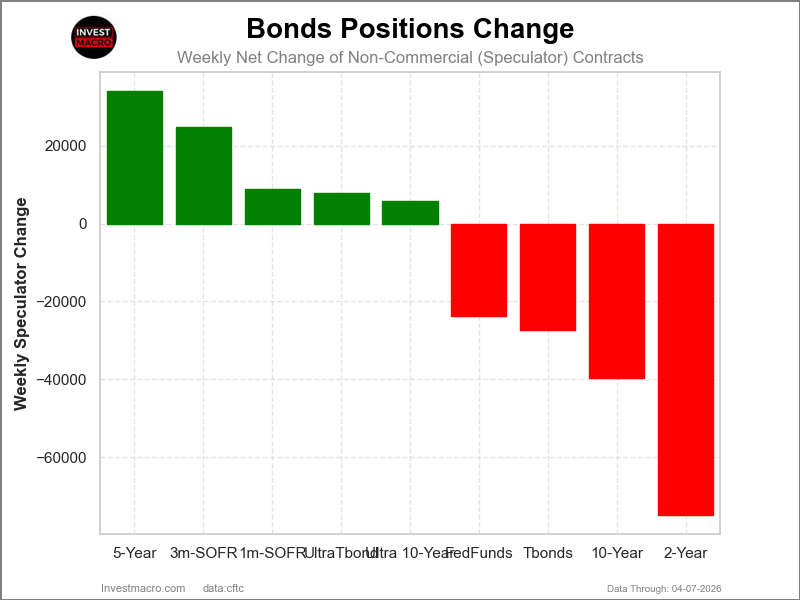
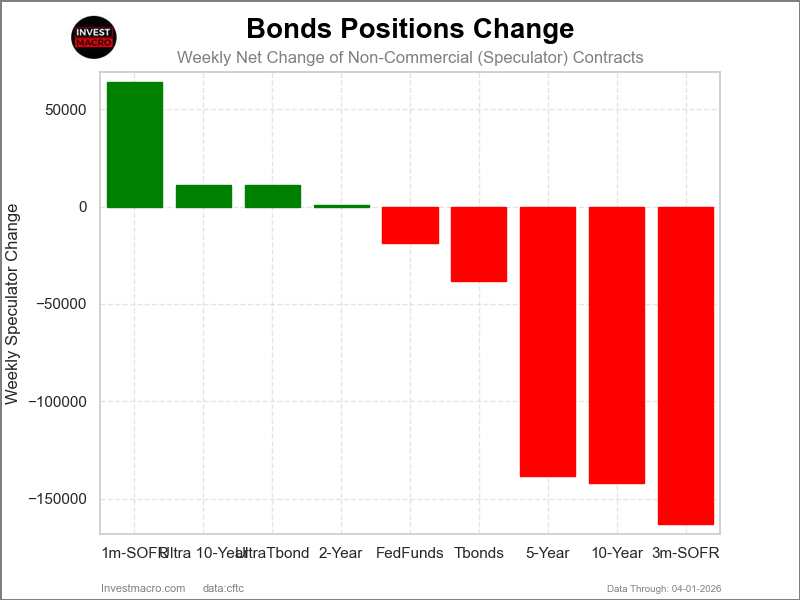
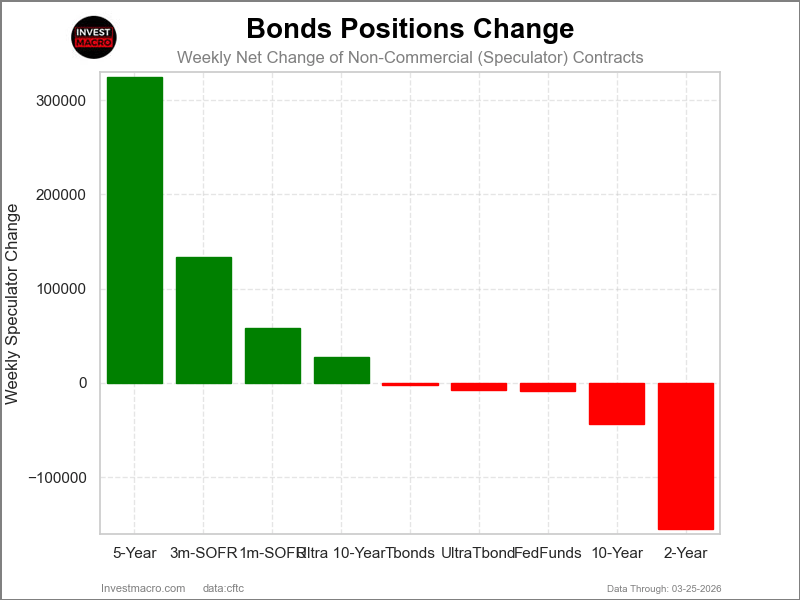
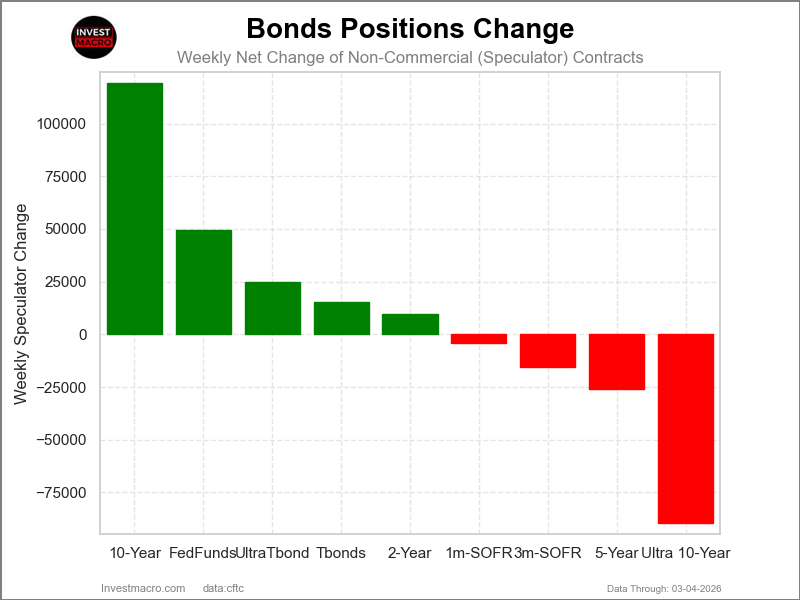
Weekly Speculator Changes led by 2-Year Bonds & Ultra 10-Year Bonds
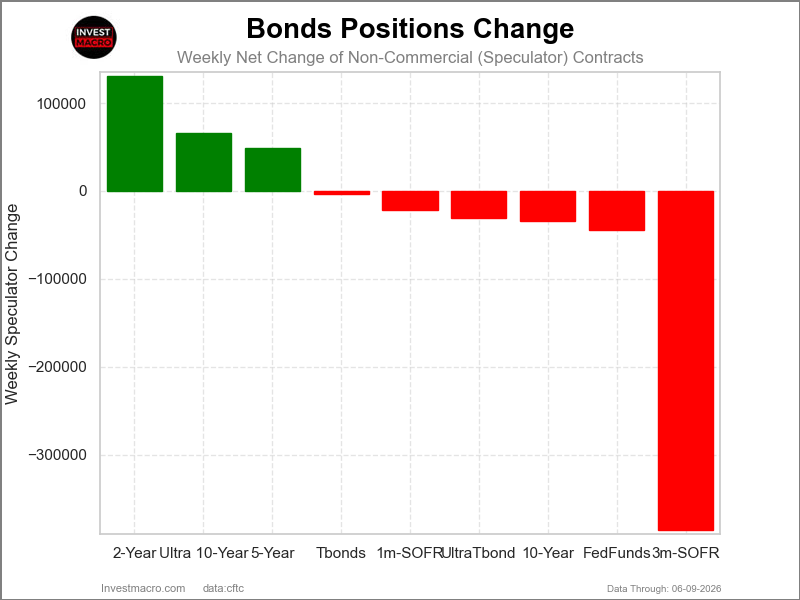
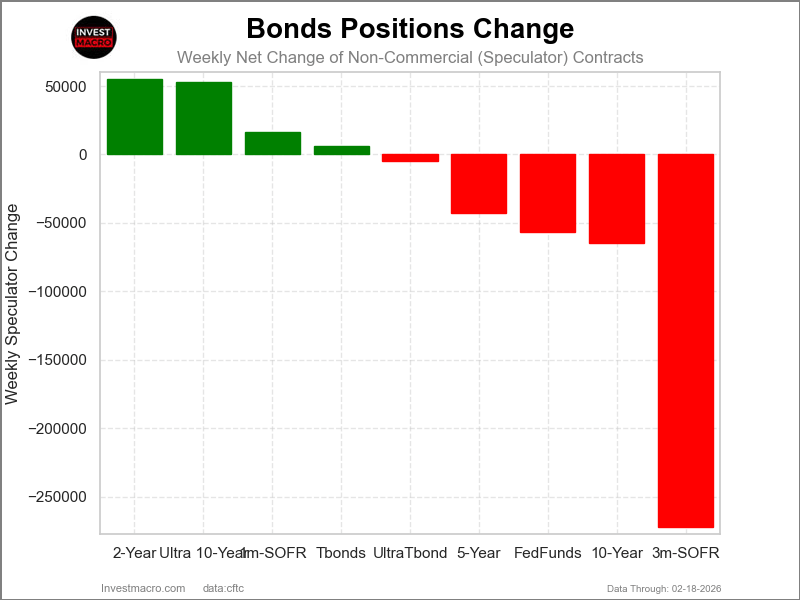
The COT bond market speculator bets were overall lower this week as three out of the nine bond markets we cover had higher positioning while the other six markets had lower speculator contracts.
Leading the gains for the bond markets was the 2-Year Bonds (130,350 contracts) with the Ultra 10-Year Bonds (65,983 contracts) and the 5-Year Bonds (49,056 contracts) also showing positive weeks.
The bond markets with declines in speculator bets for the week were the SOFR 3-Months (-385,462 contracts), the Fed Funds (-44,731 contracts), the 10-Year Bonds (-34,232 contracts), the Ultra Treasury Bonds (-31,021 contracts), the SOFR 1-Month (-21,633 contracts) and with the US Treasury Bonds (-3,452 contracts) also registering lower bets on the week.
US Treasury Bond leads Bond market price gains
The biggest price performance mover this week was the long US Treasury Bond, which rose by almost 1% with a 0.93% increase. Next up, the 10-Year Note was a little higher with a 0.59% rise, followed by the Five-Year Bond, which was up by 0.44%. The Two-Year Bond managed to rise by 0.20%, while the Fed Funds was virtually unchanged on the week.
The 3-Month SOFR was unchanged for the past five days, while the 1-Month SOFR dipped ever so slightly at a -0.01%.
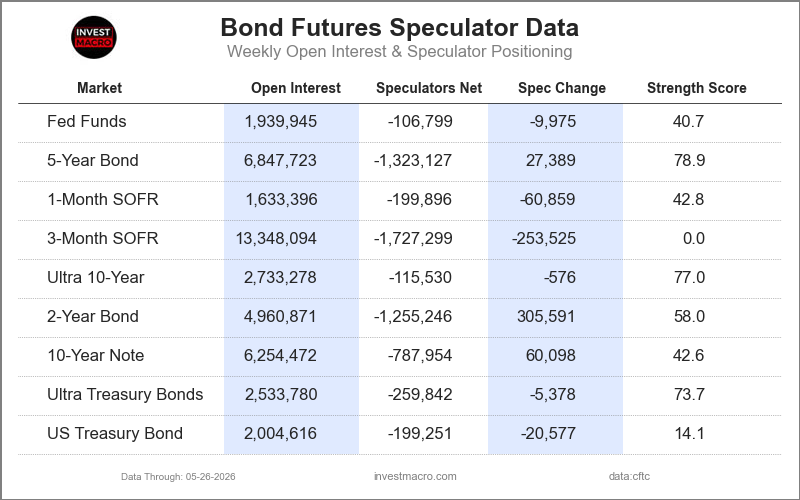
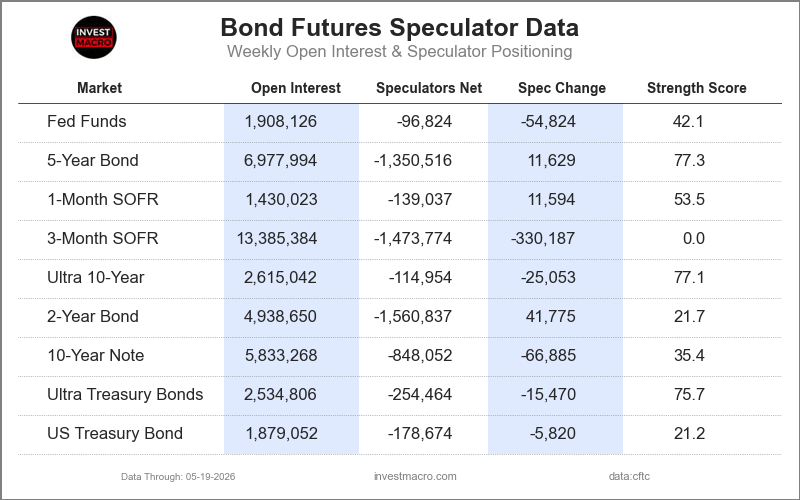
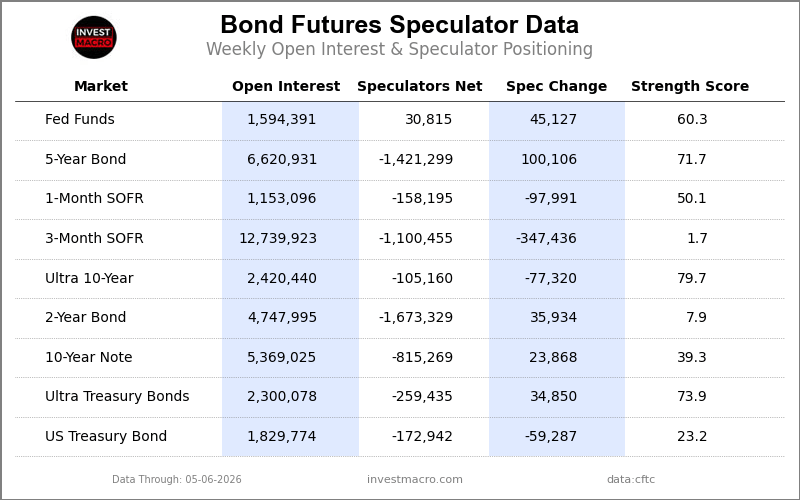
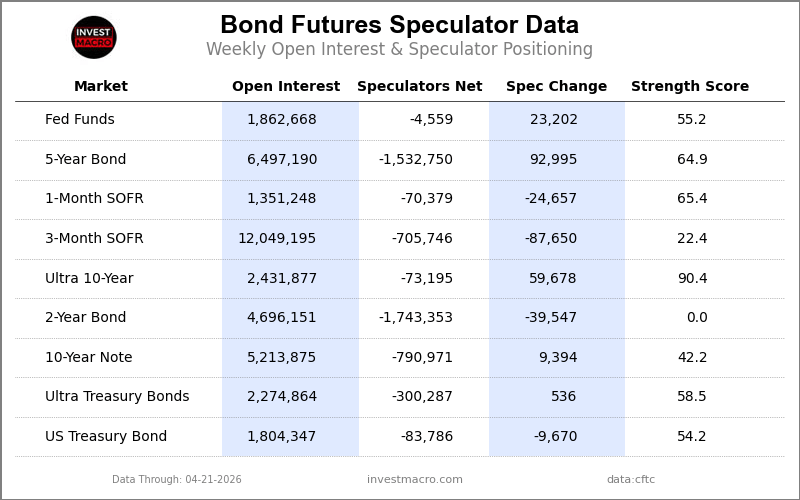
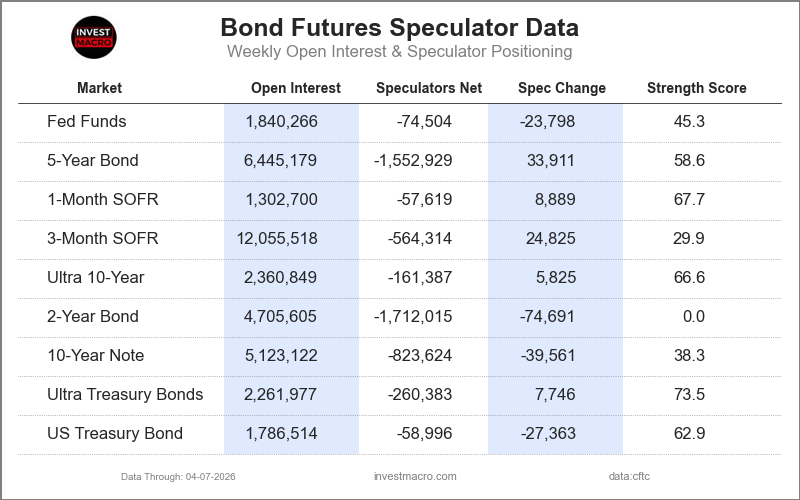
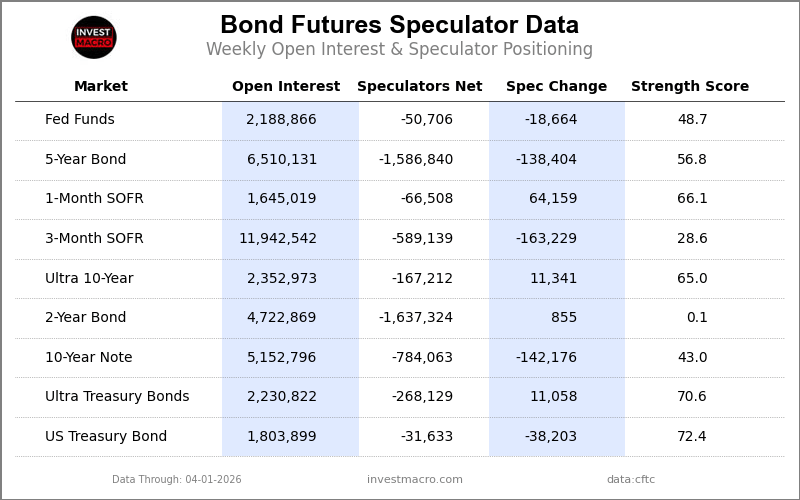
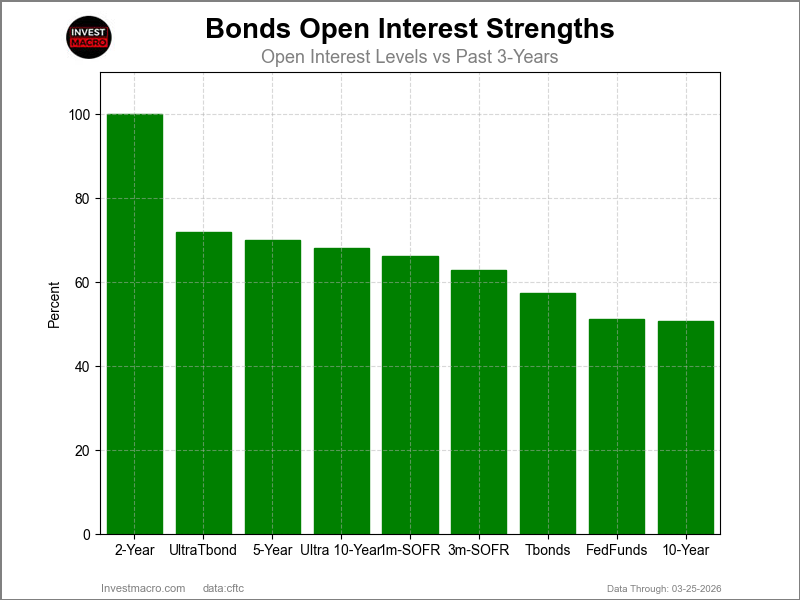
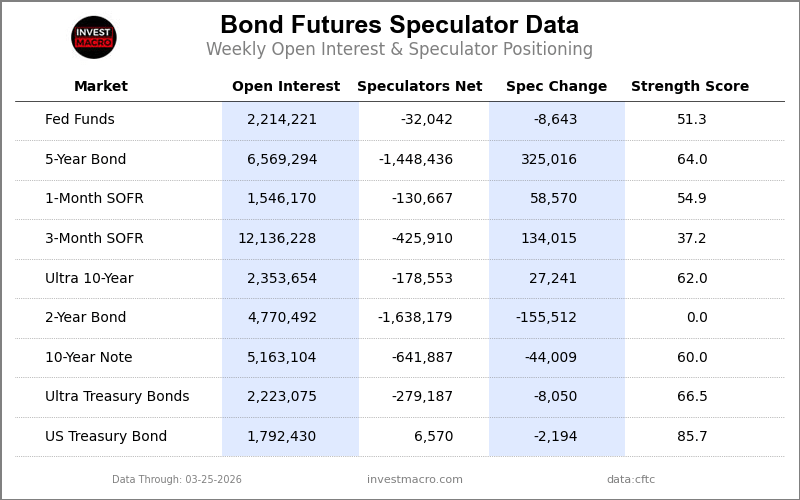
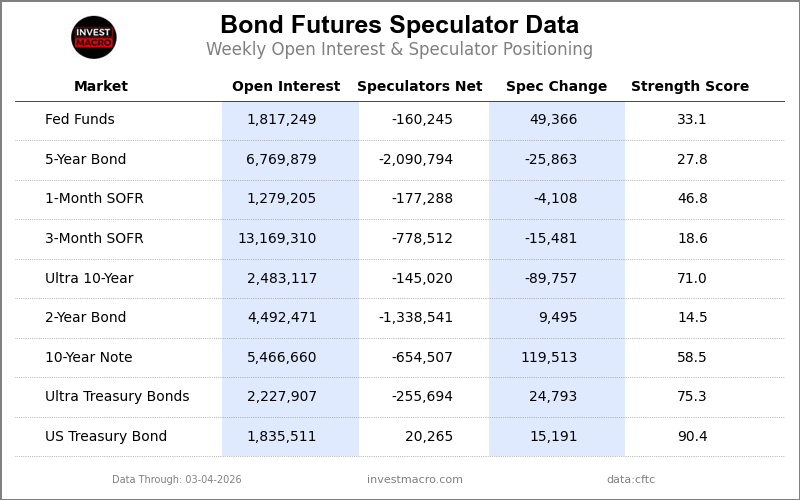
Bonds Data:
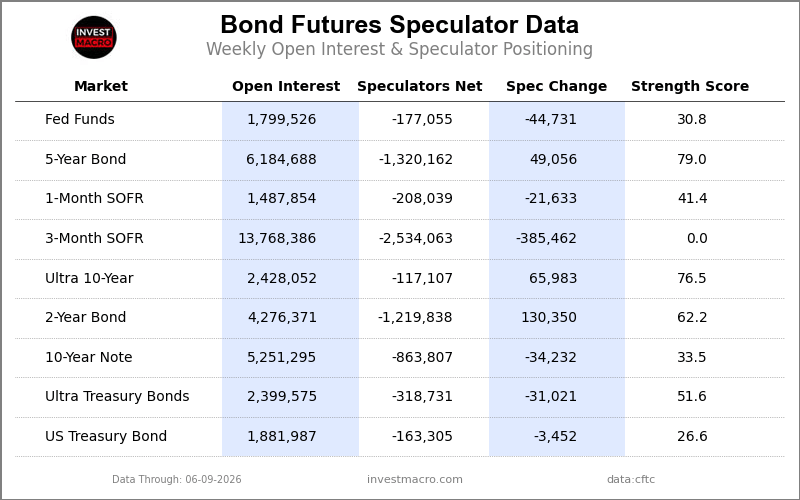
Legend: Open Interest | Speculators Current Net Position | Weekly Specs Change | Specs Strength Score compared to last 3-Years (0-100 range)
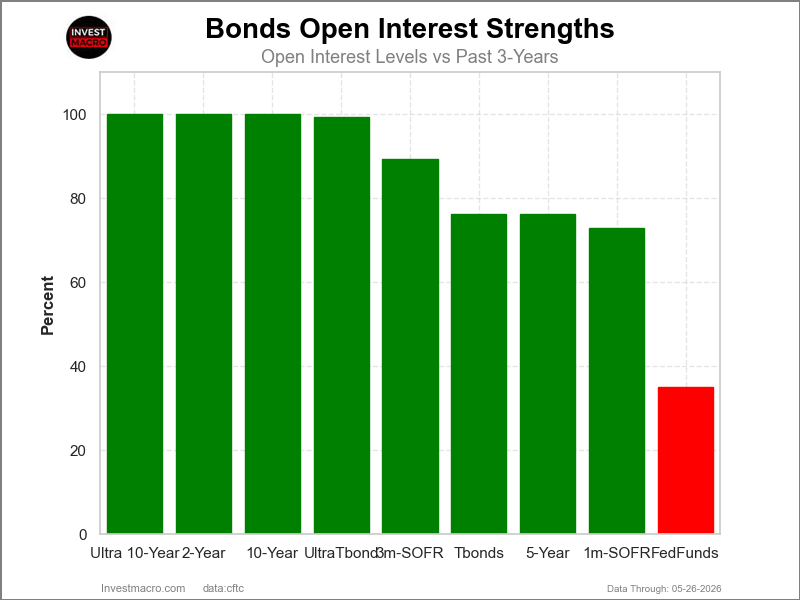
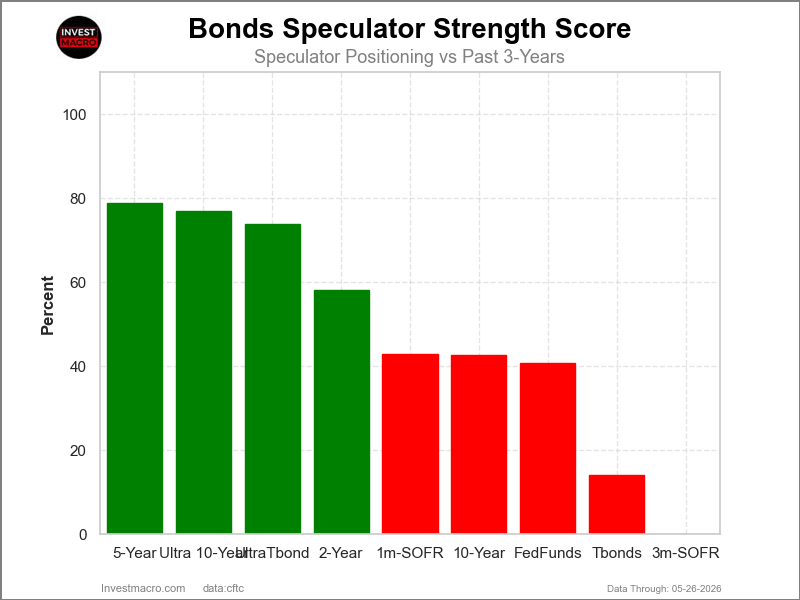
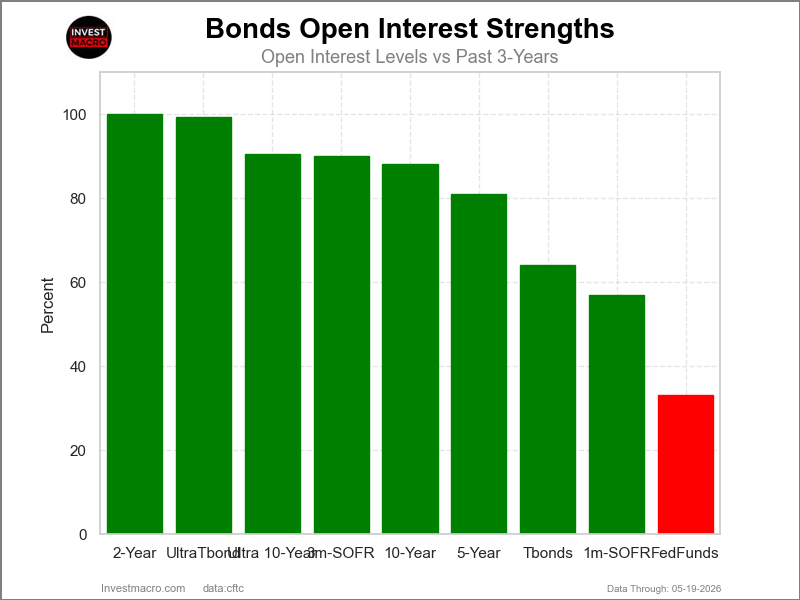
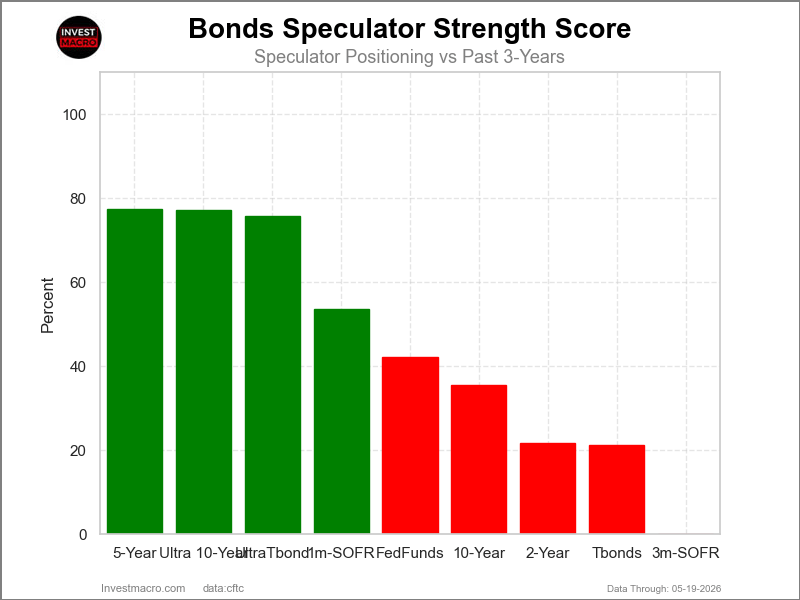
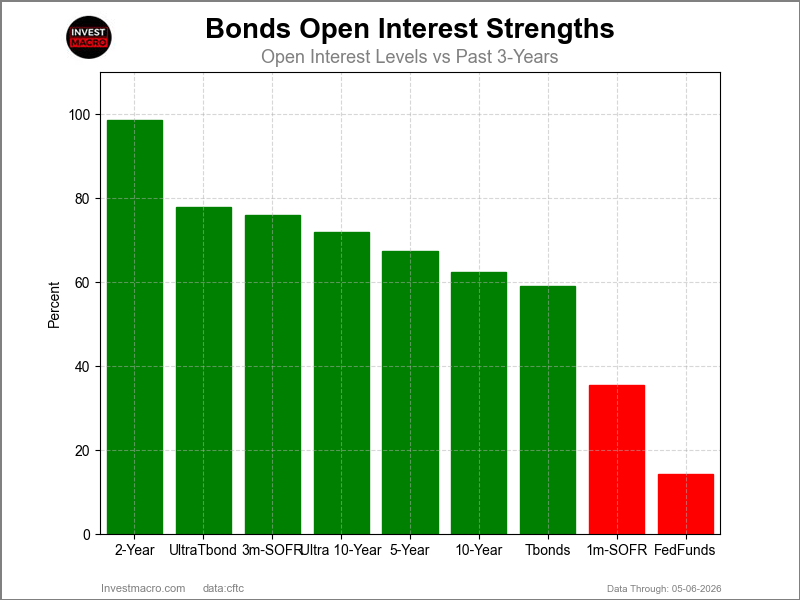
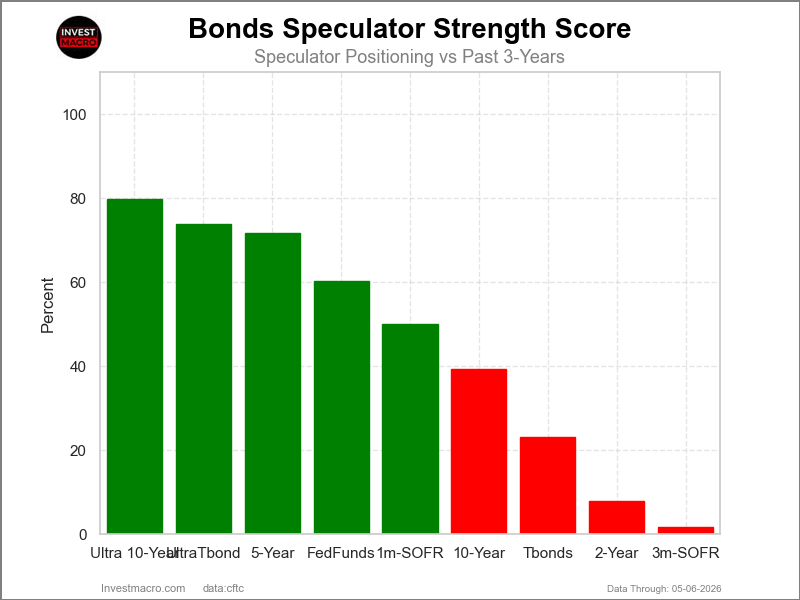
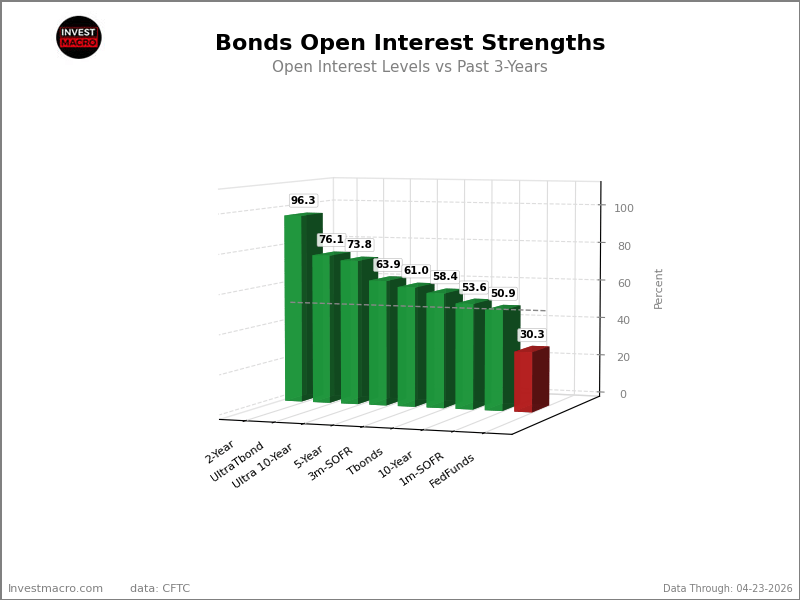
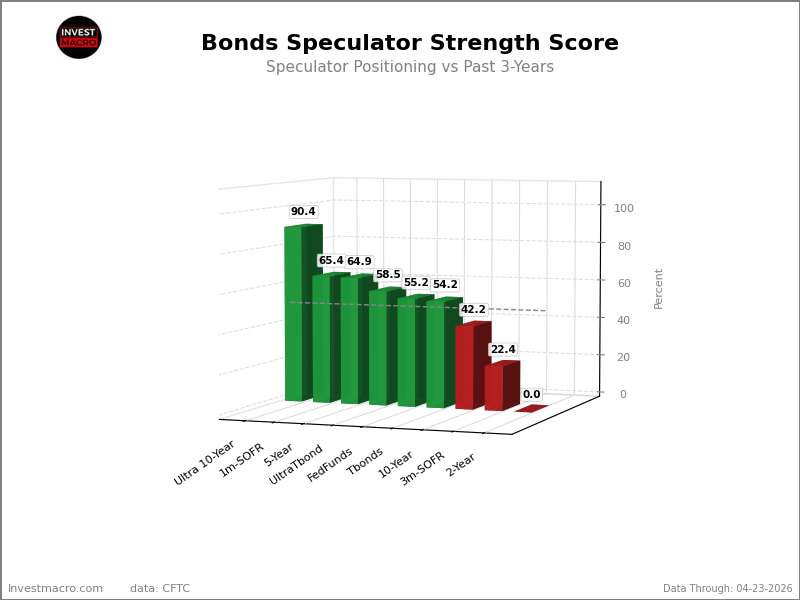
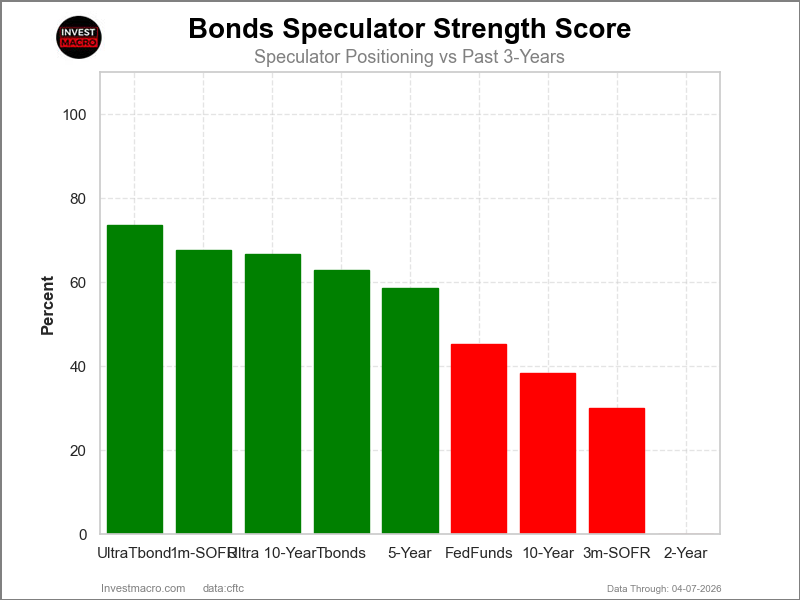
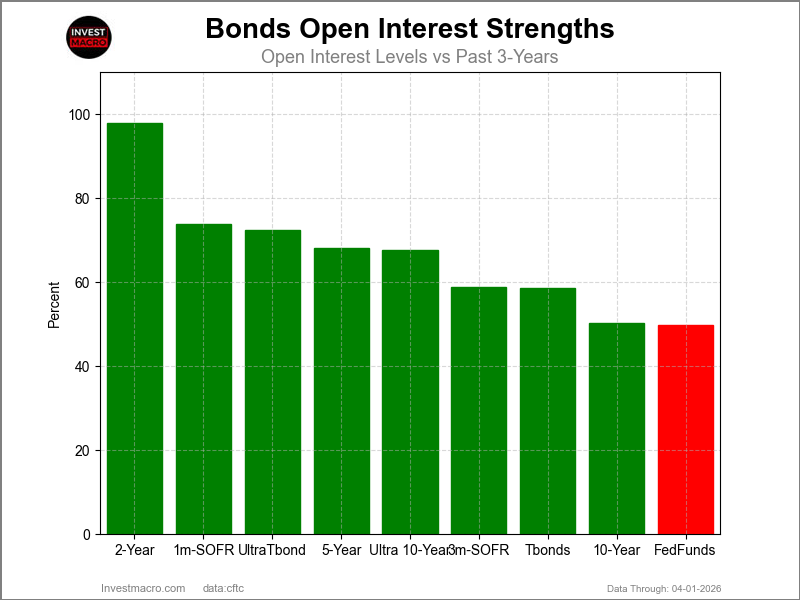
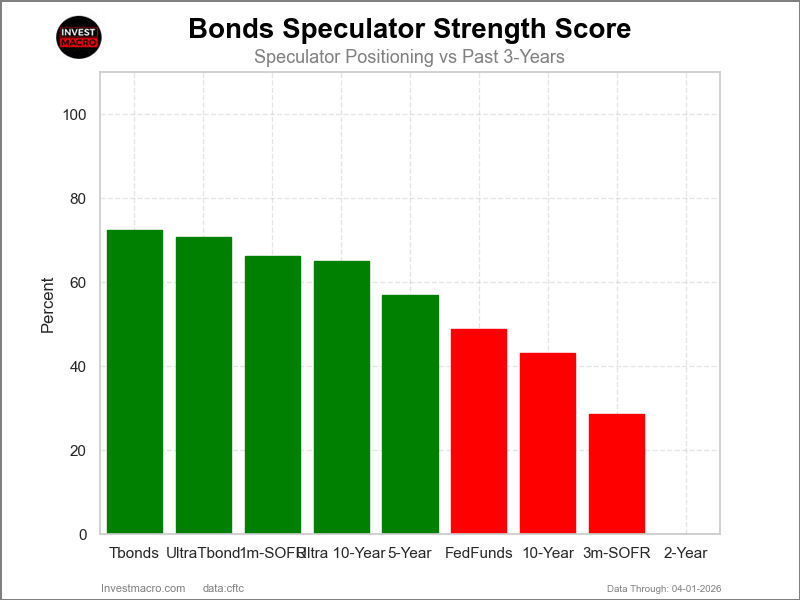
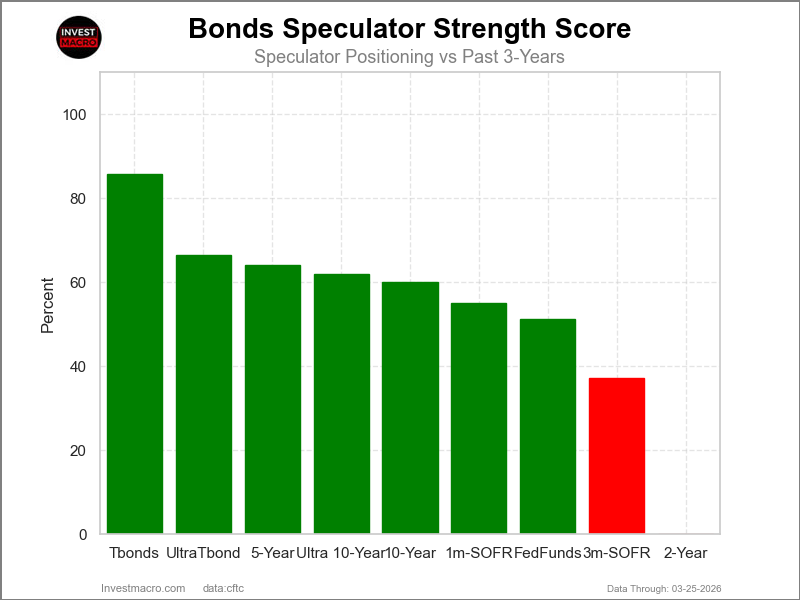
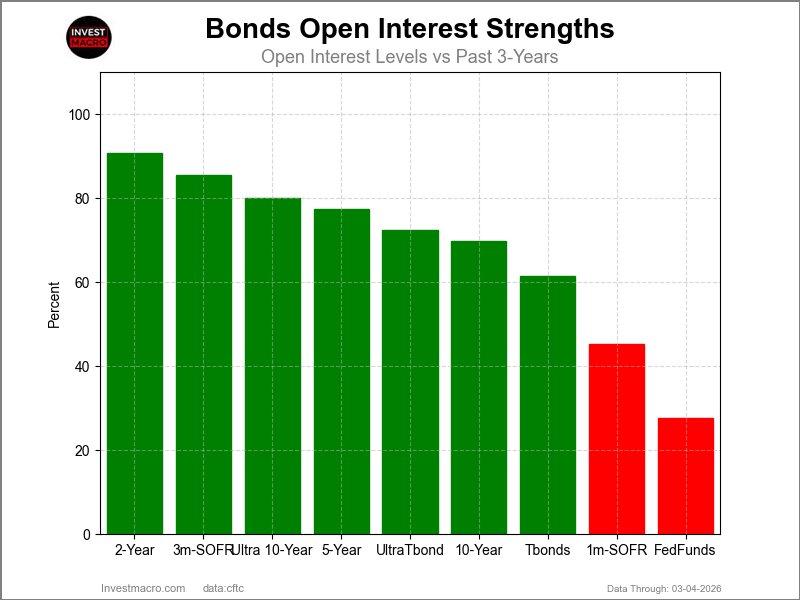
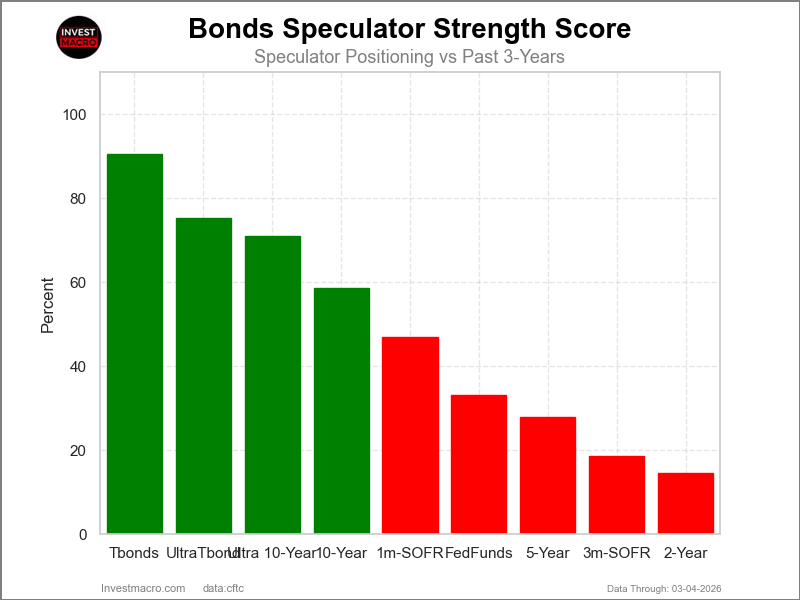
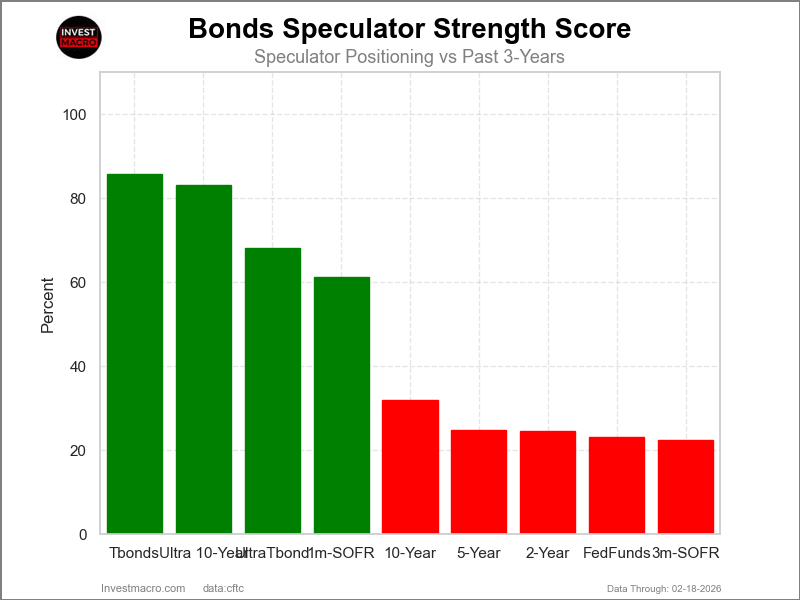
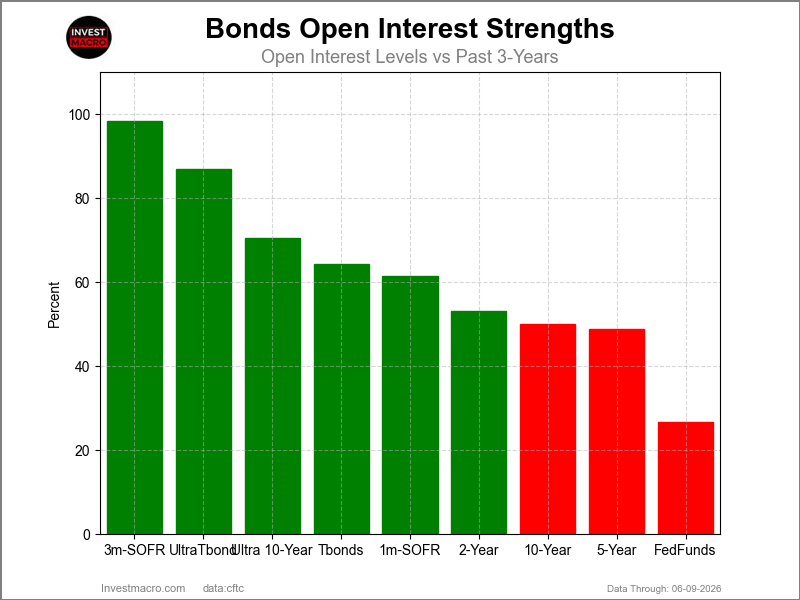
Strength Scores led by 5-Year Bonds & Ultra 10-Year Bonds
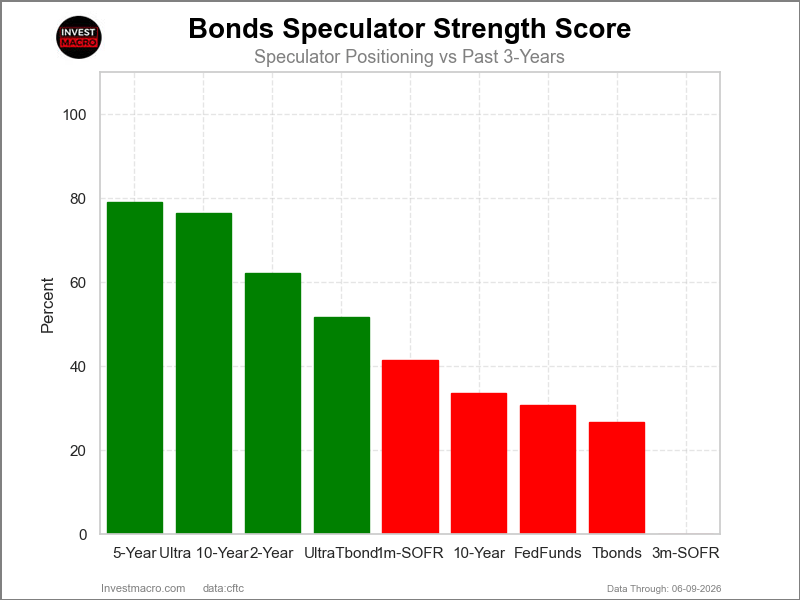
COT Strength Scores (a normalized measure of Speculator positions over a 3-Year range, from 0 to 100 where above 80 is Extreme-Bullish and below 20 is Extreme-Bearish) showed that the 5-Year Bonds (79 percent) and the Ultra 10-Year Bonds (77 percent) lead the bond markets this week. The 2-Year Bonds (62 percent) comes in as the next highest in the weekly strength scores.
On the downside, the SOFR 3-Months (0.0 percent) comes in at the lowest strength level currently and is in Extreme-Bearish territory (below 20 percent). The next lowest strength scores were the US Treasury Bonds (27 percent) and the Fed Funds (31 percent).
Strength Statistics:
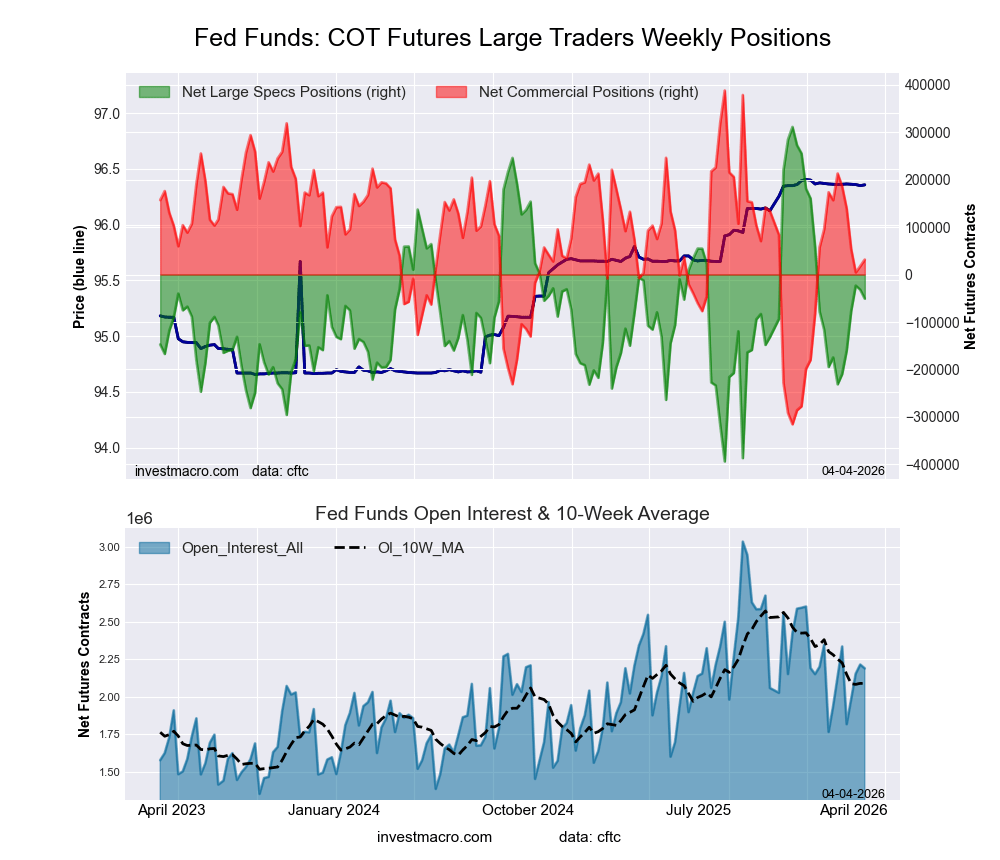
Fed Funds (30.8 percent) vs Fed Funds previous week (37.1 percent)
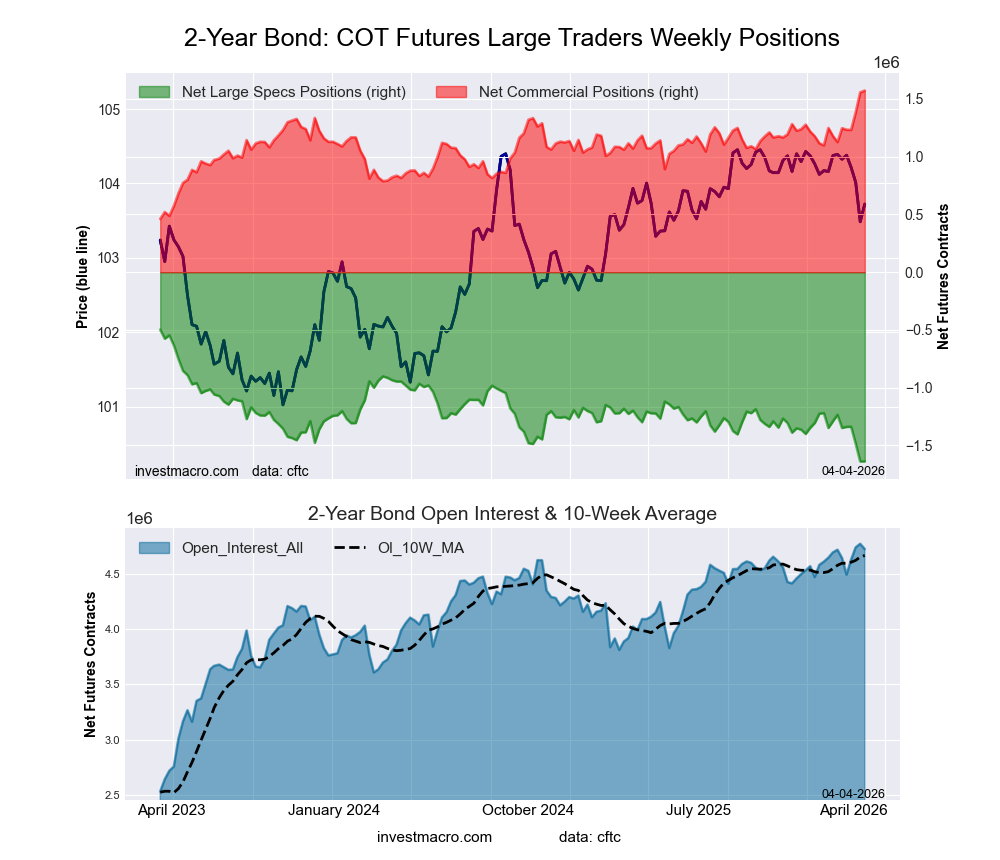
2-Year Bond (62.2 percent) vs 2-Year Bond previous week (46.7 percent)
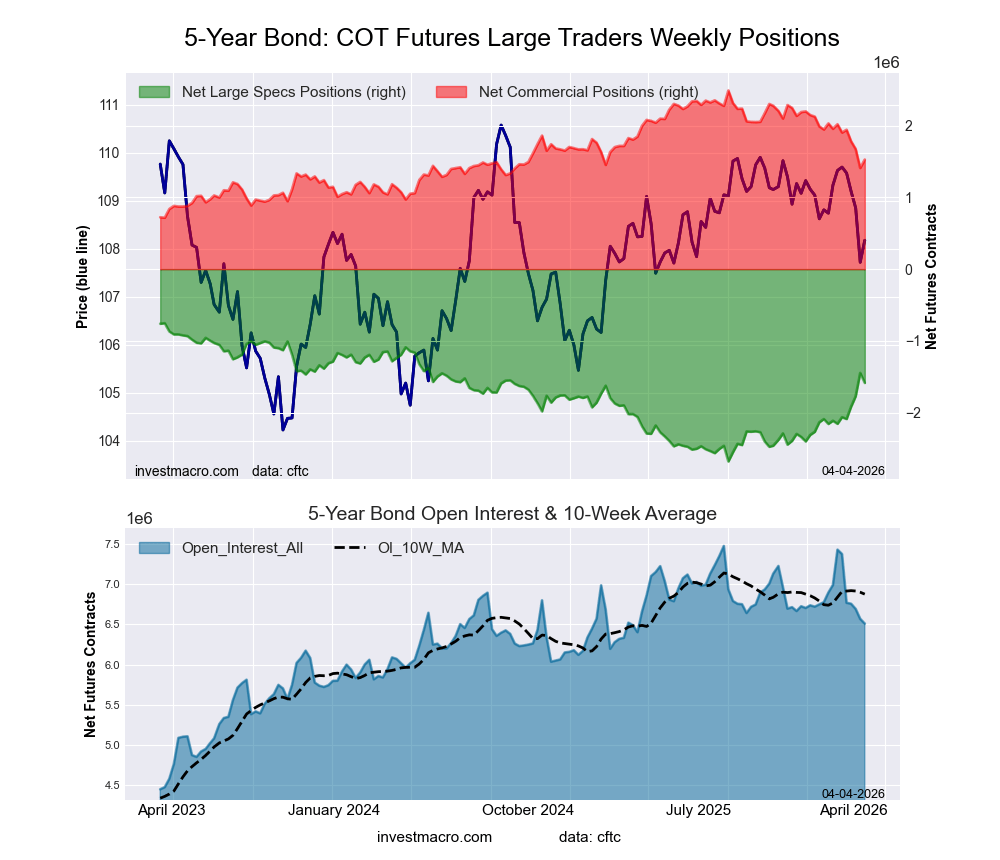
5-Year Bond (79.0 percent) vs 5-Year Bond previous week (76.2 percent)
10-Year Bond (33.5 percent) vs 10-Year Bond previous week (37.6 percent)
Ultra 10-Year Bond (76.5 percent) vs Ultra 10-Year Bond previous week (59.2 percent)
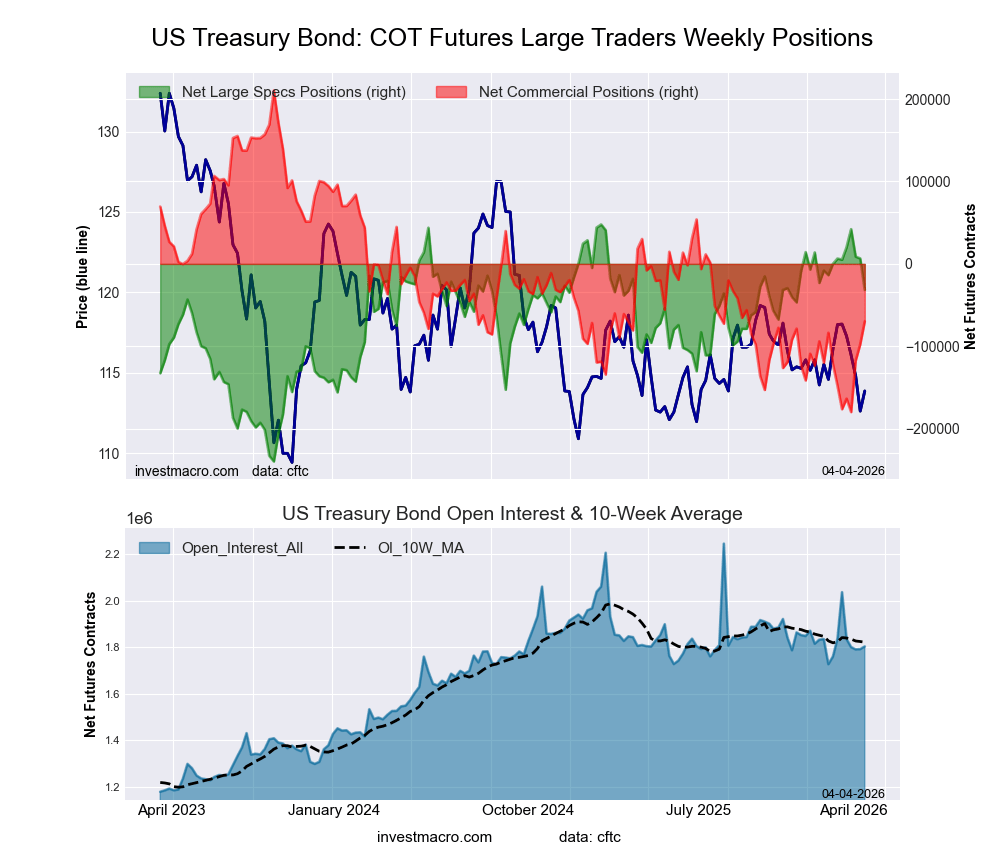
US Treasury Bond (26.6 percent) vs US Treasury Bond previous week (27.8 percent)
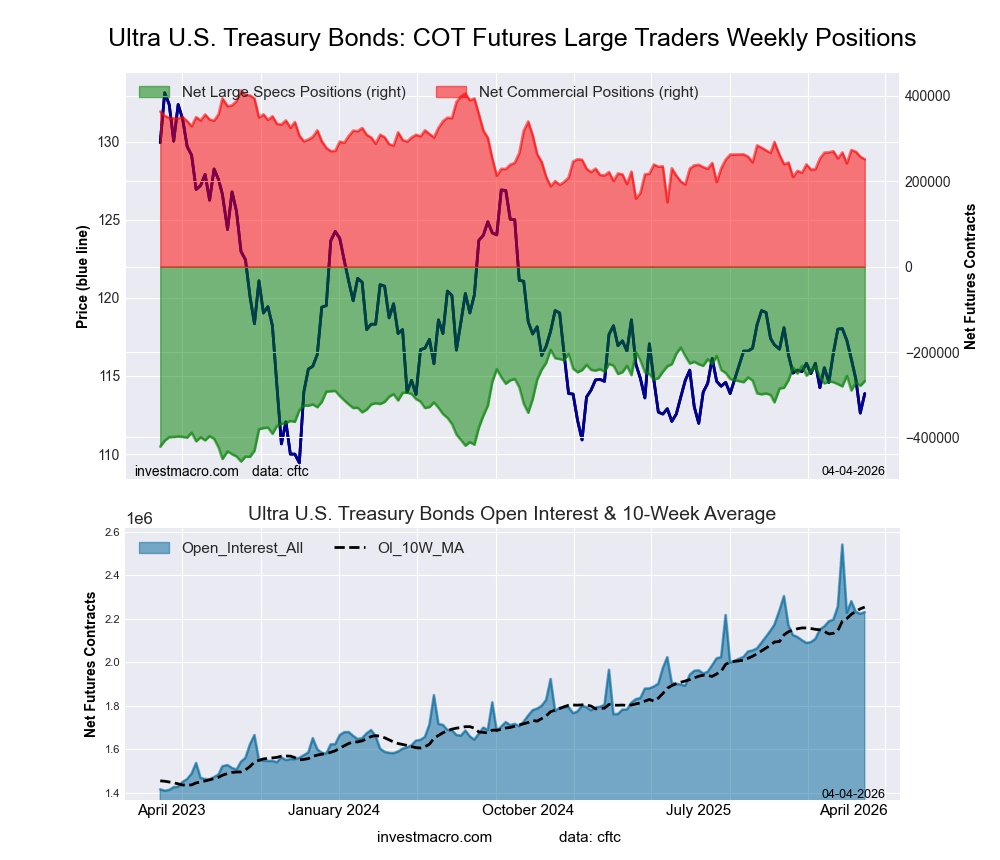
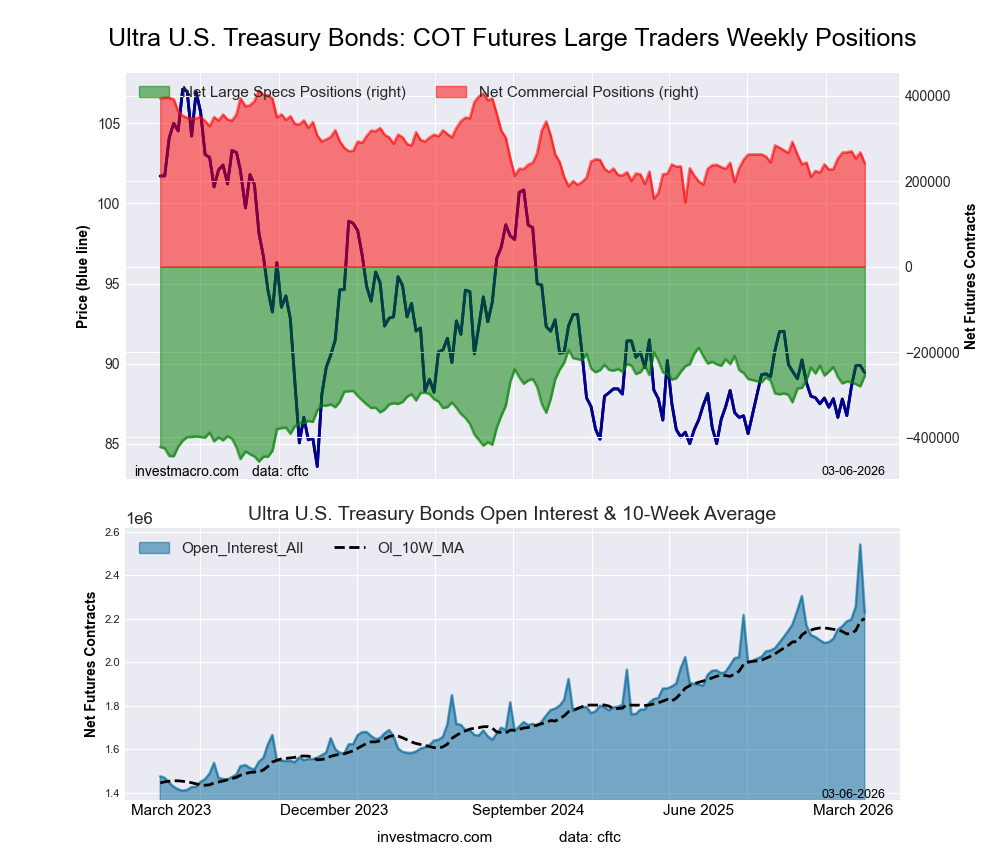
Ultra US Treasury Bond (51.6 percent) vs Ultra US Treasury Bond previous week (63.3 percent)
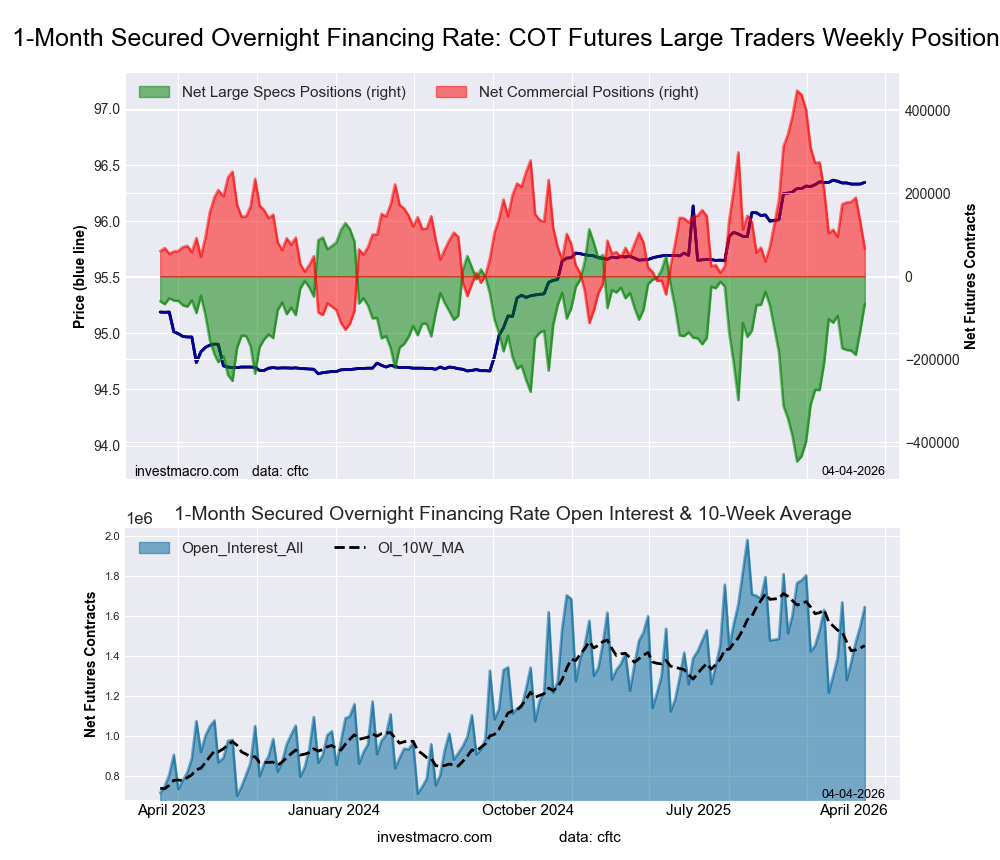
SOFR 1-Month (41.4 percent) vs SOFR 1-Month previous week (45.2 percent)
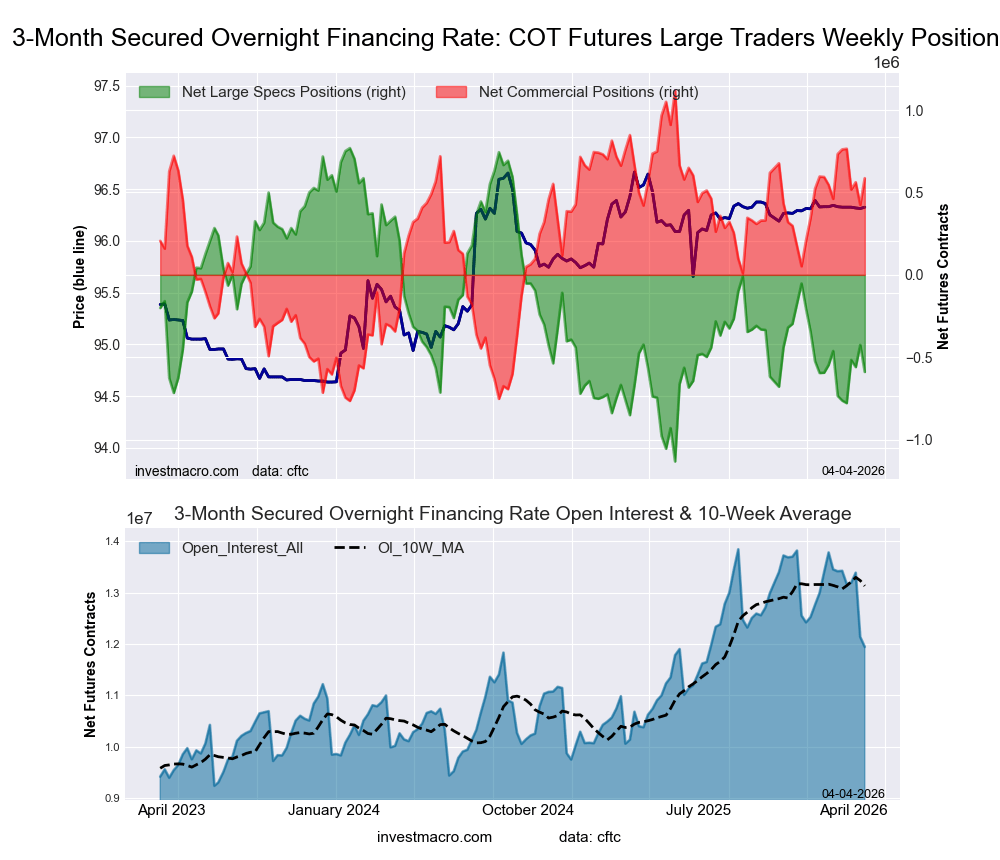
SOFR 3-Months (0.0 percent) vs SOFR 3-Months previous week (11.7 percent)
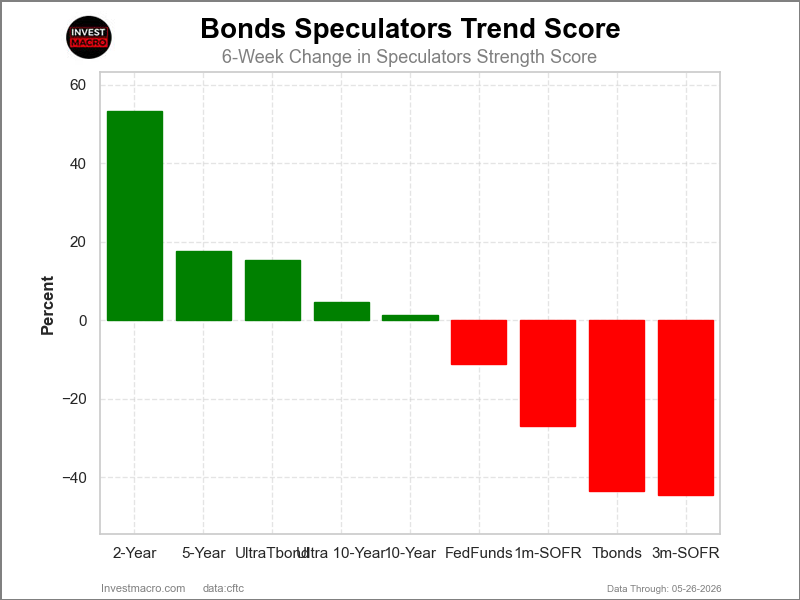
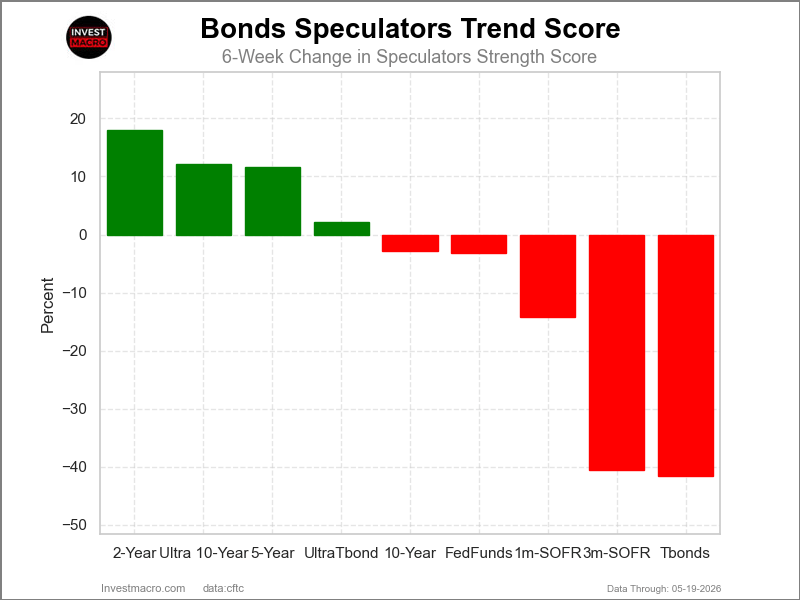
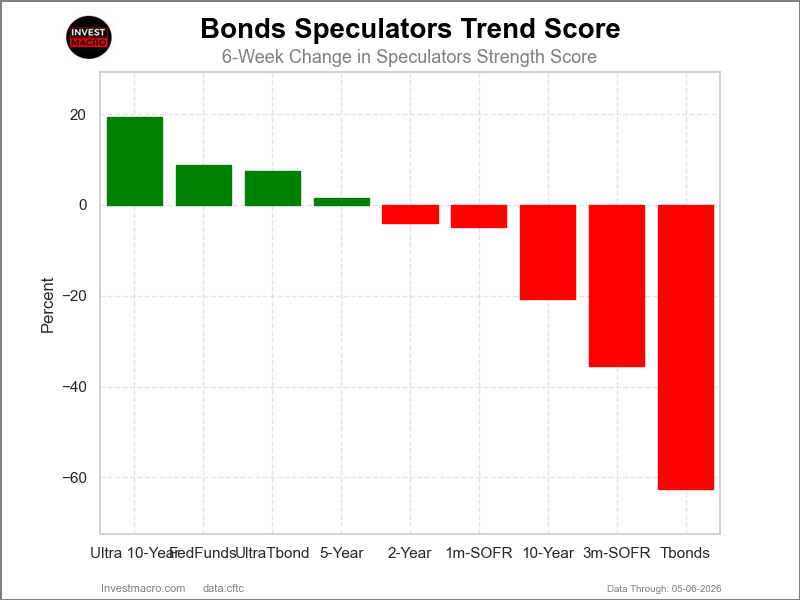
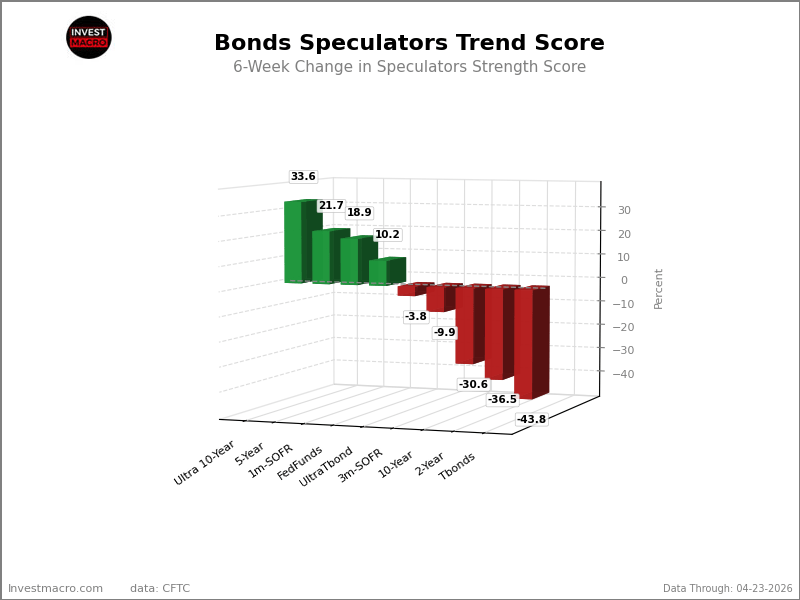
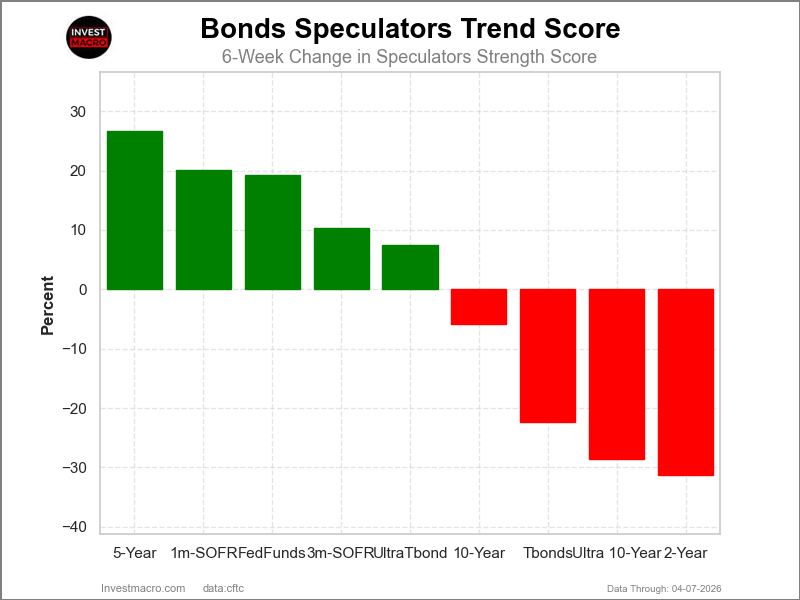
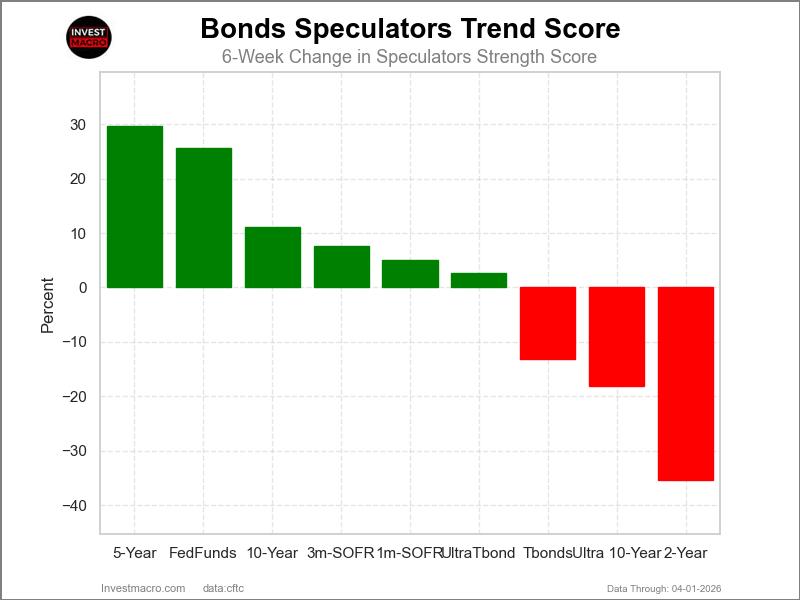
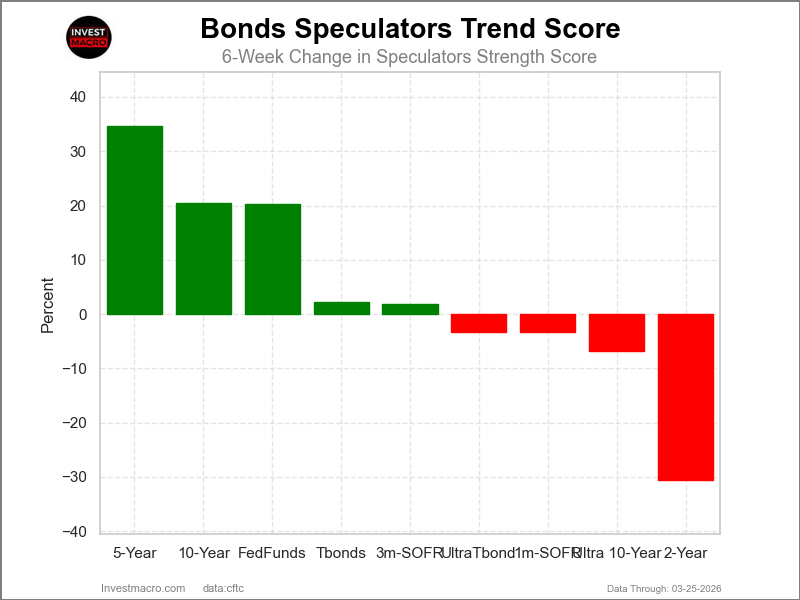
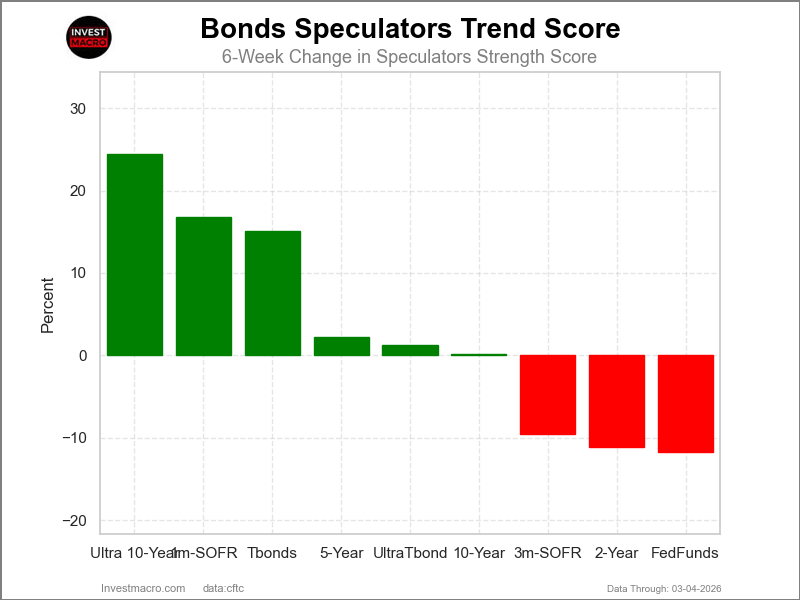
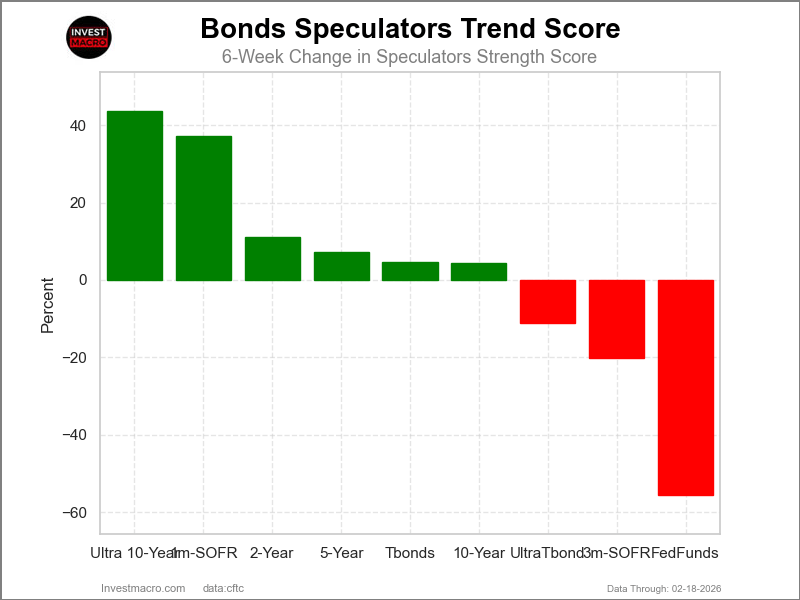
2-Year Bonds & 5-Year Bonds top the 6-Week Strength Trends
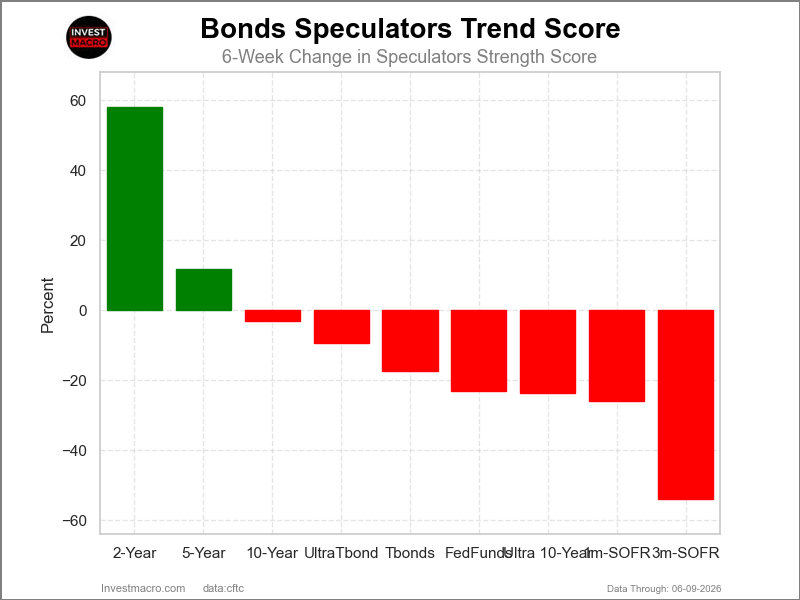
COT Strength Score Trends (or move index, calculates the 6-week changes in strength scores) showed that the 2-Year Bonds (58 percent) and the 5-Year Bonds (12 percent) lead the past six weeks trends for bonds.
The SOFR 3-Months (-53.9 percent) and the SOFR 1-Month (-26 percent) lead the downside trend scores currently.
Strength Trend Statistics:
Fed Funds (-23.1 percent) vs Fed Funds previous week (-18.1 percent)
2-Year Bond (58.1 percent) vs 2-Year Bond previous week (46.7 percent)
5-Year Bond (11.7 percent) vs 5-Year Bond previous week (9.5 percent)
10-Year Bond (-3.0 percent) vs 10-Year Bond previous week (-4.6 percent)
Ultra 10-Year Bond (-23.5 percent) vs Ultra 10-Year Bond previous week (-28.9 percent)
US Treasury Bond (-17.3 percent) vs US Treasury Bond previous week (-26.5 percent)
Ultra US Treasury Bond (-9.2 percent) vs Ultra US Treasury Bond previous week (4.7 percent)
SOFR 1-Month (-25.8 percent) vs SOFR 1-Month previous week (-20.2 percent)
SOFR 3-Months (-53.9 percent) vs SOFR 3-Months previous week (-43.7 percent)
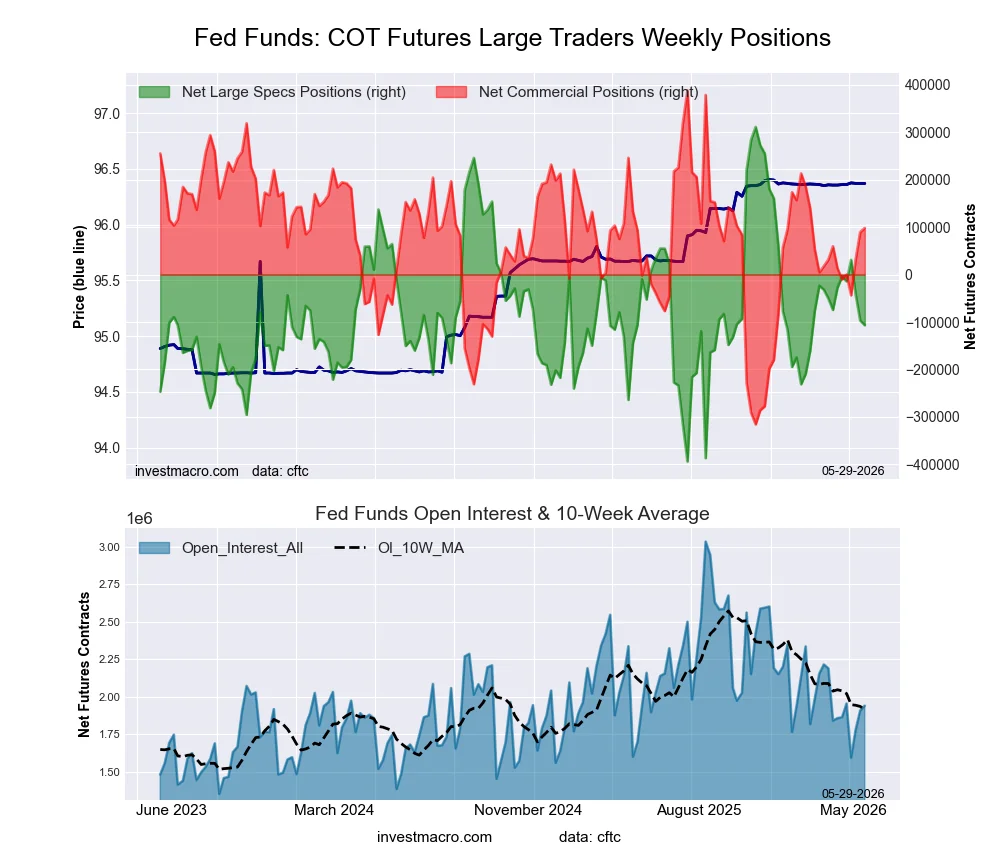
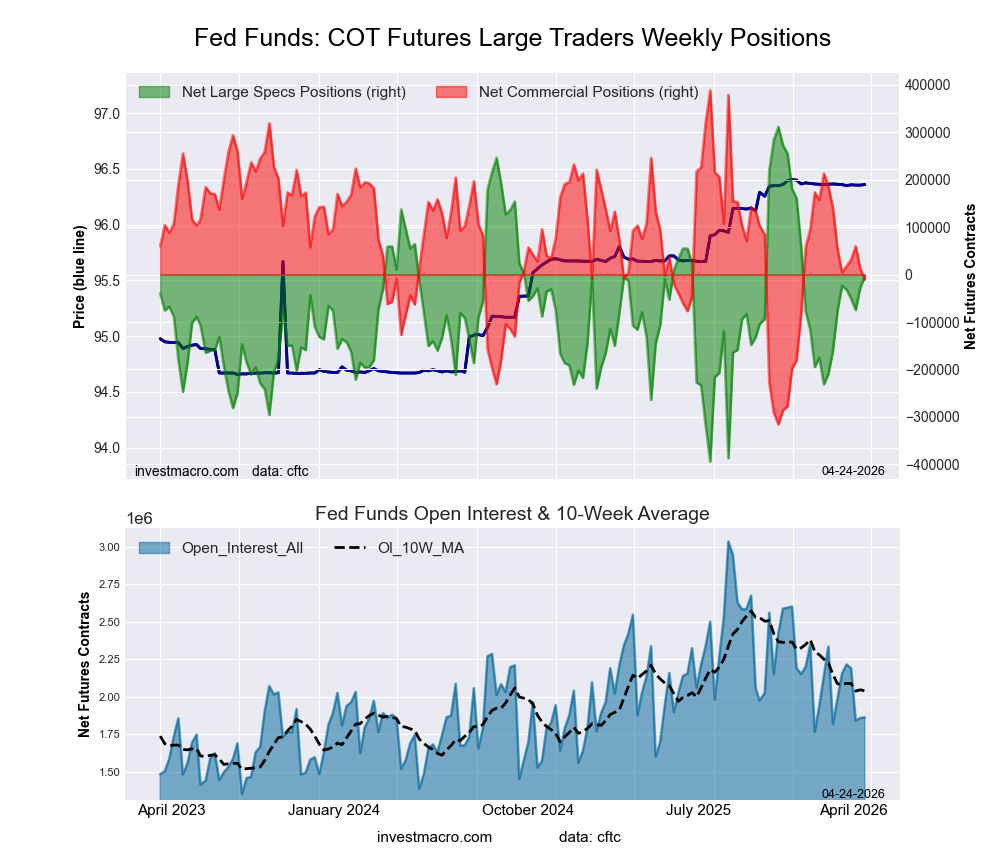
30-Day Federal Funds Futures:
 Positioning Notes:
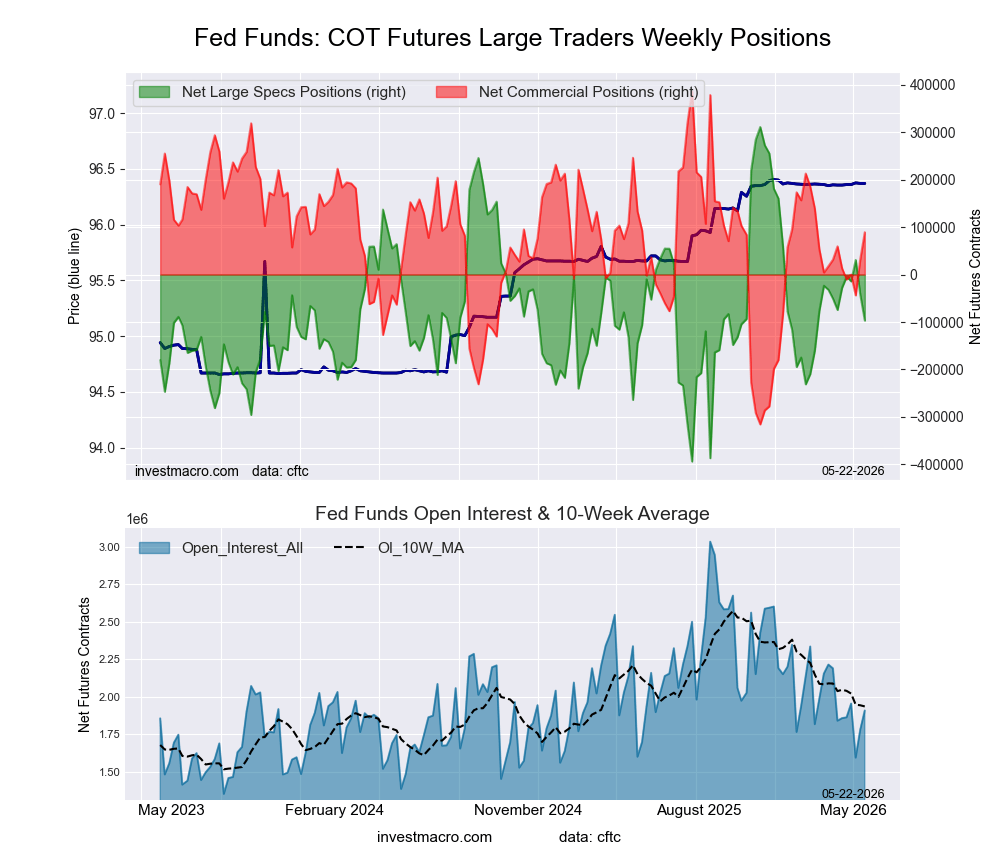
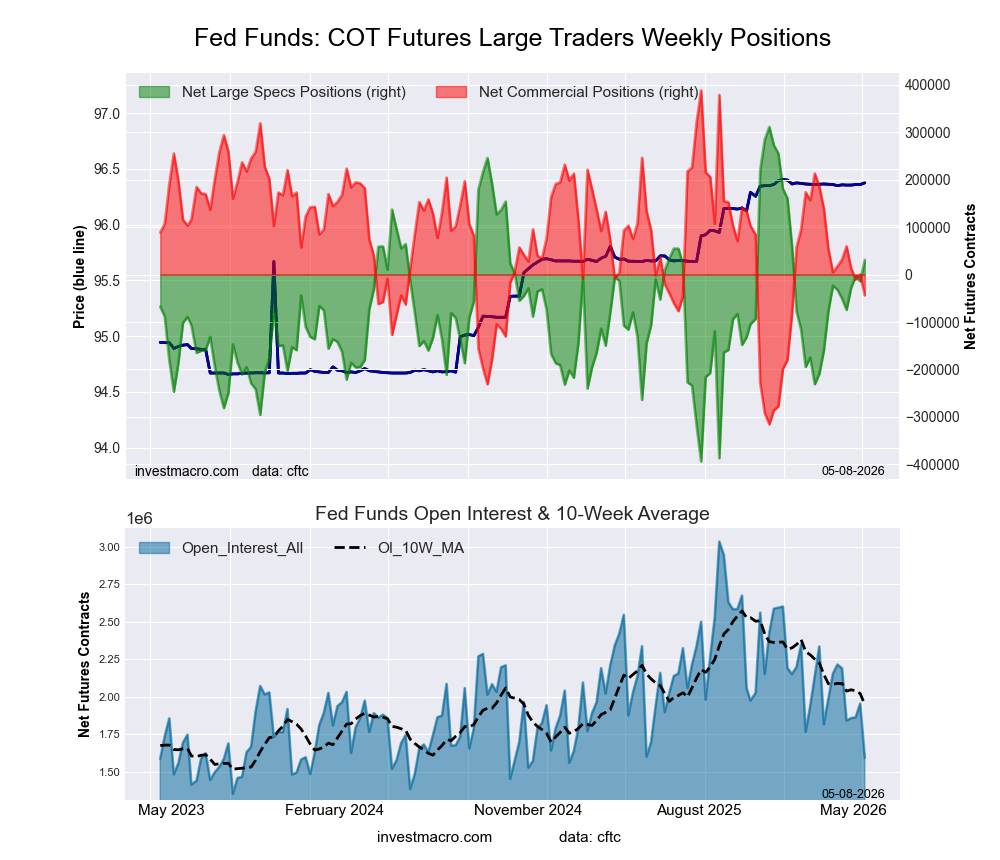
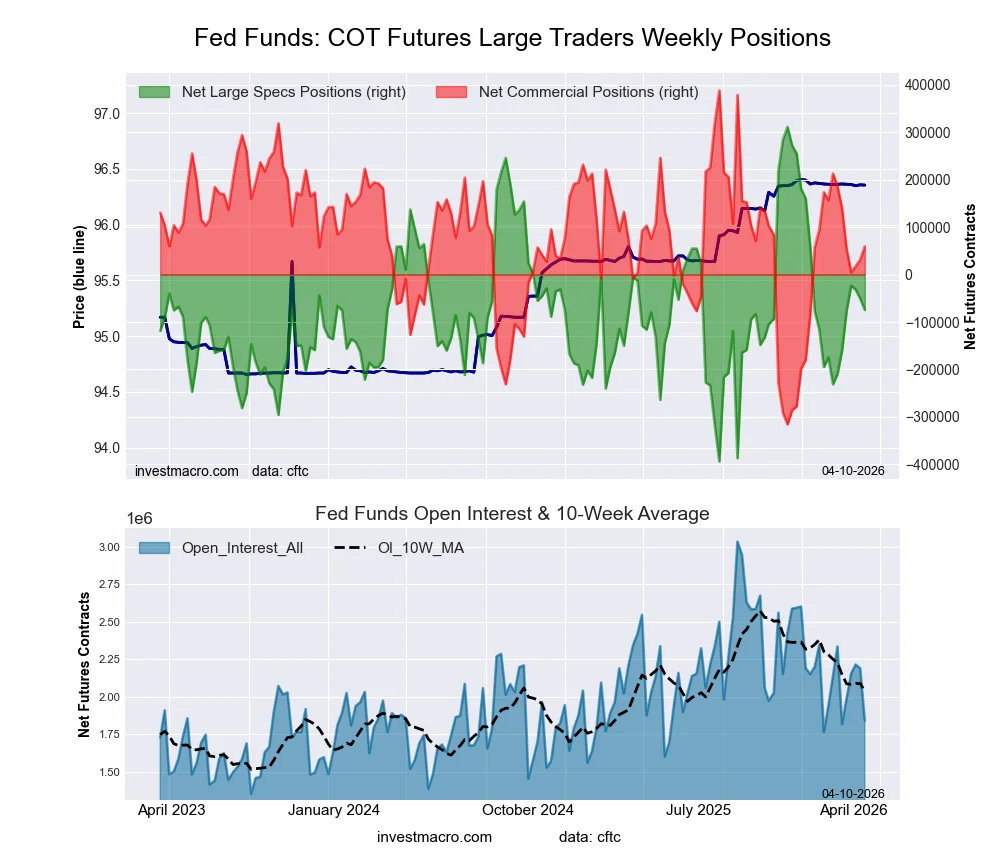
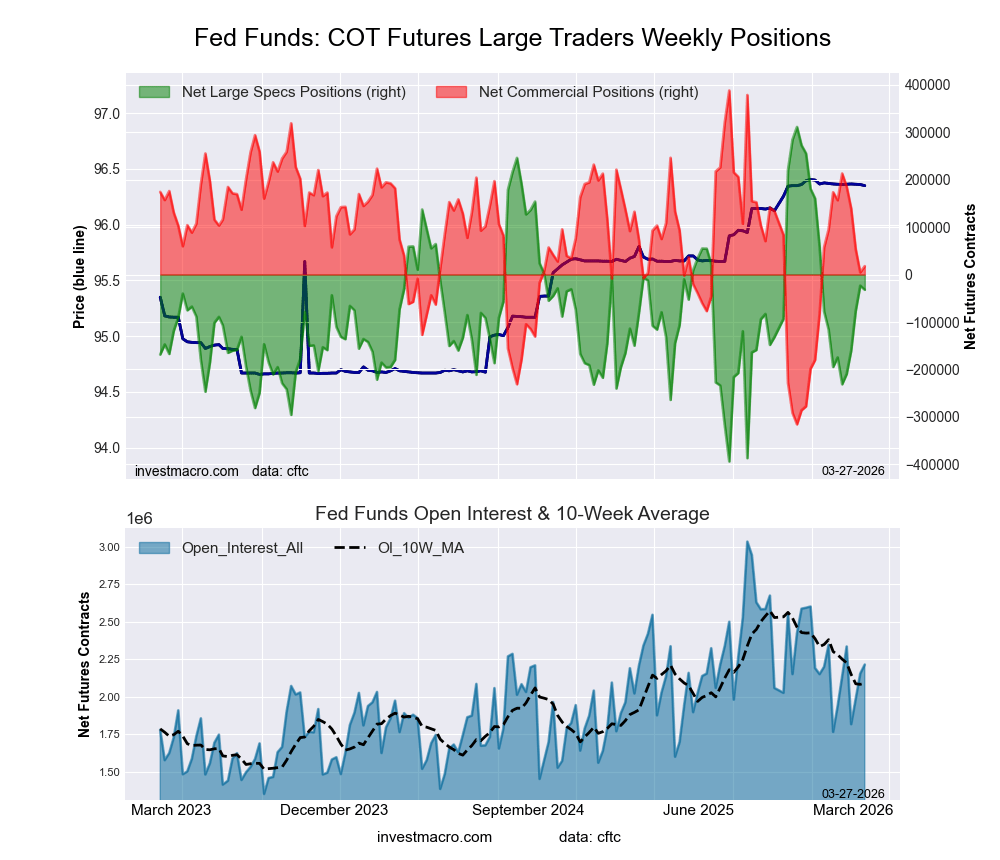
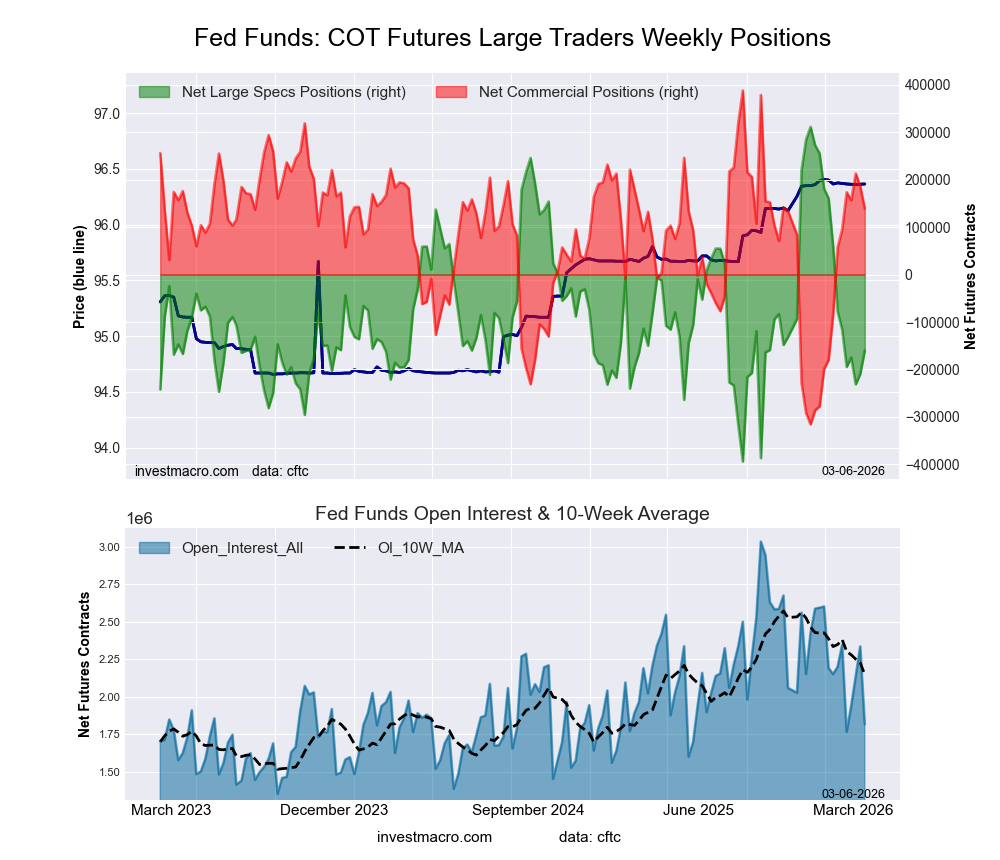
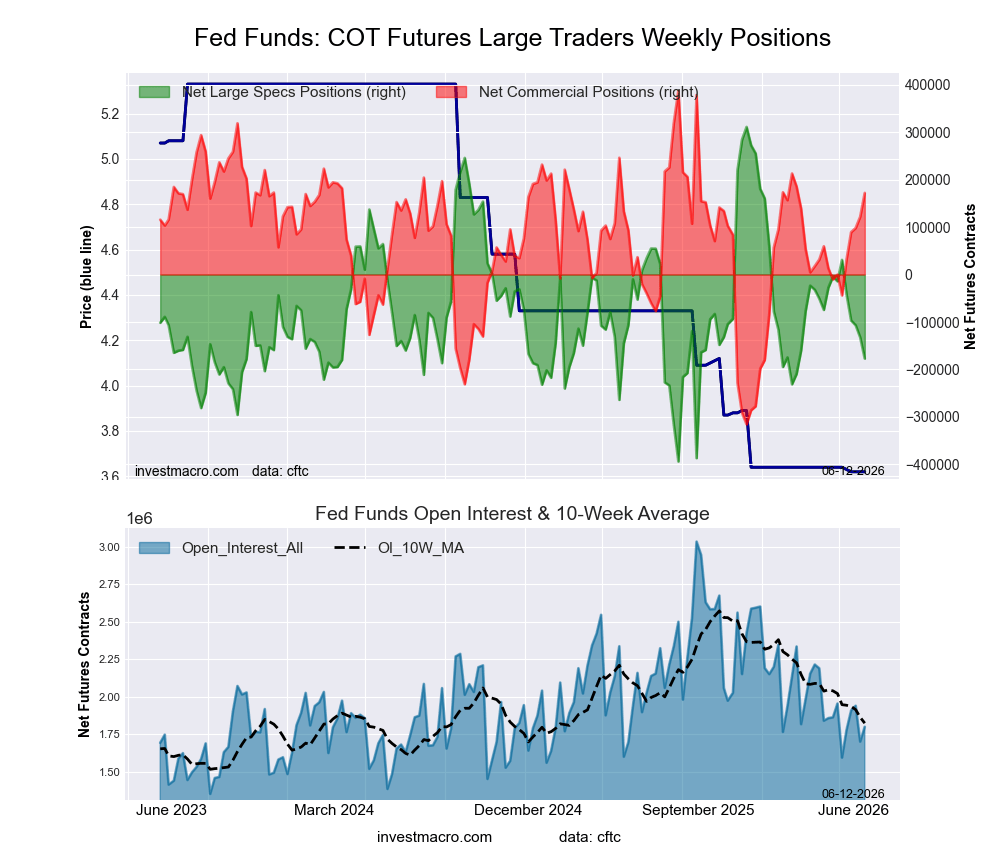
- 30-Day Federal Funds large speculator standing this week resulted in a net position of -177,055 contracts in the data reported through Tuesday.
- Weekly Speculator position decline of -44,731 contracts from the previous week which had a total of -132,324 net contracts.
- This week’s current strength score (range over the past 3 years, measured from 0 to 100) shows the speculators are currently Bearish with a score of 30.8 percent.
- The Commercials are Bullish with a score of 69.3 percent.
- The Small Traders (not shown in chart) are Bullish with a score of 56.8 percent.
Price Trend-Following Model: Weak Downtrend
Our weekly trend-following model classifies the current market price position as: Weak Downtrend.
| 30-Day Federal Funds Statistics | SPECULATORS | COMMERCIALS | SMALL TRADERS |
| – Percent of Open Interest Longs: | 8.4 | 67.5 | 1.9 |
| – Percent of Open Interest Shorts: | 18.3 | 58.0 | 1.7 |
| – Net Position: | -177,055 | 171,960 | 5,095 |
| – Gross Longs: | 151,868 | 1,215,568 | 34,988 |
| – Gross Shorts: | 328,923 | 1,043,608 | 29,893 |
| – Long to Short Ratio: | 0.5 to 1 | 1.2 to 1 | 1.2 to 1 |
| NET POSITION TREND: | |||
| – Strength Index Score (3 Year Range Pct): | 30.8 | 69.3 | 56.8 |
| – Strength Index Reading (3 Year Range): | Bearish | Bullish | Bullish |
| NET POSITION MOVEMENT INDEX: | |||
| – 6-Week Change in Strength Index: | -23.1 | 24.5 | -17.3 |
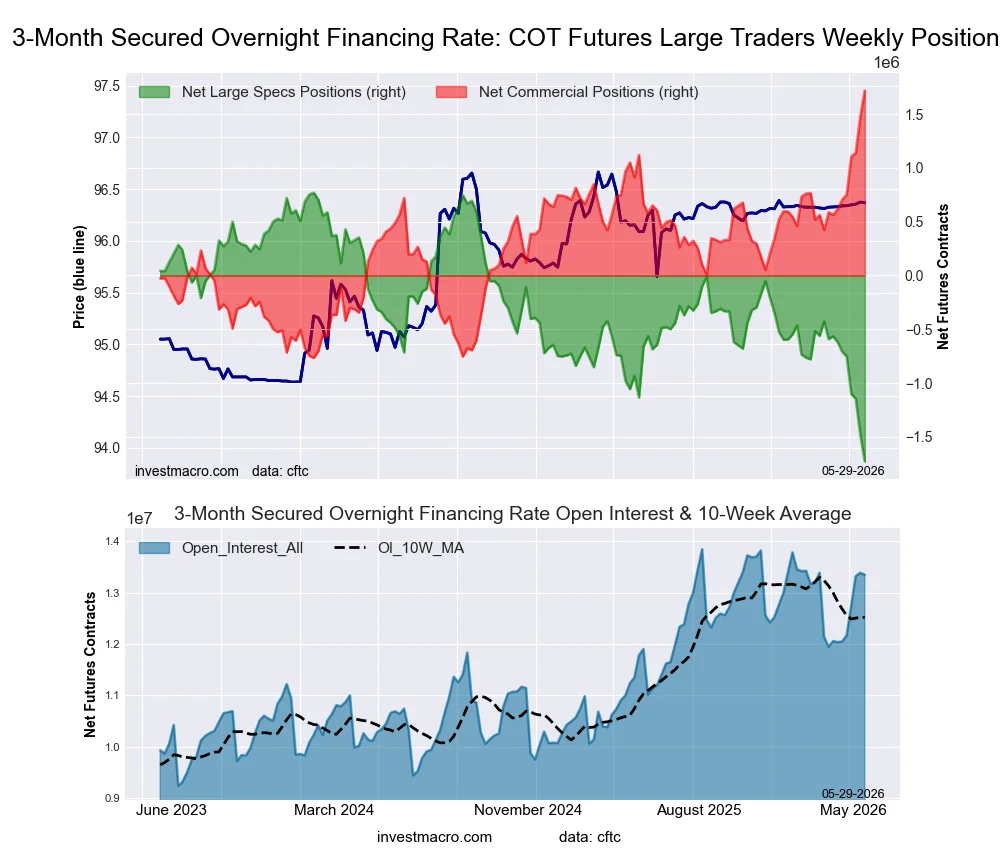
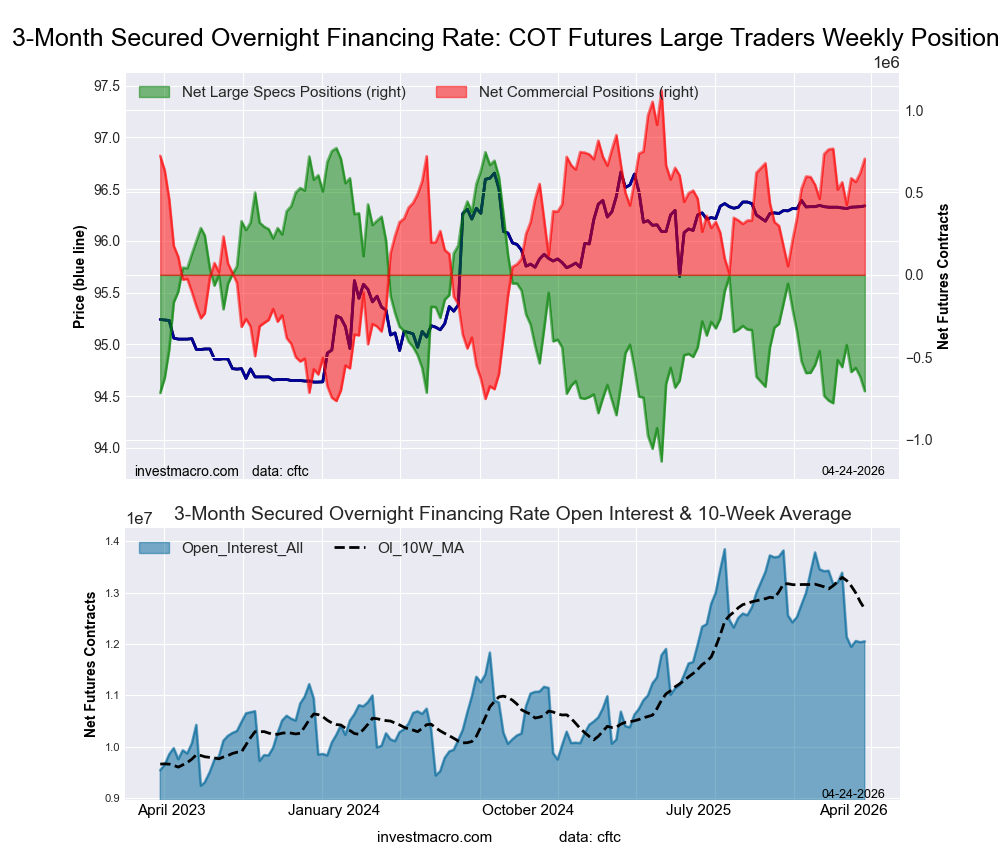
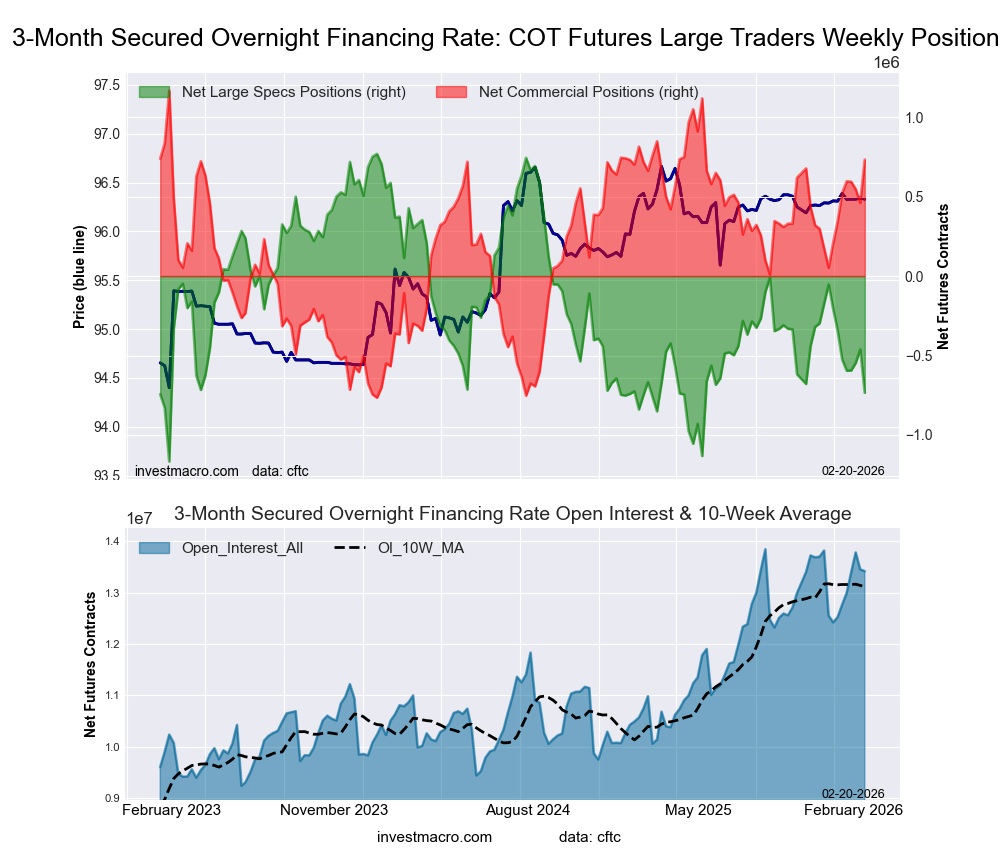
Secured Overnight Financing Rate (3-Month) Futures:
 Positioning Notes:
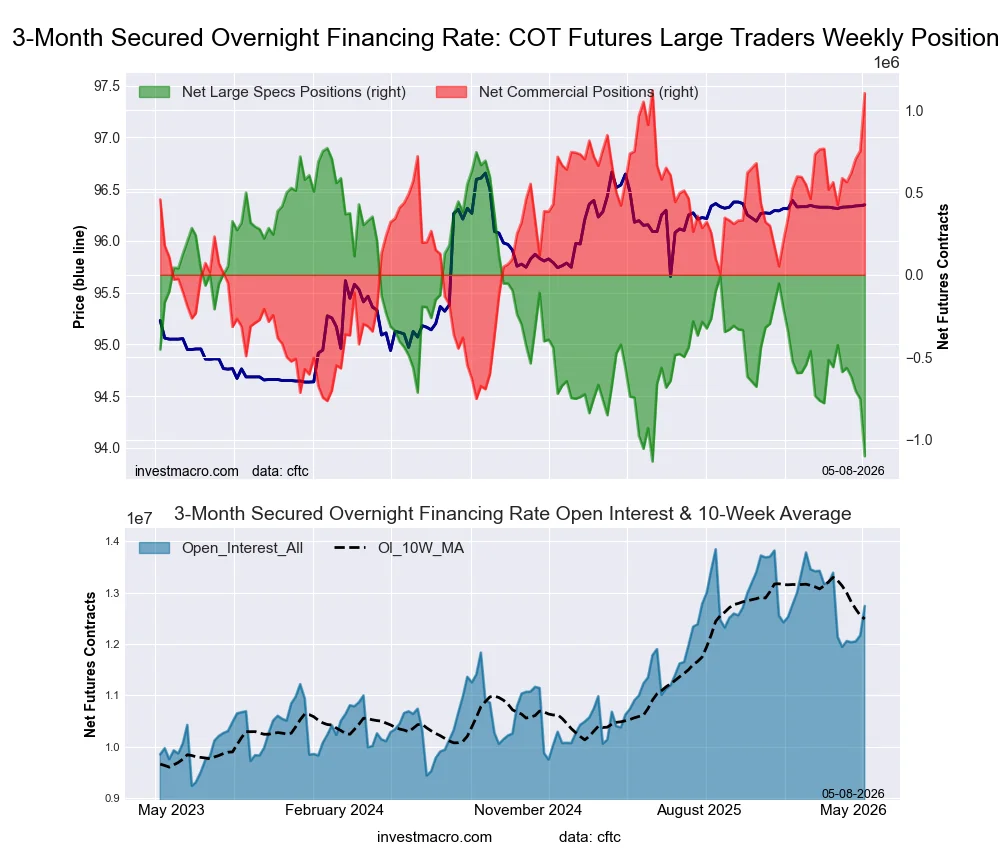
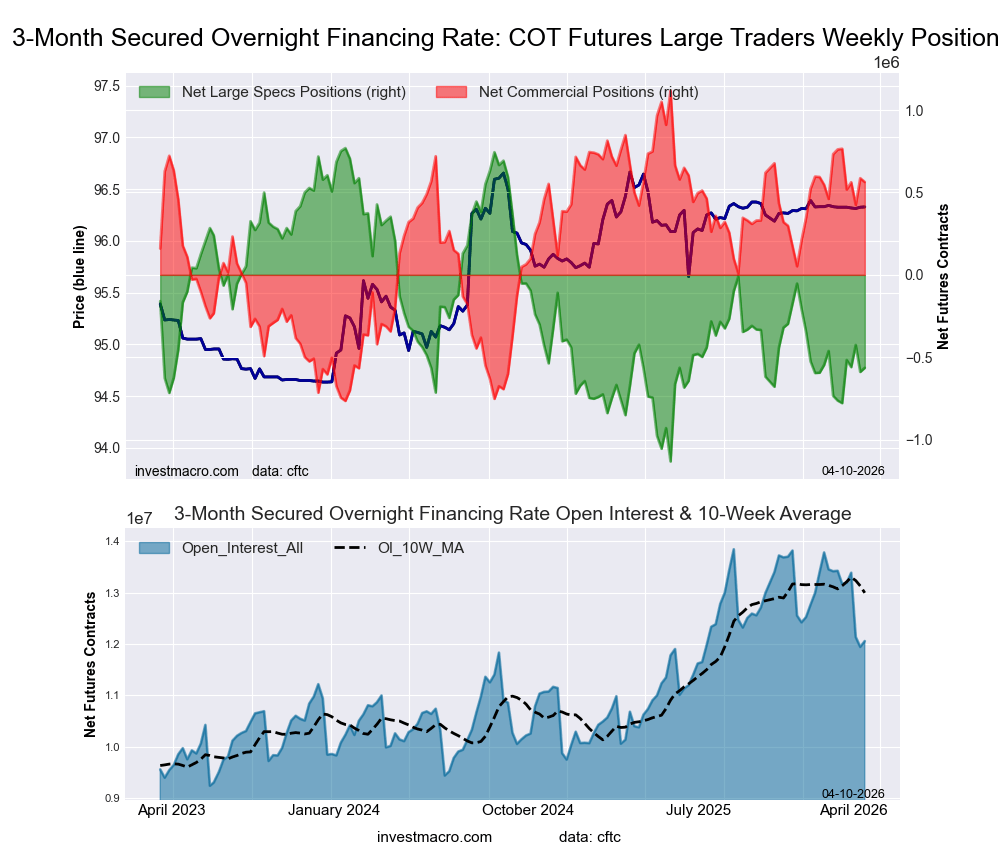
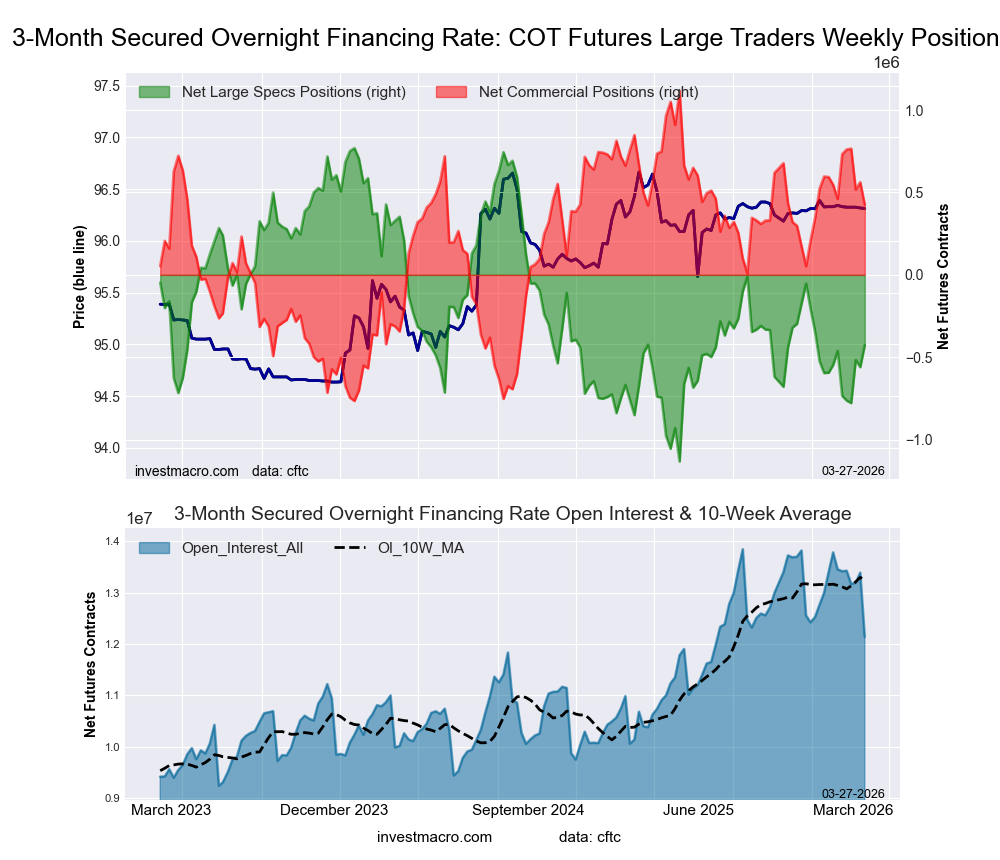
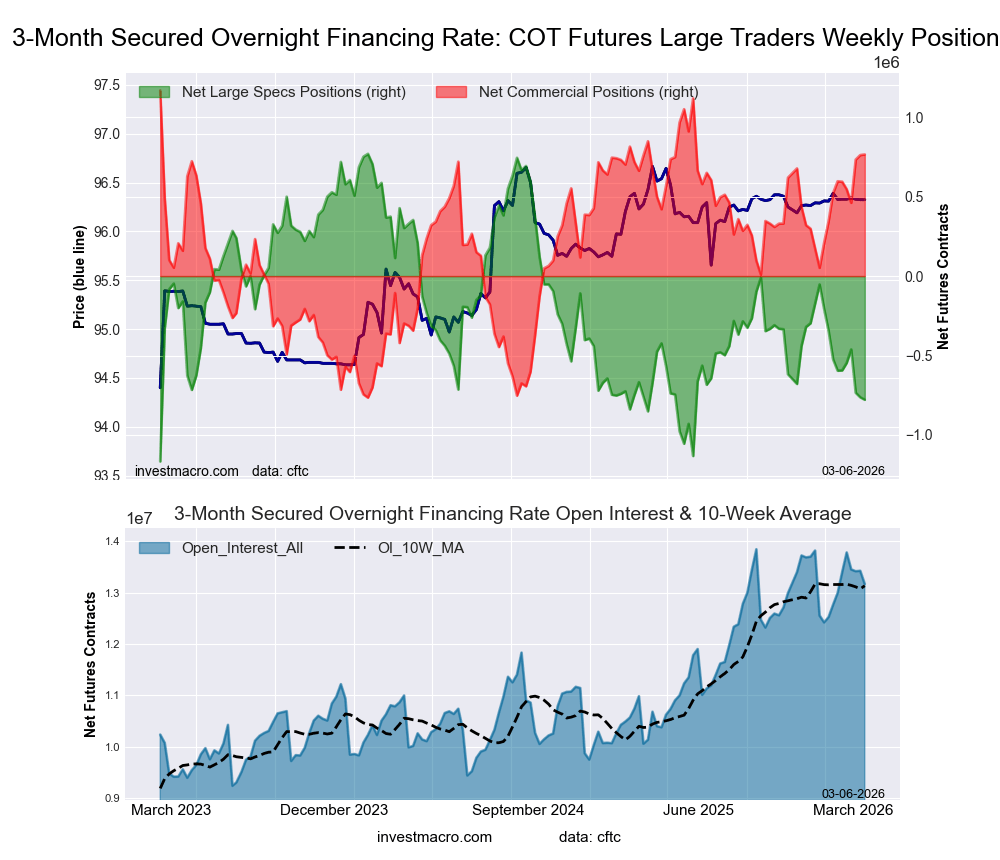
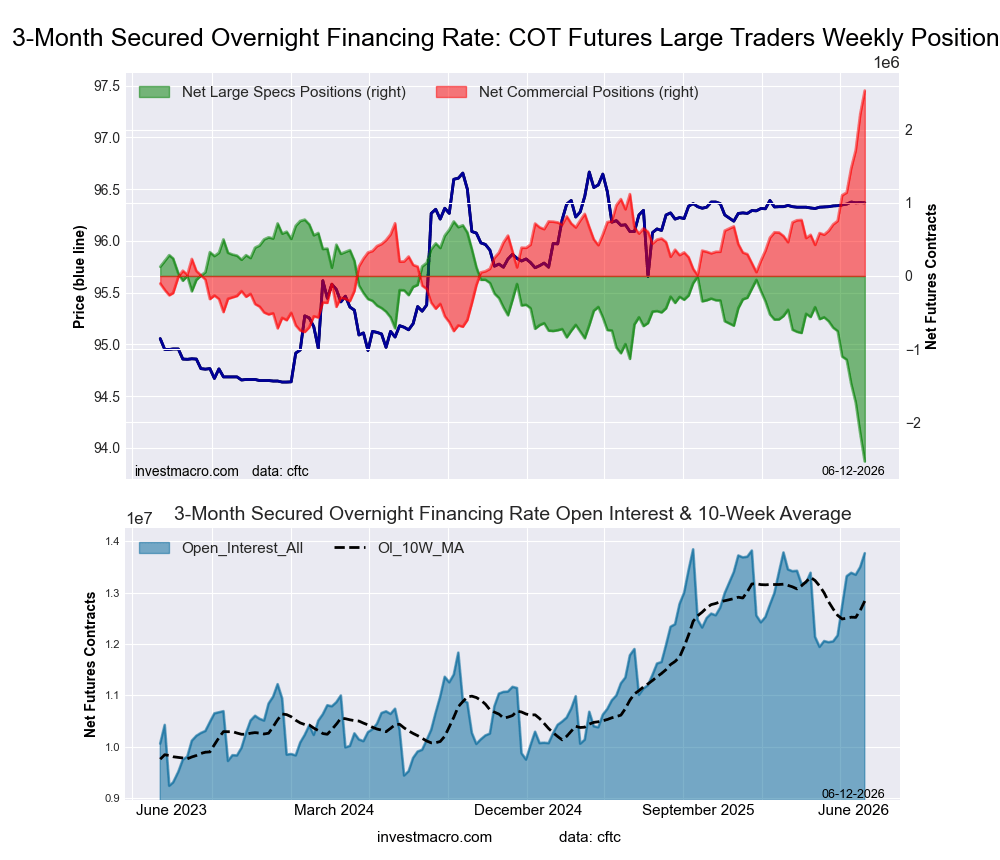
- Secured Overnight Financing Rate (3-Month) large speculator standing this week resulted in a net position of -2,534,063 contracts in the data reported through Tuesday.
- Weekly Speculator position lowering of -385,462 contracts from the previous week which had a total of -2,148,601 net contracts.
- This week’s current strength score (range over the past 3 years, measured from 0 to 100) shows the speculators are currently Bearish-Extreme with a score of 0.0 percent.
- The Commercials are Bullish-Extreme with a score of 100.0 percent.
- The Small Traders (not shown in chart) are Bullish with a score of 58.4 percent.
Price Trend-Following Model: Weak Uptrend
Our weekly trend-following model classifies the current market price position as: Weak Uptrend.
| SOFR 3-Months Statistics | SPECULATORS | COMMERCIALS | SMALL TRADERS |
| – Percent of Open Interest Longs: | 11.1 | 66.5 | 0.3 |
| – Percent of Open Interest Shorts: | 29.5 | 48.1 | 0.3 |
| – Net Position: | -2,534,063 | 2,533,569 | 494 |
| – Gross Longs: | 1,528,835 | 9,161,028 | 44,086 |
| – Gross Shorts: | 4,062,898 | 6,627,459 | 43,592 |
| – Long to Short Ratio: | 0.4 to 1 | 1.4 to 1 | 1.0 to 1 |
| NET POSITION TREND: | |||
| – Strength Index Score (3 Year Range Pct): | 0.0 | 100.0 | 58.4 |
| – Strength Index Reading (3 Year Range): | Bearish-Extreme | Bullish-Extreme | Bullish |
| NET POSITION MOVEMENT INDEX: | |||
| – 6-Week Change in Strength Index: | -53.9 | 54.0 | -0.0 |
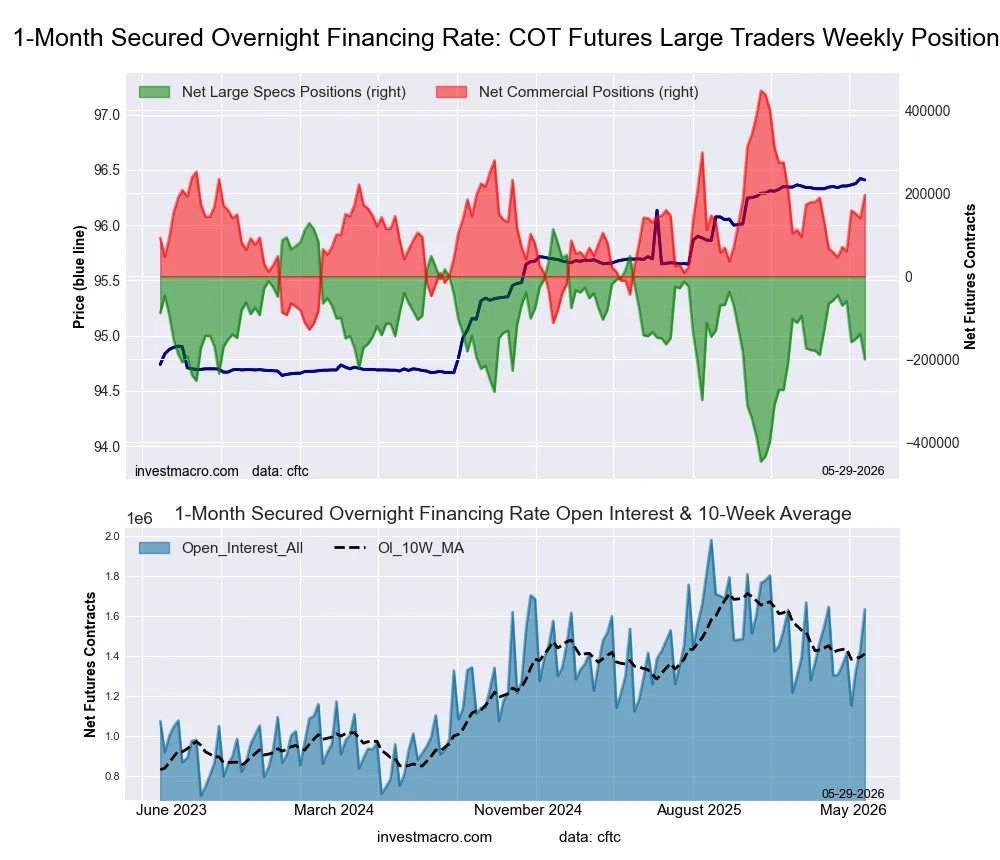
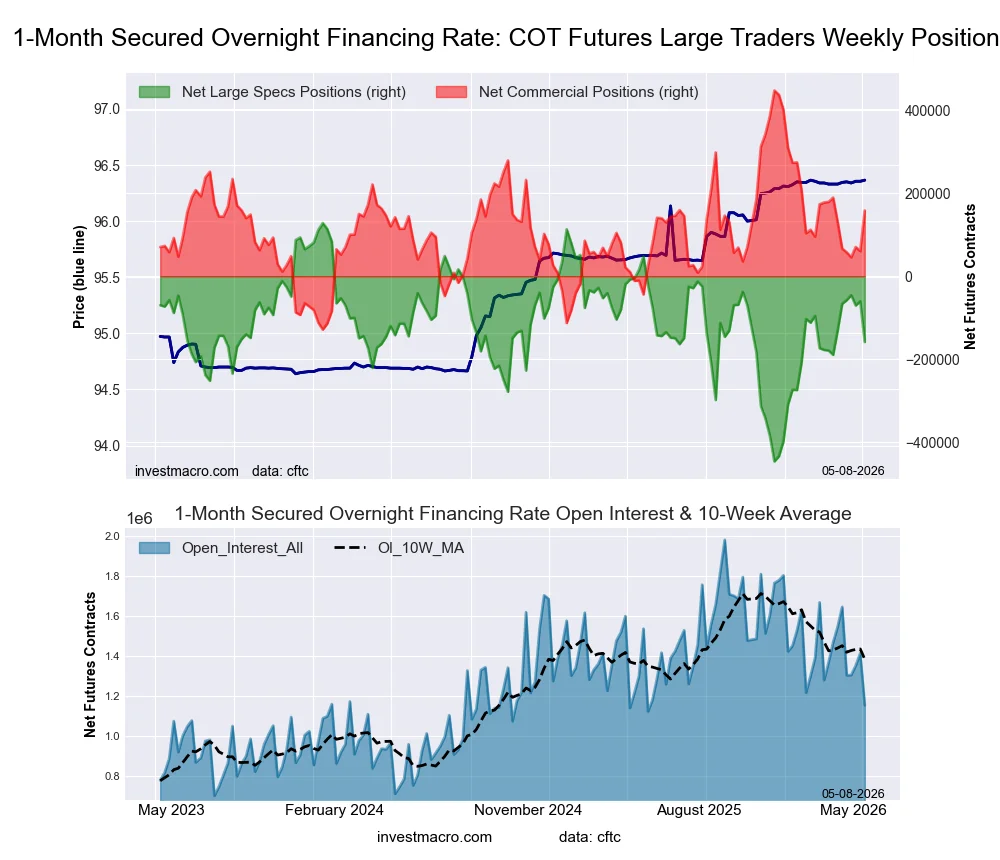
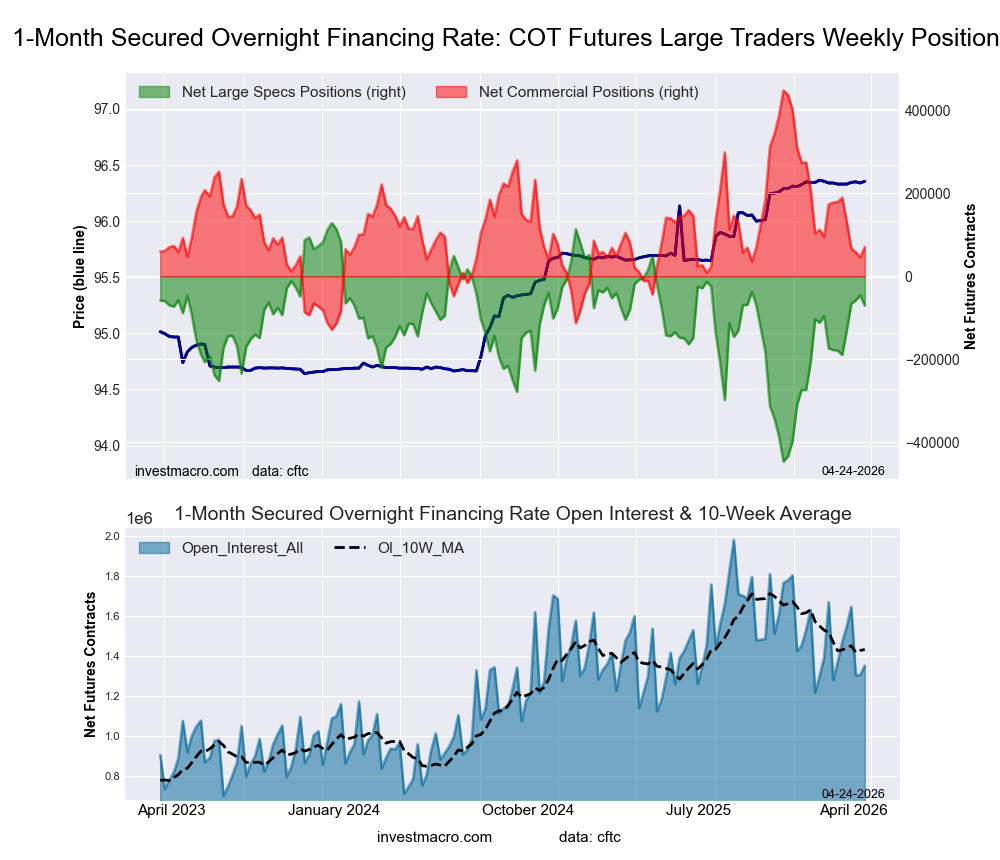
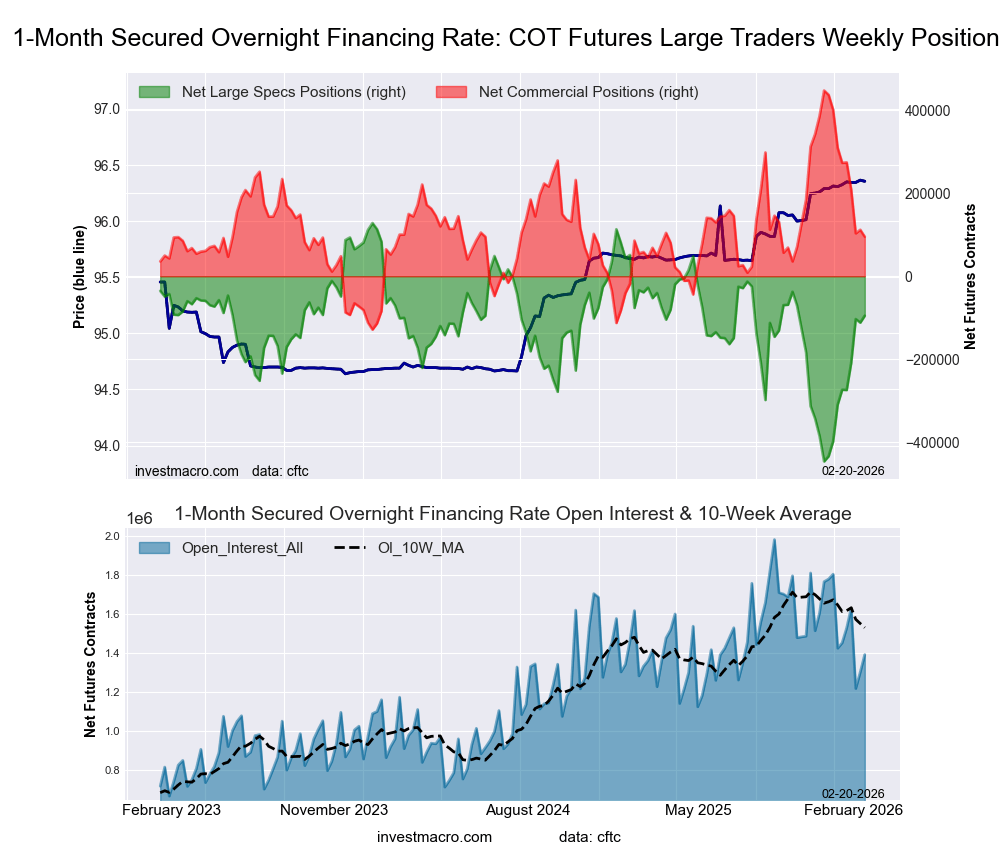
Secured Overnight Financing Rate (1-Month) Futures:
 Positioning Notes:
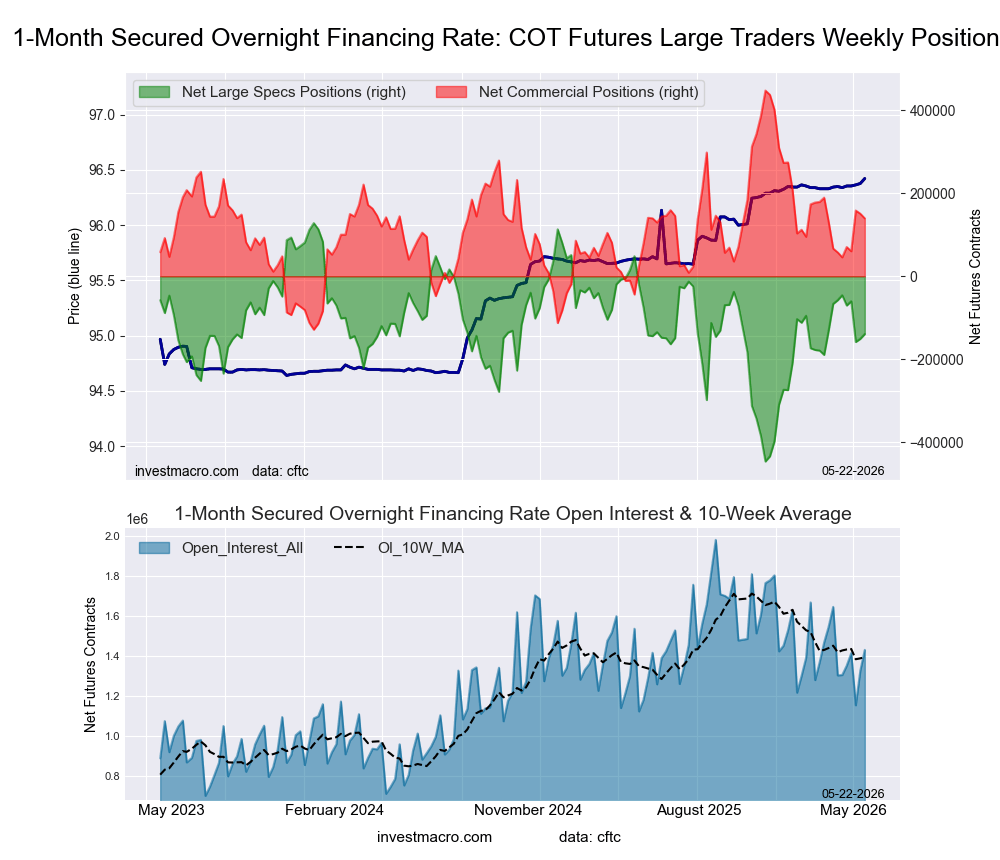
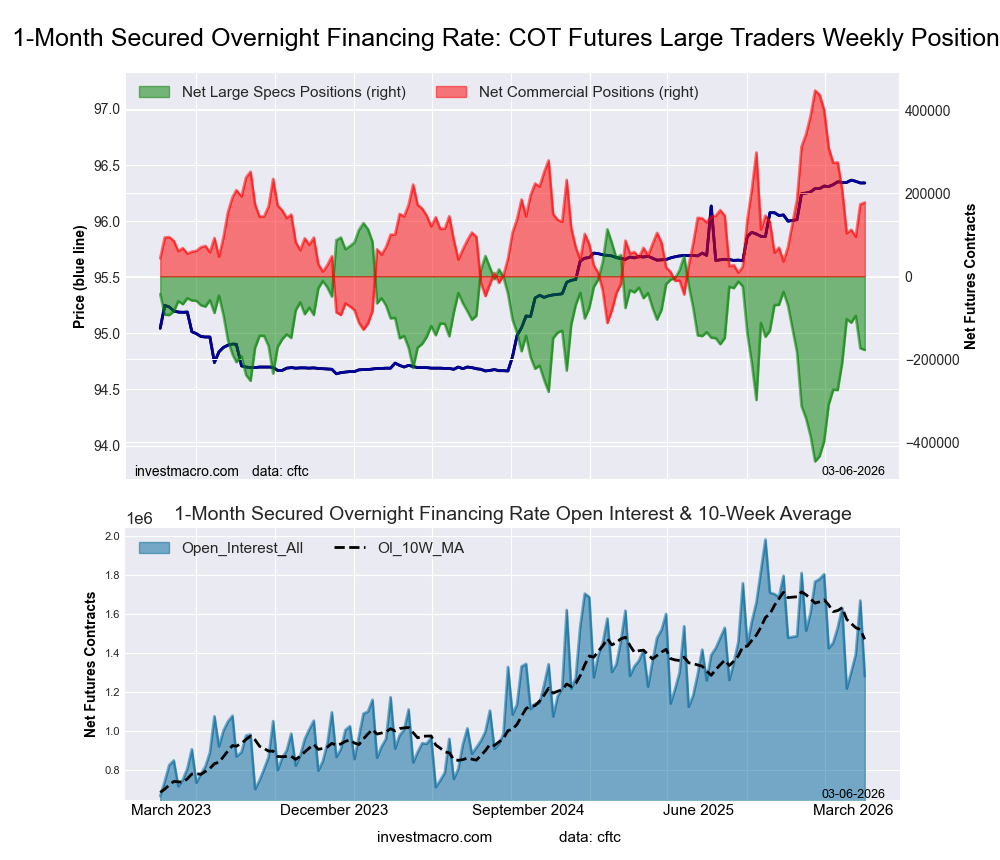
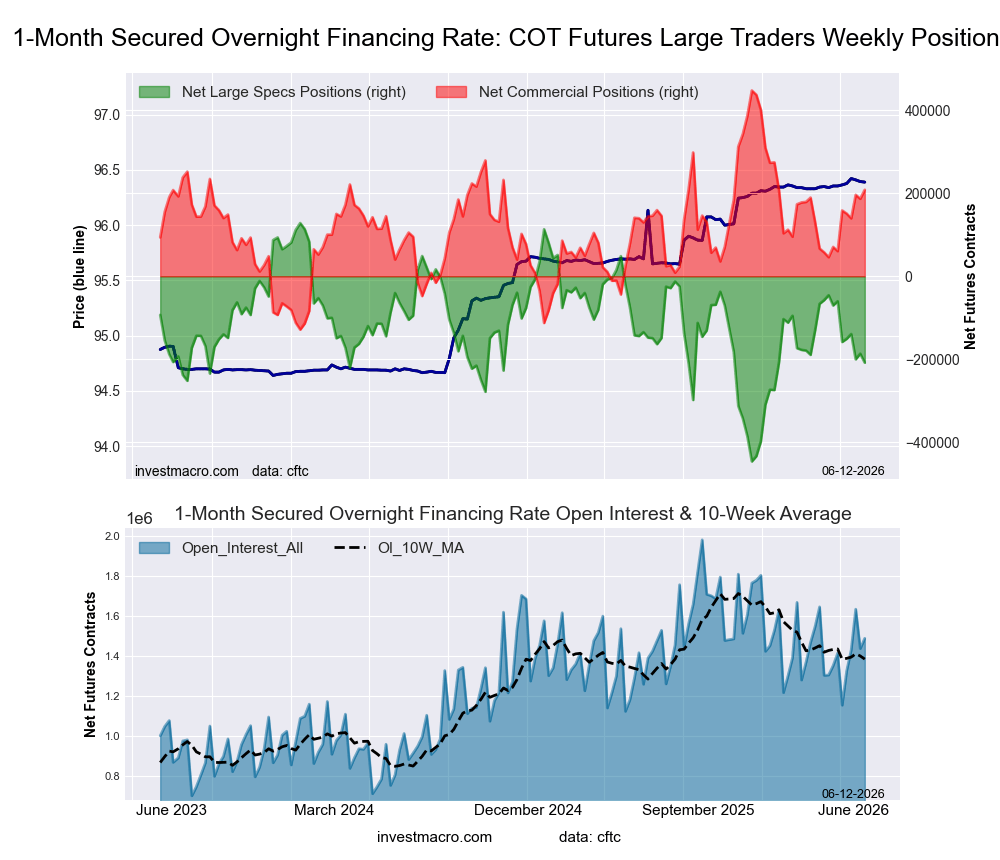
- Secured Overnight Financing Rate (1-Month) large speculator standing this week resulted in a net position of -208,039 contracts in the data reported through Tuesday.
- Weekly Speculator position decrease of -21,633 contracts from the previous week which had a total of -186,406 net contracts.
- This week’s current strength score (range over the past 3 years, measured from 0 to 100) shows the speculators are currently Bearish with a score of 41.4 percent.
- The Commercials are Bullish with a score of 58.5 percent.
- The Small Traders (not shown in chart) are Bullish with a score of 67.0 percent.
Price Trend-Following Model: Strong Uptrend
Our weekly trend-following model classifies the current market price position as: Strong Uptrend.
| SOFR 1-Month Statistics | SPECULATORS | COMMERCIALS | SMALL TRADERS |
| – Percent of Open Interest Longs: | 18.1 | 63.0 | 0.4 |
| – Percent of Open Interest Shorts: | 32.1 | 49.0 | 0.4 |
| – Net Position: | -208,039 | 207,974 | 65 |
| – Gross Longs: | 269,395 | 936,939 | 6,548 |
| – Gross Shorts: | 477,434 | 728,965 | 6,483 |
| – Long to Short Ratio: | 0.6 to 1 | 1.3 to 1 | 1.0 to 1 |
| NET POSITION TREND: | |||
| – Strength Index Score (3 Year Range Pct): | 41.4 | 58.5 | 67.0 |
| – Strength Index Reading (3 Year Range): | Bearish | Bullish | Bullish |
| NET POSITION MOVEMENT INDEX: | |||
| – 6-Week Change in Strength Index: | -25.8 | 25.7 | 0.2 |
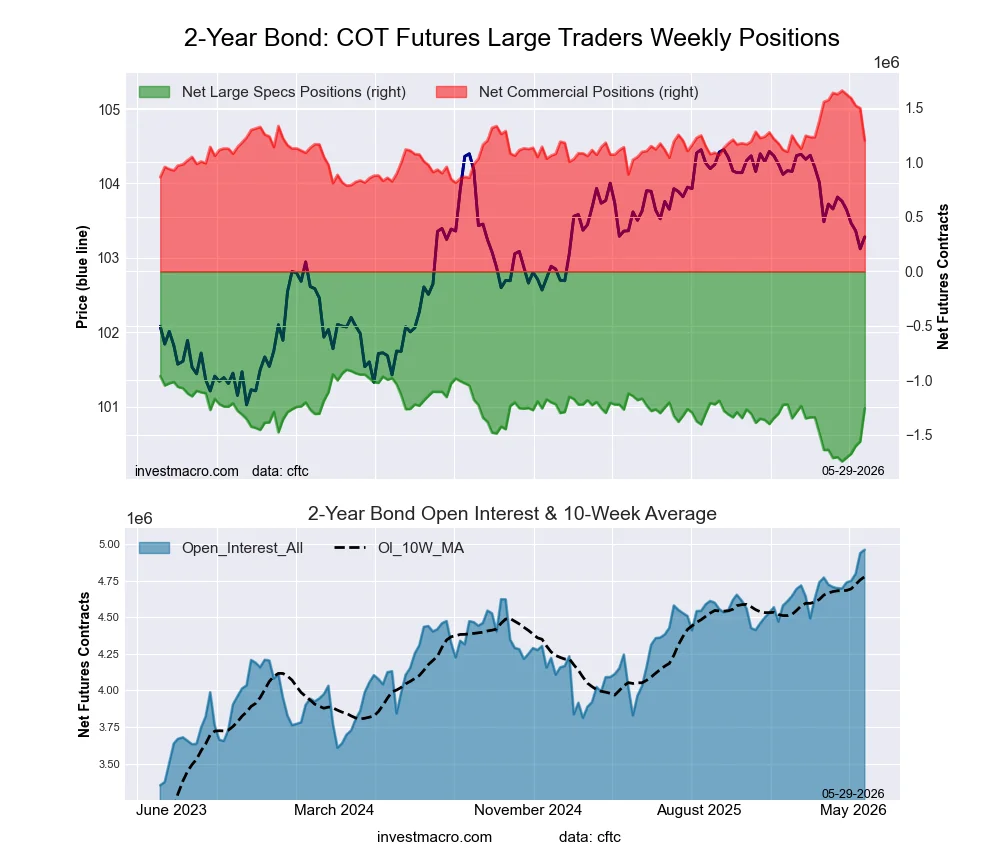
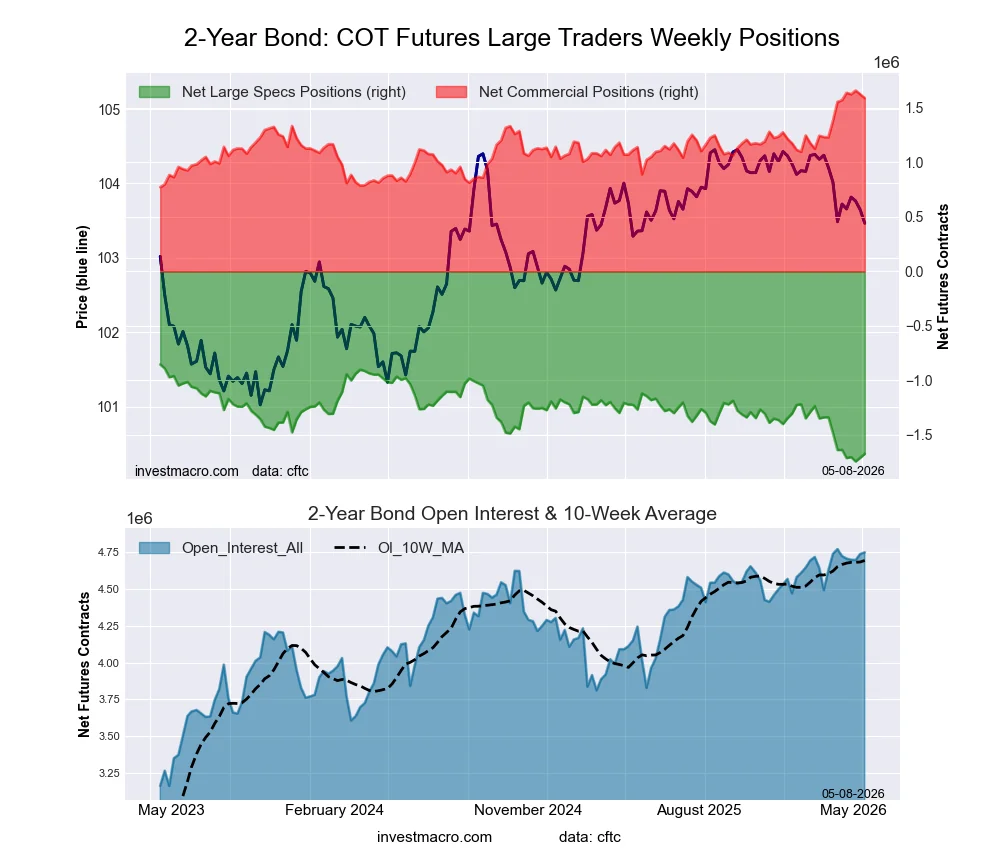
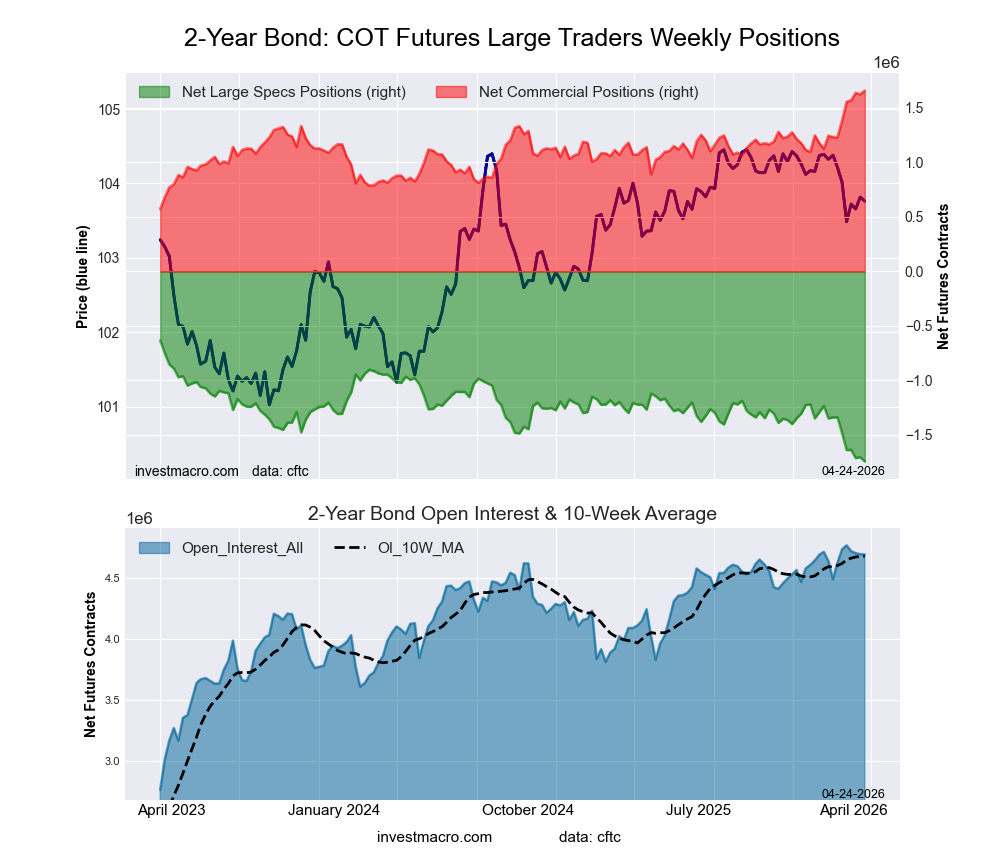
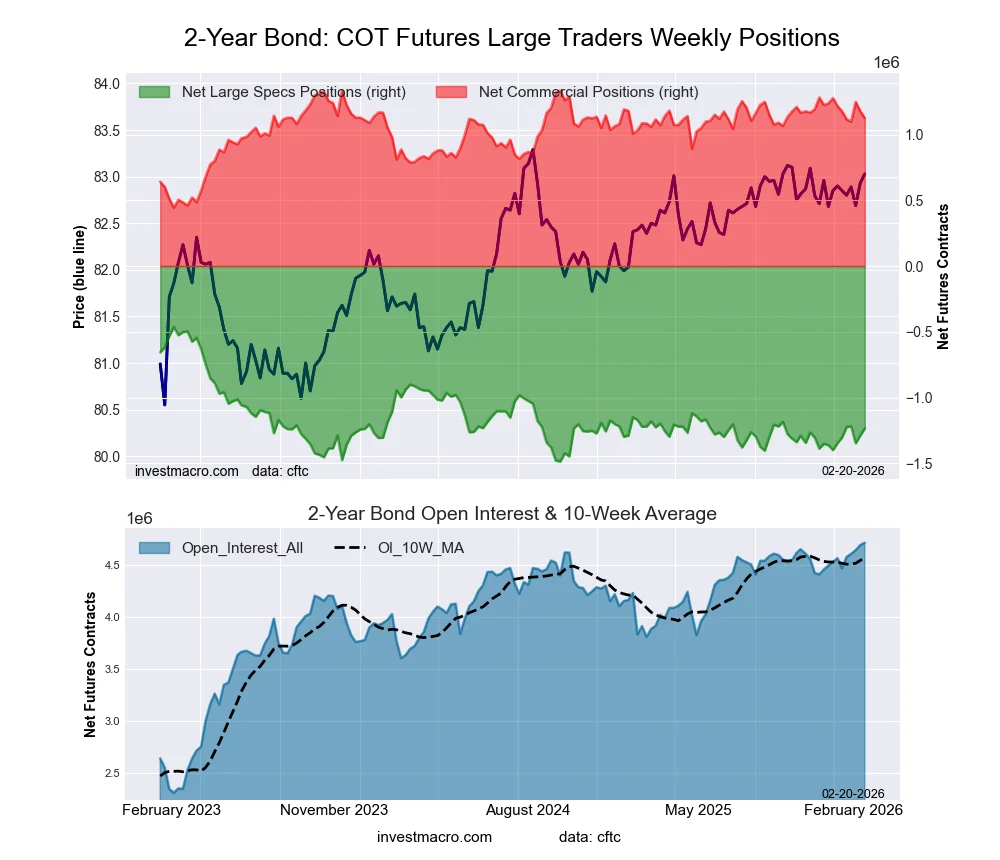
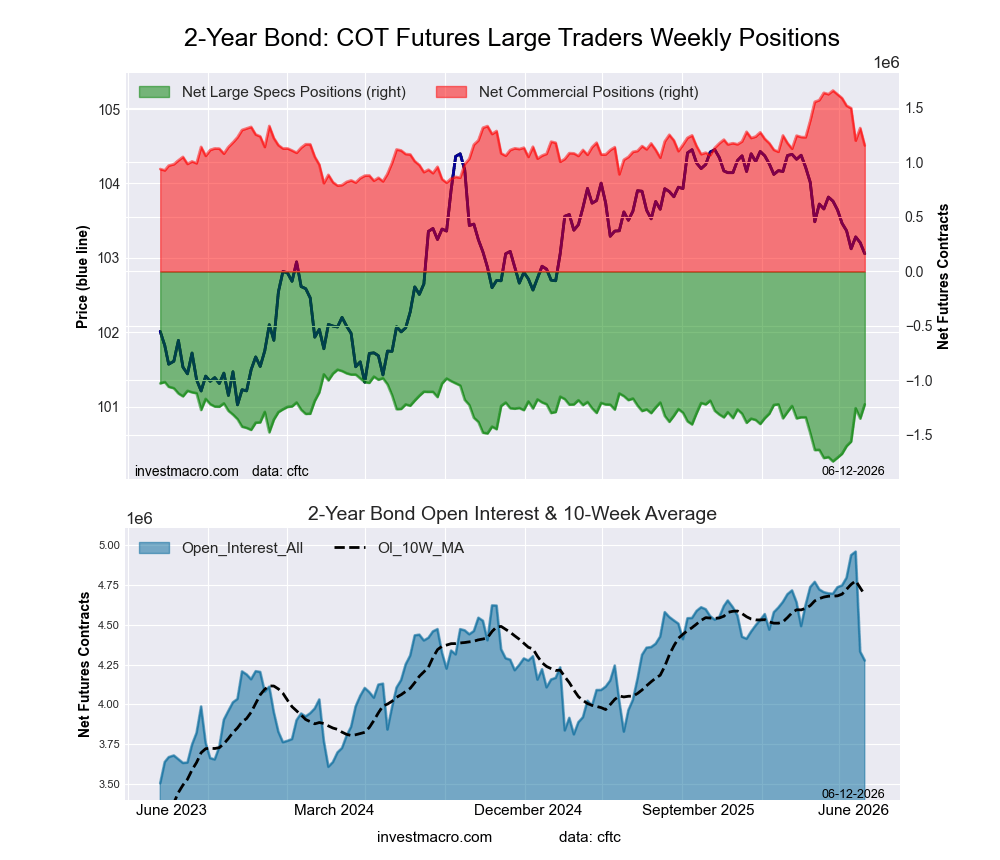
2-Year Treasury Note Futures:
 Positioning Notes:
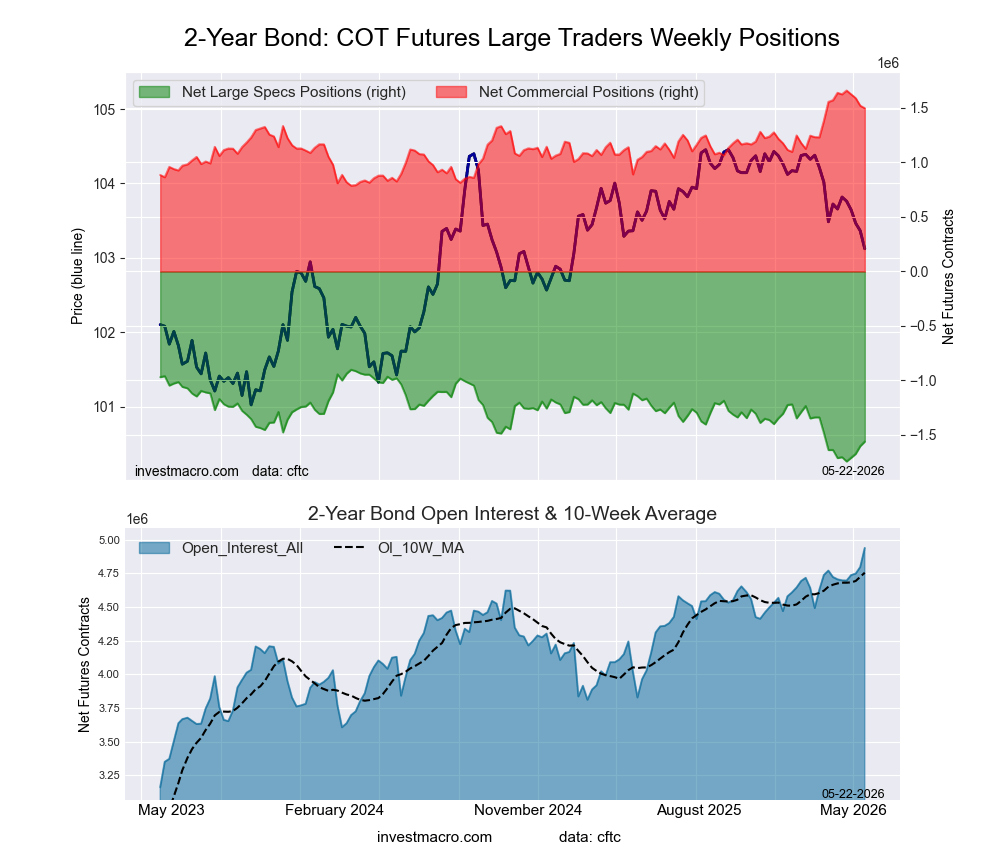
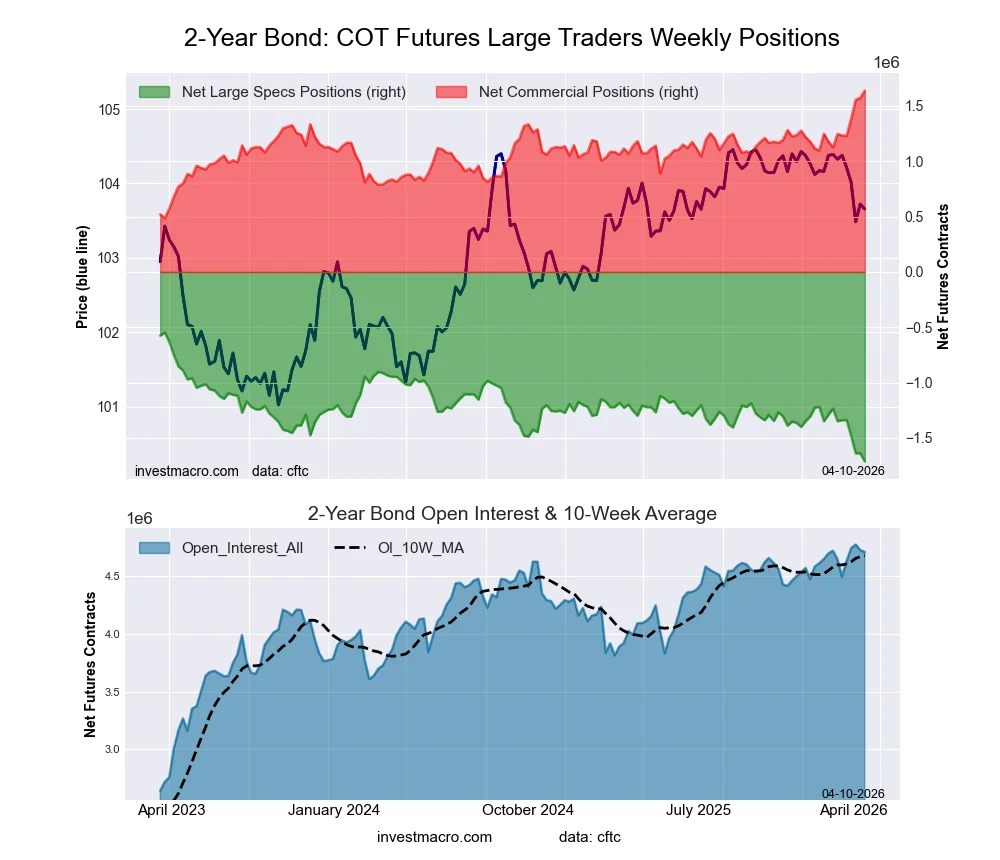
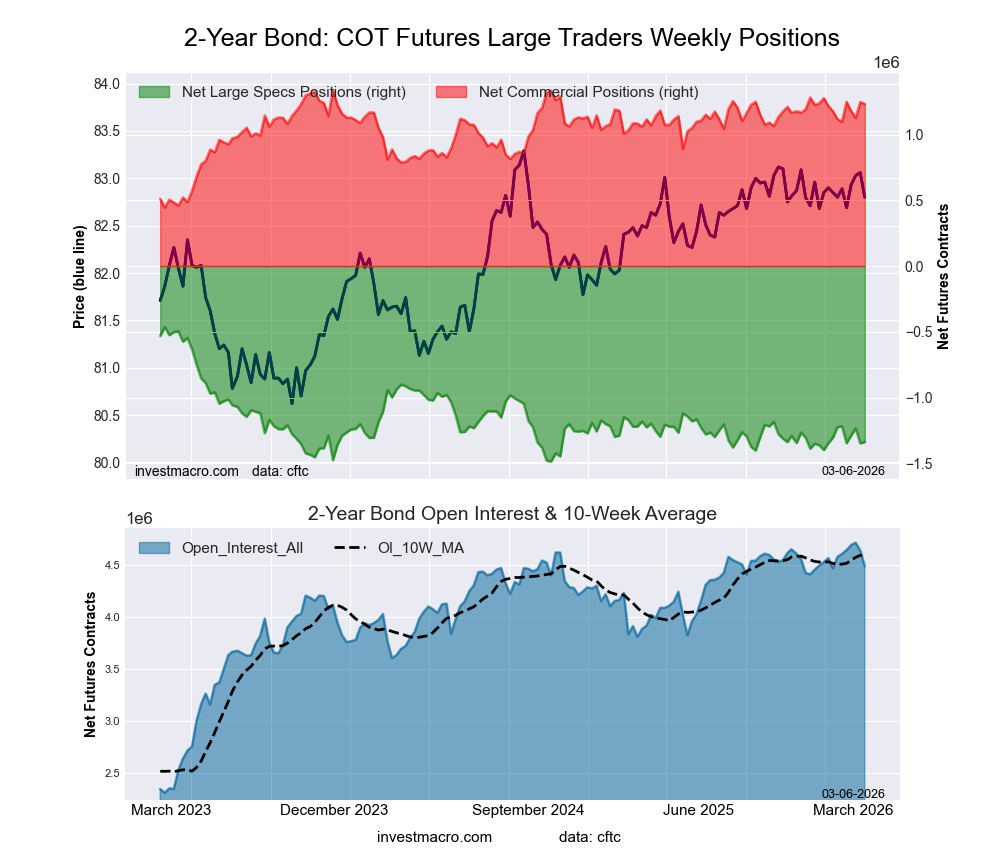
- 2-Year Treasury Note large speculator standing this week resulted in a net position of -1,219,838 contracts in the data reported through Tuesday.
- Weekly Speculator position lift of 130,350 contracts from the previous week which had a total of -1,350,188 net contracts.
- This week’s current strength score (range over the past 3 years, measured from 0 to 100) shows the speculators are currently Bullish with a score of 62.2 percent.
- The Commercials are Bearish with a score of 42.2 percent.
- The Small Traders (not shown in chart) are Bearish-Extreme with a score of 15.0 percent.
Price Trend-Following Model: Downtrend
Our weekly trend-following model classifies the current market price position as: Downtrend.
| 2-Year Treasury Note Statistics | SPECULATORS | COMMERCIALS | SMALL TRADERS |
| – Percent of Open Interest Longs: | 12.0 | 79.0 | 5.1 |
| – Percent of Open Interest Shorts: | 40.5 | 51.9 | 3.6 |
| – Net Position: | -1,219,838 | 1,156,276 | 63,562 |
| – Gross Longs: | 511,328 | 3,376,977 | 216,772 |
| – Gross Shorts: | 1,731,166 | 2,220,701 | 153,210 |
| – Long to Short Ratio: | 0.3 to 1 | 1.5 to 1 | 1.4 to 1 |
| NET POSITION TREND: | |||
| – Strength Index Score (3 Year Range Pct): | 62.2 | 42.2 | 15.0 |
| – Strength Index Reading (3 Year Range): | Bullish | Bearish | Bearish-Extreme |
| NET POSITION MOVEMENT INDEX: | |||
| – 6-Week Change in Strength Index: | 58.1 | -53.8 | -10.3 |
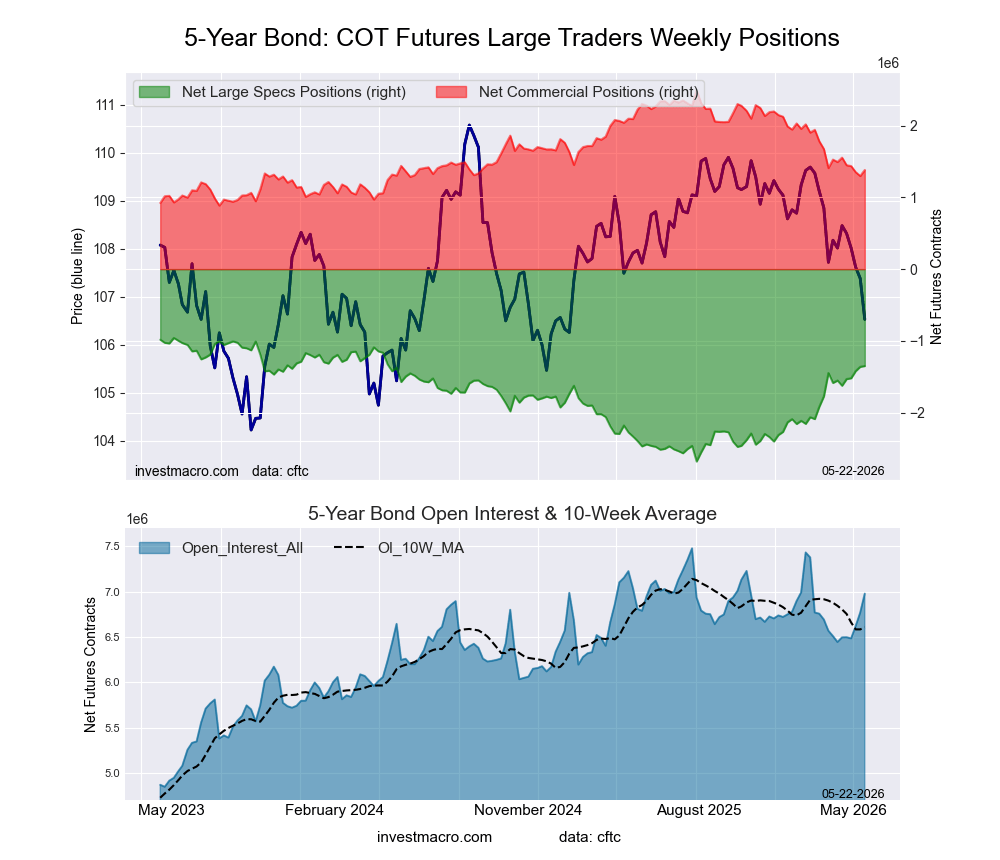
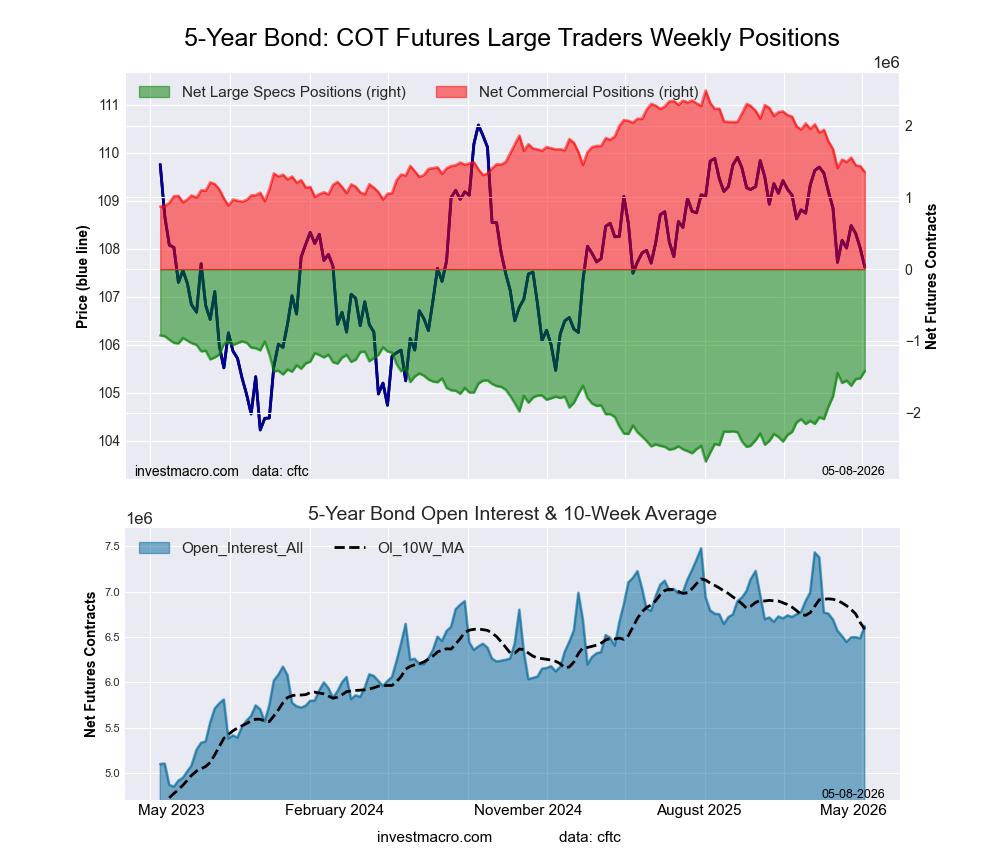
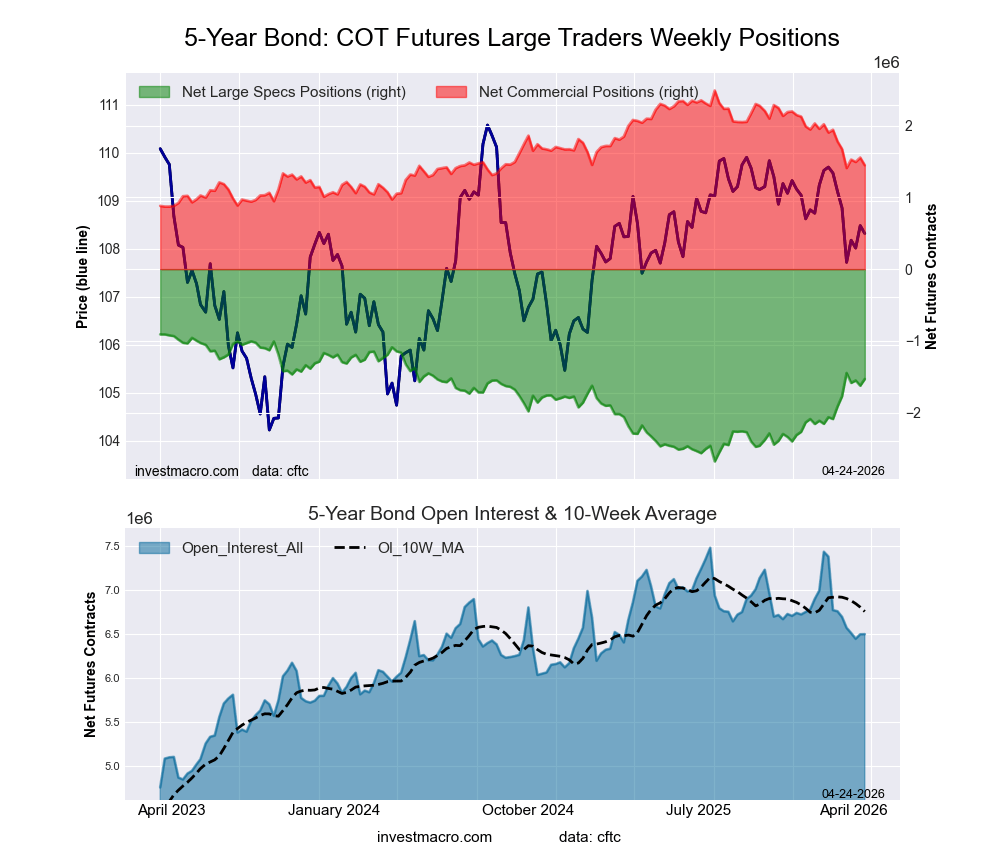
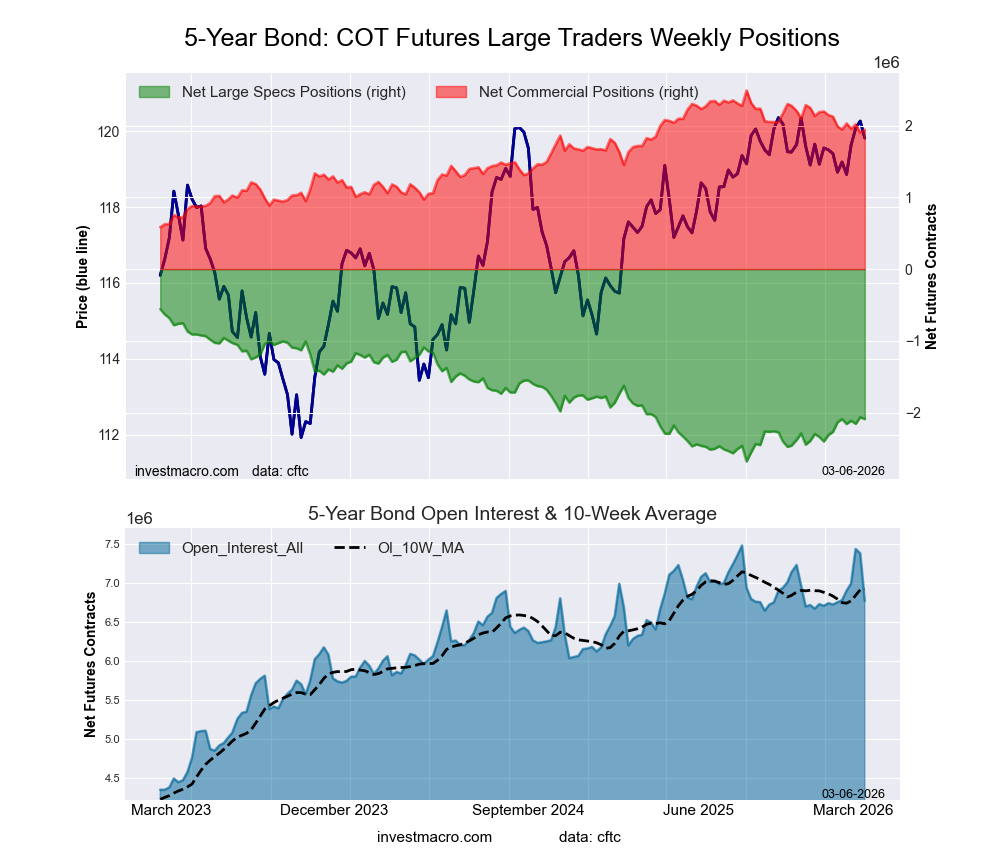
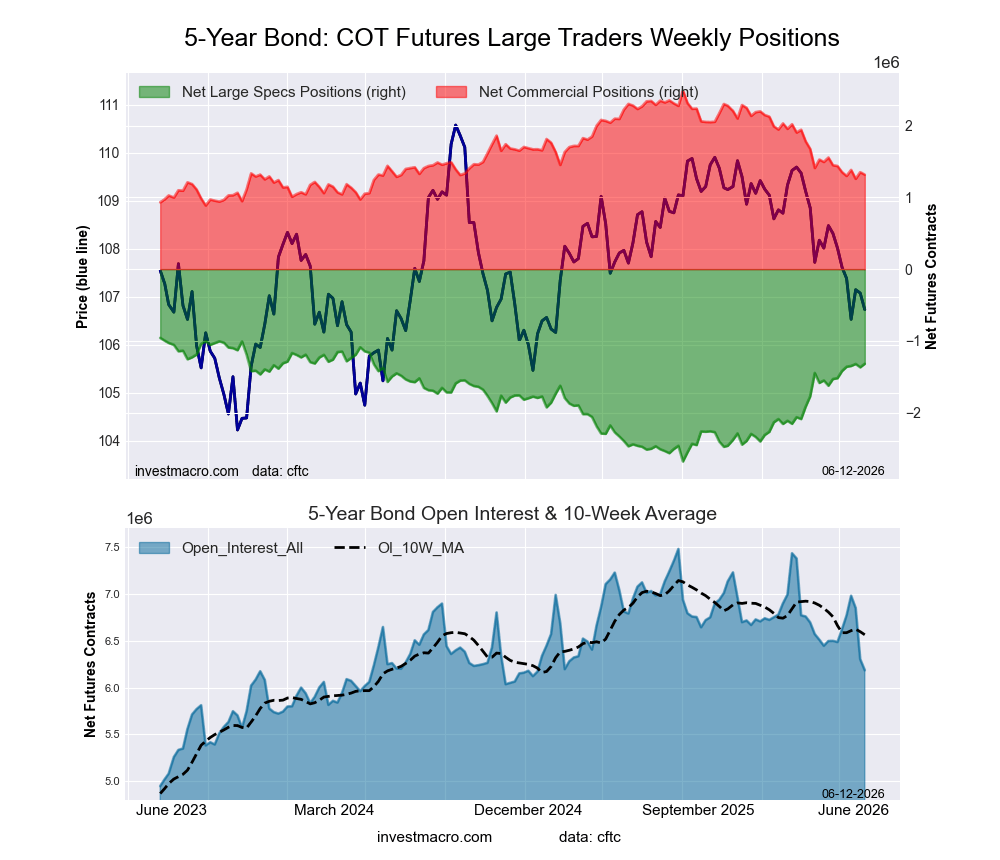
5-Year Treasury Note Futures:
 Positioning Notes:
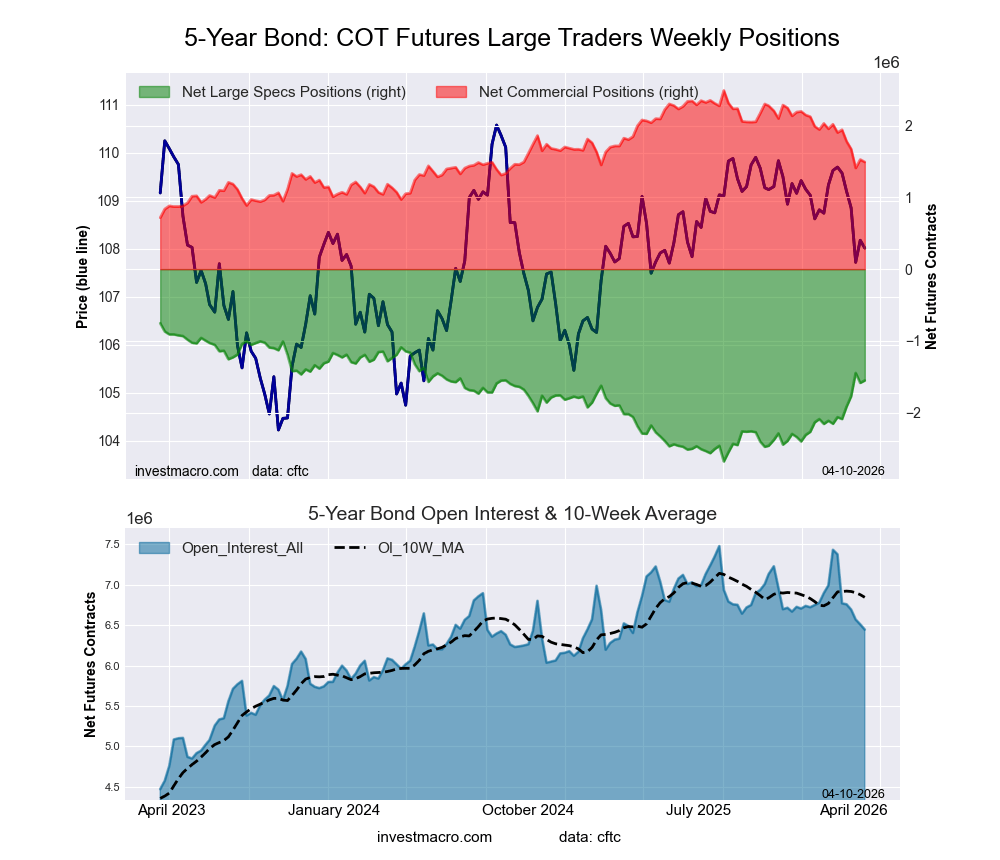
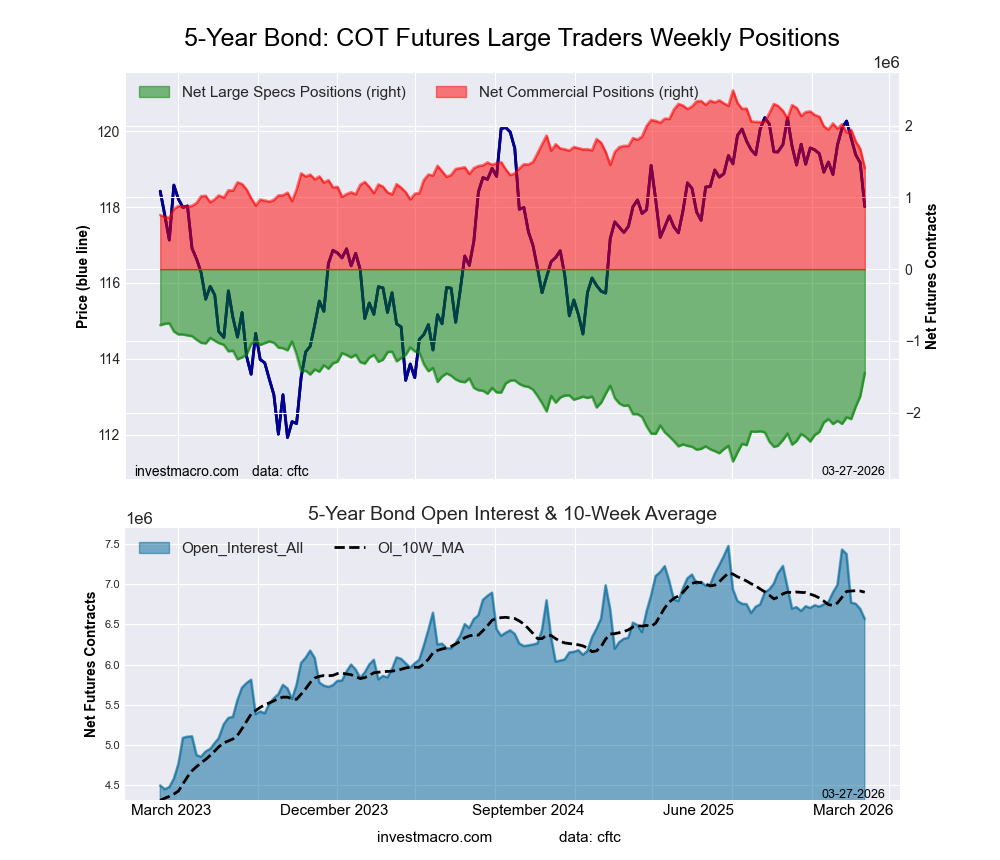
- 5-Year Treasury Note large speculator standing this week resulted in a net position of -1,320,162 contracts in the data reported through Tuesday.
- Weekly Speculator position advance of 49,056 contracts from the previous week which had a total of -1,369,218 net contracts.
- This week’s current strength score (range over the past 3 years, measured from 0 to 100) shows the speculators are currently Bullish with a score of 79.0 percent.
- The Commercials are Bearish with a score of 26.8 percent.
- The Small Traders (not shown in chart) are Bearish-Extreme with a score of 12.5 percent.
Price Trend-Following Model: Downtrend
Our weekly trend-following model classifies the current market price position as: Downtrend.
| 5-Year Treasury Note Statistics | SPECULATORS | COMMERCIALS | SMALL TRADERS |
| – Percent of Open Interest Longs: | 7.6 | 83.6 | 6.5 |
| – Percent of Open Interest Shorts: | 28.9 | 62.3 | 6.5 |
| – Net Position: | -1,320,162 | 1,317,080 | 3,082 |
| – Gross Longs: | 469,268 | 5,169,671 | 404,940 |
| – Gross Shorts: | 1,789,430 | 3,852,591 | 401,858 |
| – Long to Short Ratio: | 0.3 to 1 | 1.3 to 1 | 1.0 to 1 |
| NET POSITION TREND: | |||
| – Strength Index Score (3 Year Range Pct): | 79.0 | 26.8 | 12.5 |
| – Strength Index Reading (3 Year Range): | Bullish | Bearish | Bearish-Extreme |
| NET POSITION MOVEMENT INDEX: | |||
| – 6-Week Change in Strength Index: | 11.7 | -7.5 | -28.6 |
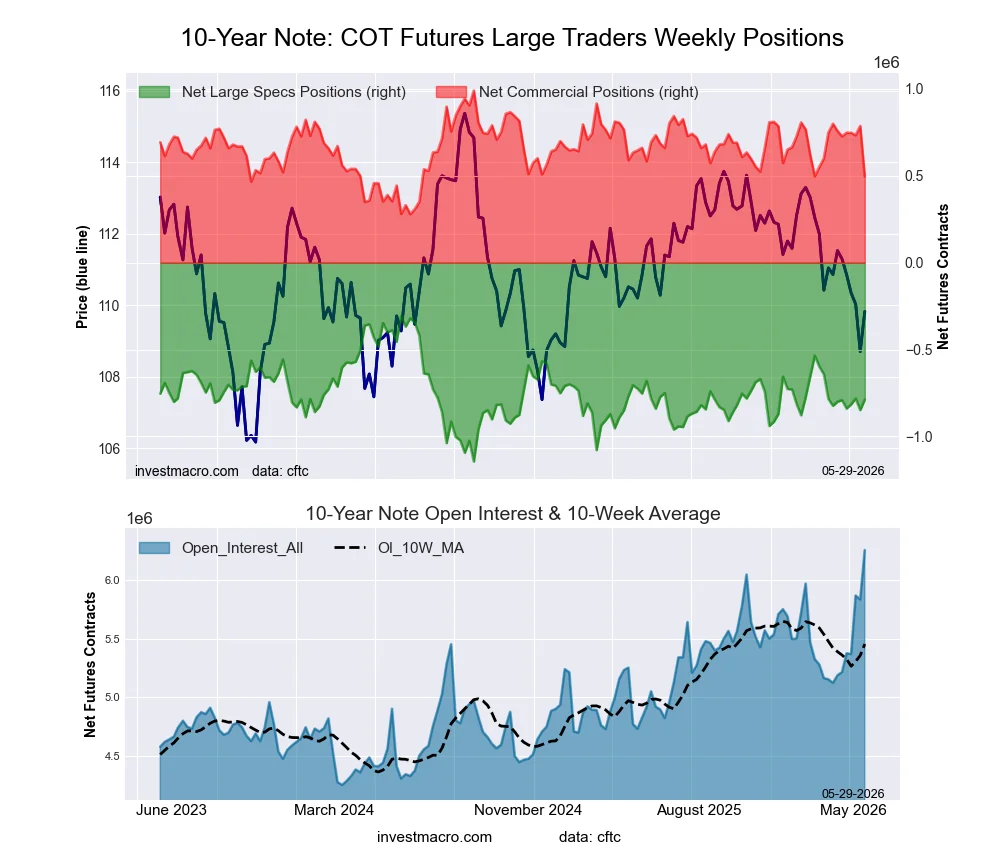
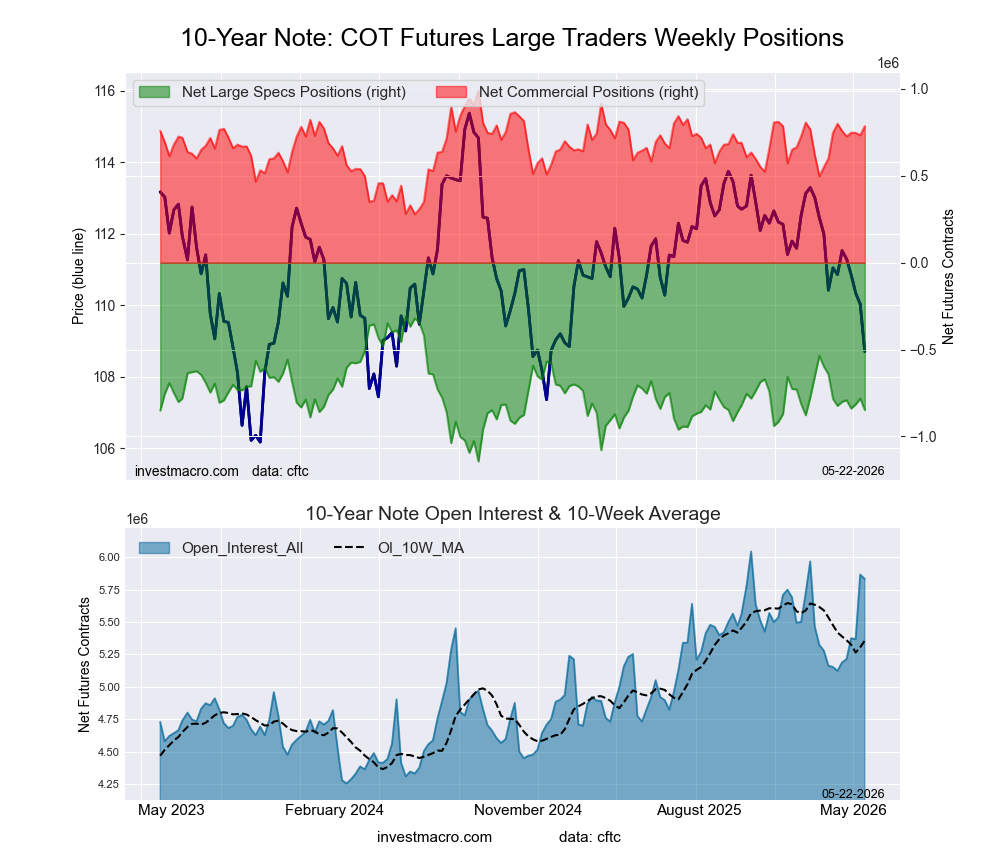
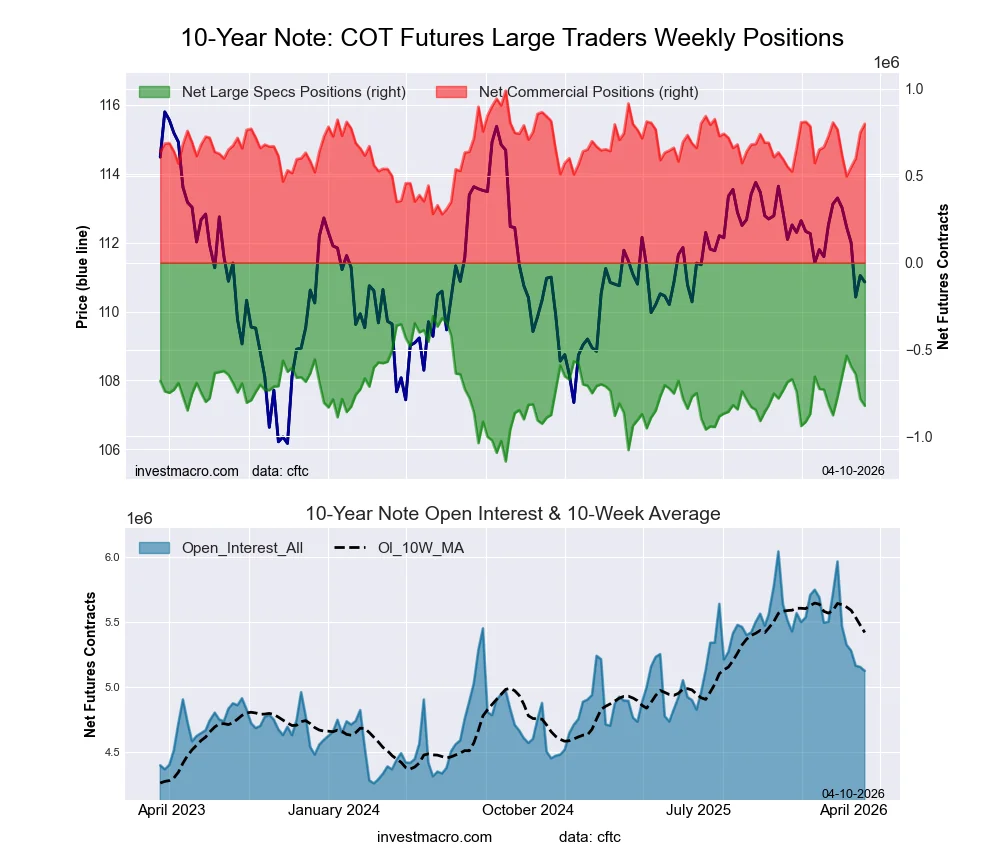
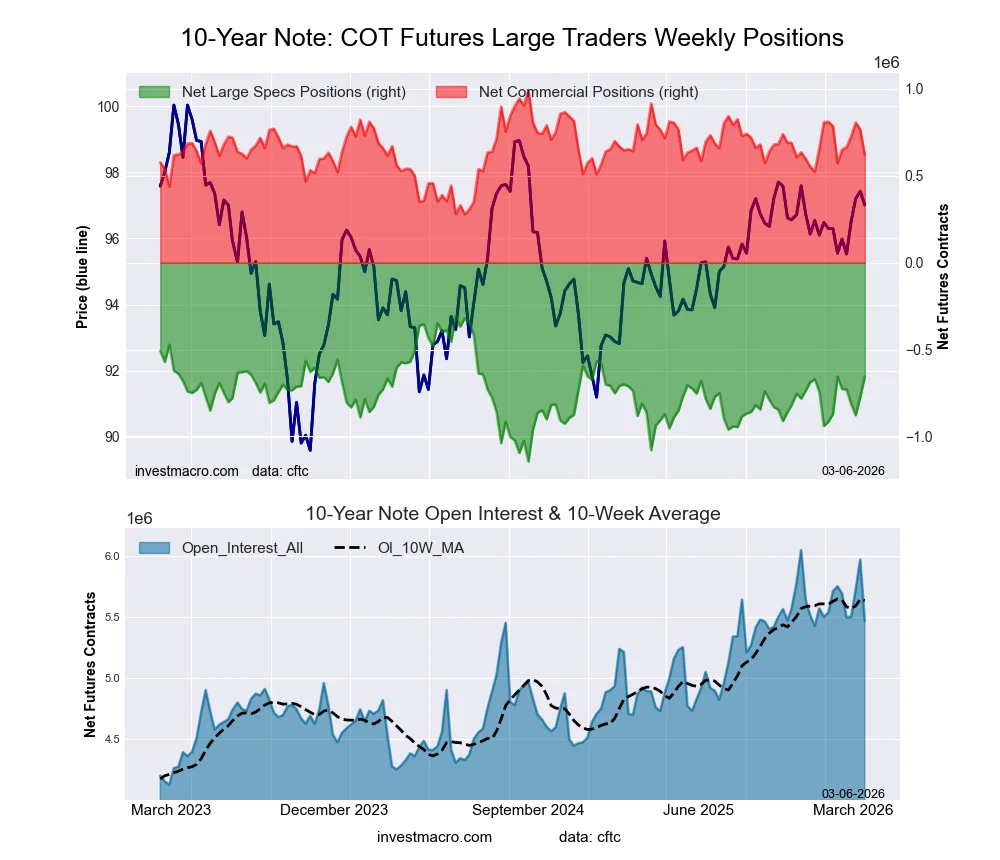
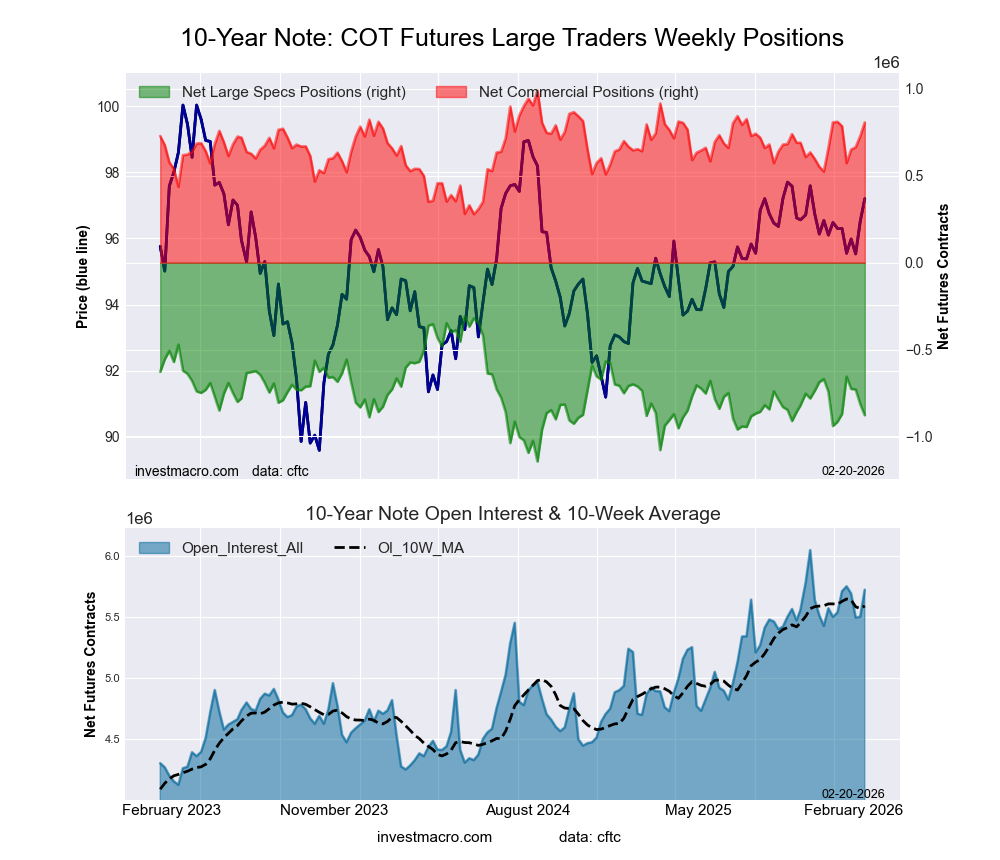
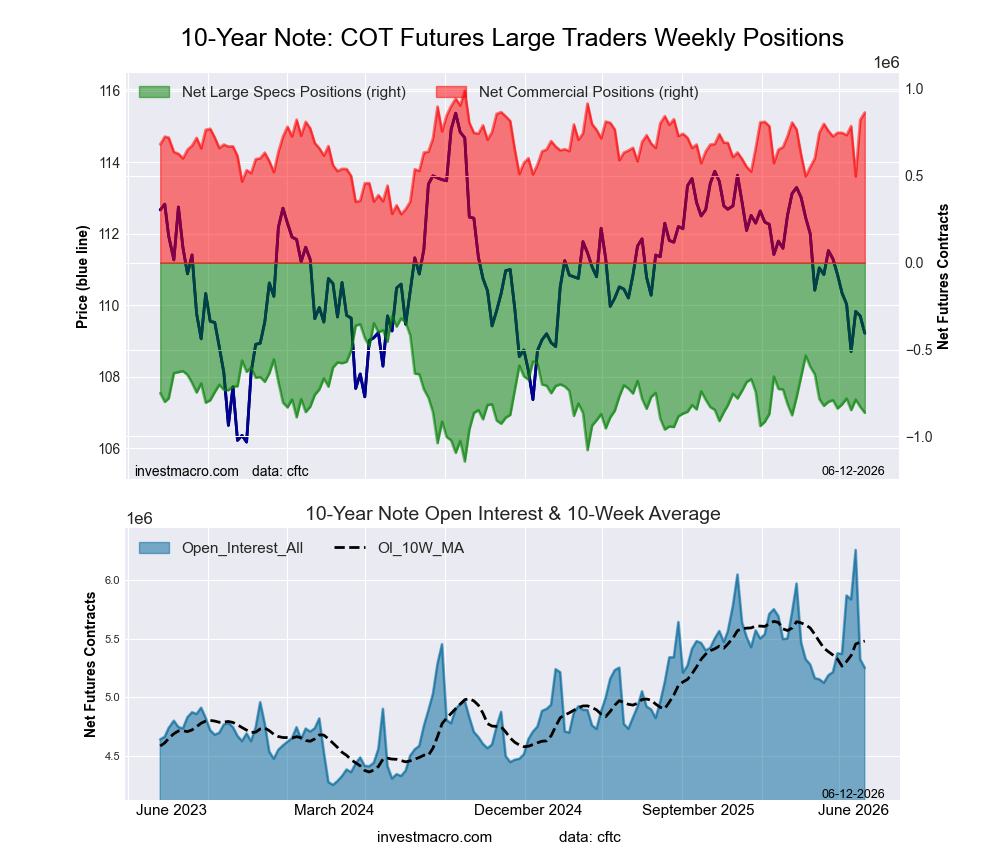
10-Year Treasury Note Futures:
 Positioning Notes:
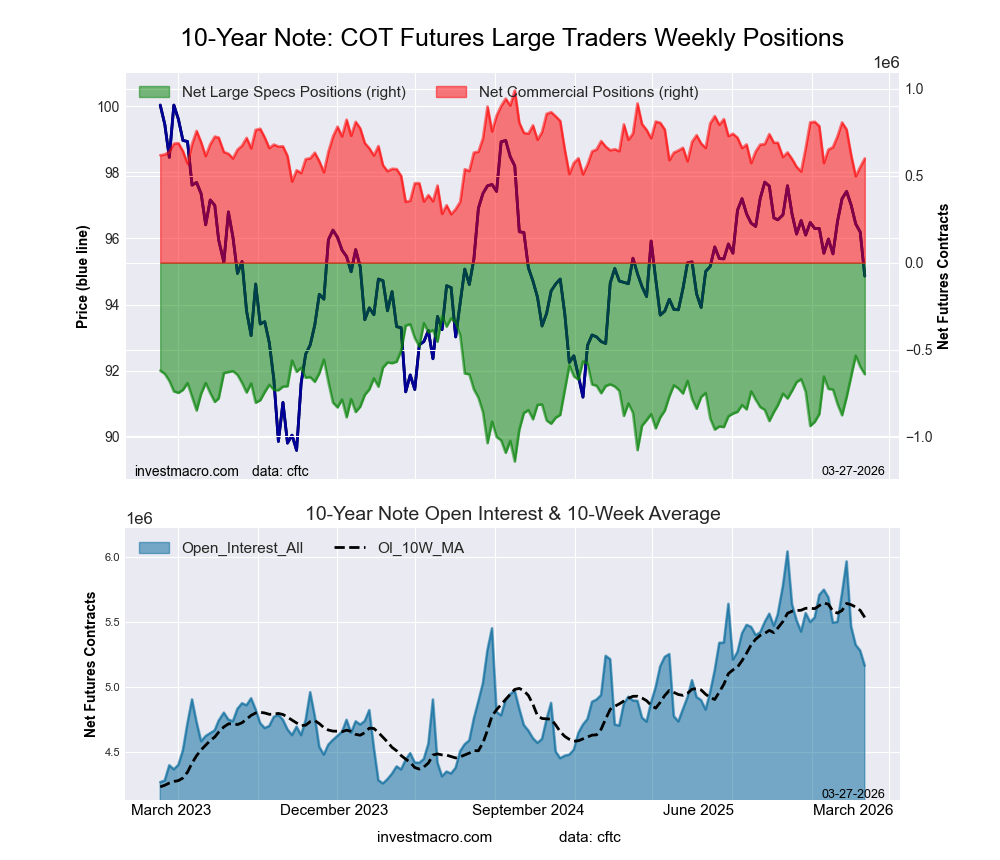
- 10-Year Treasury Note large speculator standing this week resulted in a net position of -863,807 contracts in the data reported through Tuesday.
- Weekly Speculator position lowering of -34,232 contracts from the previous week which had a total of -829,575 net contracts.
- This week’s current strength score (range over the past 3 years, measured from 0 to 100) shows the speculators are currently Bearish with a score of 33.5 percent.
- The Commercials are Bullish-Extreme with a score of 82.3 percent.
- The Small Traders (not shown in chart) are Bearish-Extreme with a score of 7.4 percent.
Price Trend-Following Model: Downtrend
Our weekly trend-following model classifies the current market price position as: Downtrend.
| 10-Year Treasury Note Statistics | SPECULATORS | COMMERCIALS | SMALL TRADERS |
| – Percent of Open Interest Longs: | 10.1 | 80.4 | 7.3 |
| – Percent of Open Interest Shorts: | 26.6 | 63.9 | 7.3 |
| – Net Position: | -863,807 | 864,695 | -888 |
| – Gross Longs: | 533,000 | 4,222,625 | 384,645 |
| – Gross Shorts: | 1,396,807 | 3,357,930 | 385,533 |
| – Long to Short Ratio: | 0.4 to 1 | 1.3 to 1 | 1.0 to 1 |
| NET POSITION TREND: | |||
| – Strength Index Score (3 Year Range Pct): | 33.5 | 82.3 | 7.4 |
| – Strength Index Reading (3 Year Range): | Bearish | Bullish-Extreme | Bearish-Extreme |
| NET POSITION MOVEMENT INDEX: | |||
| – 6-Week Change in Strength Index: | -3.0 | 16.4 | -29.1 |
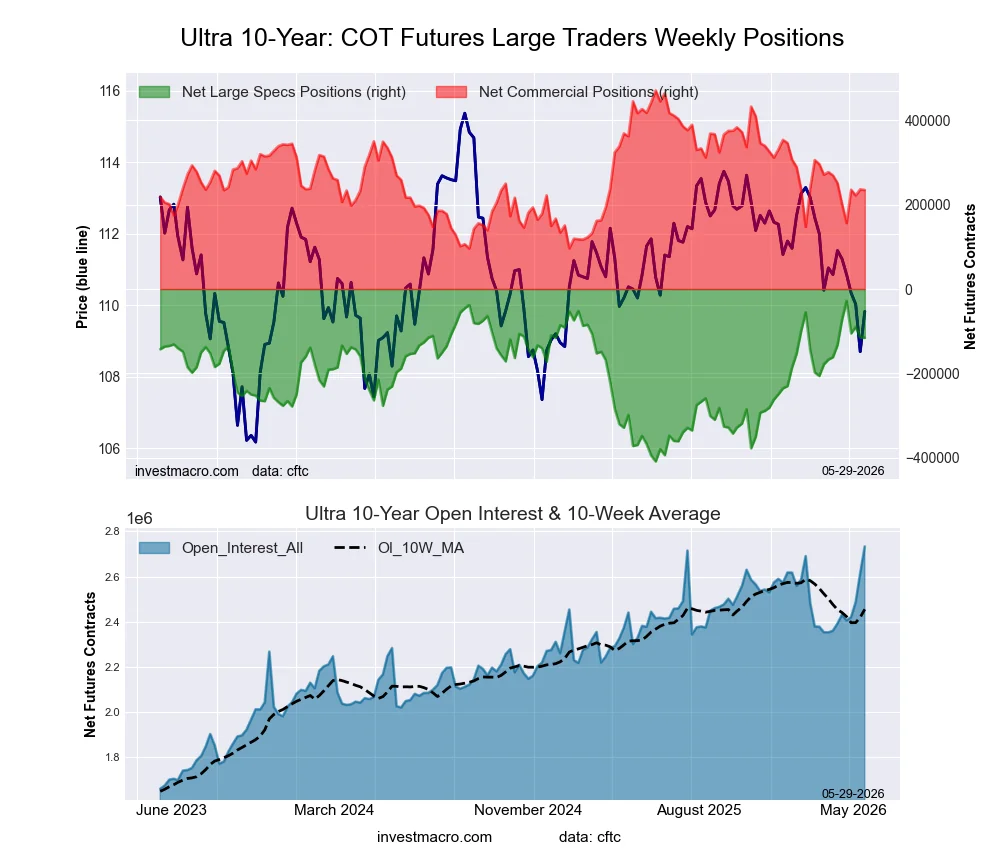
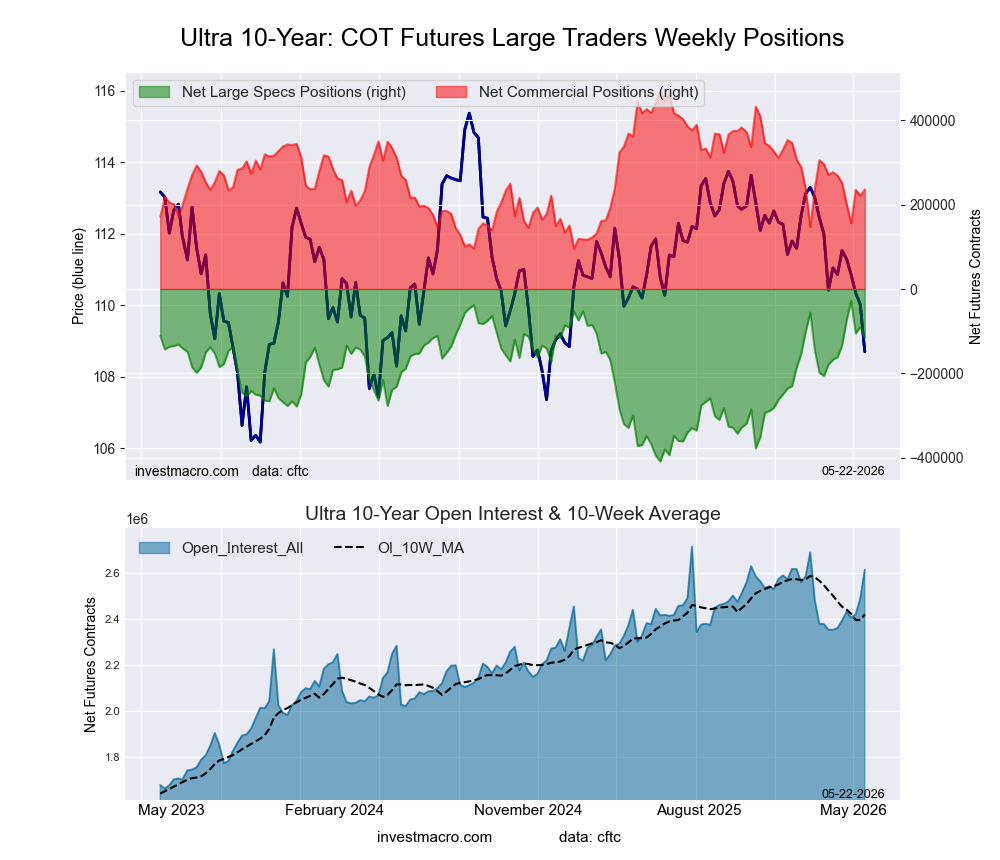
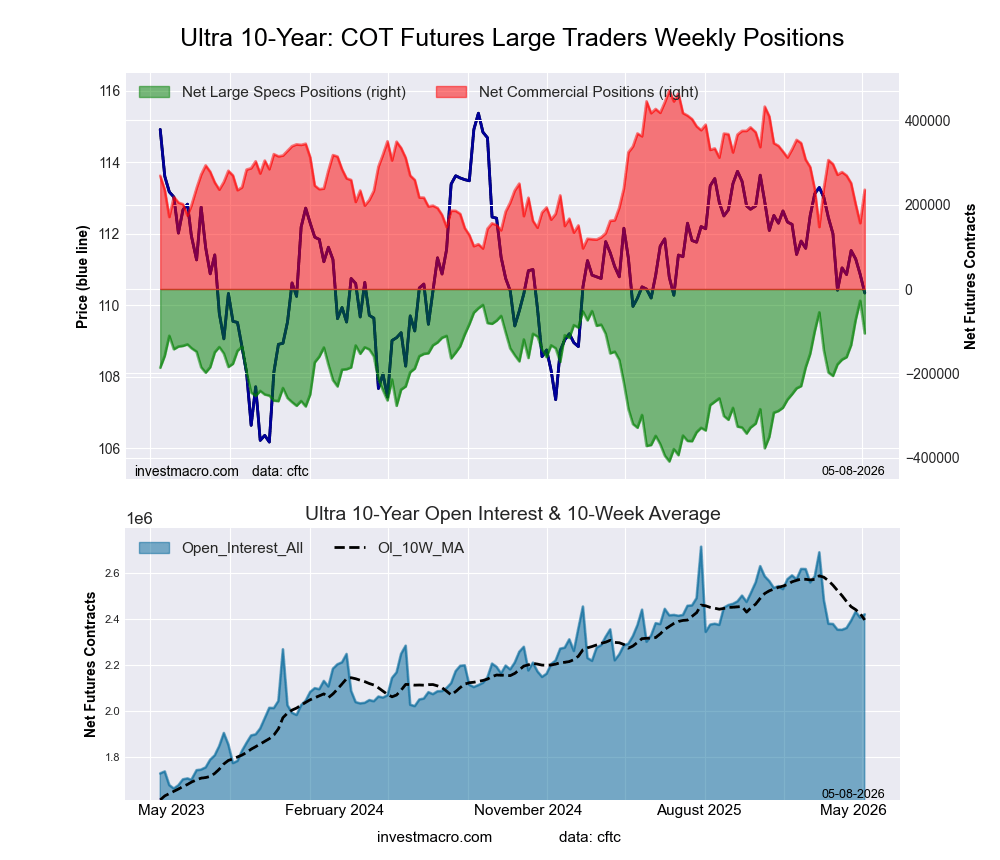
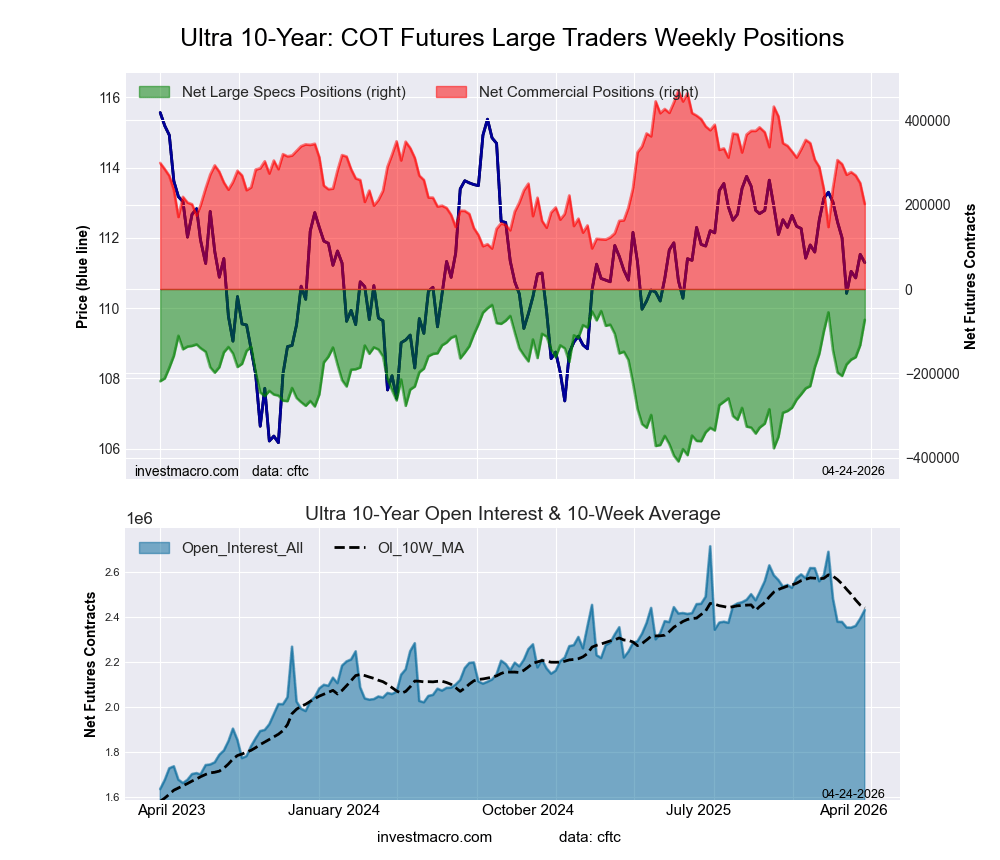
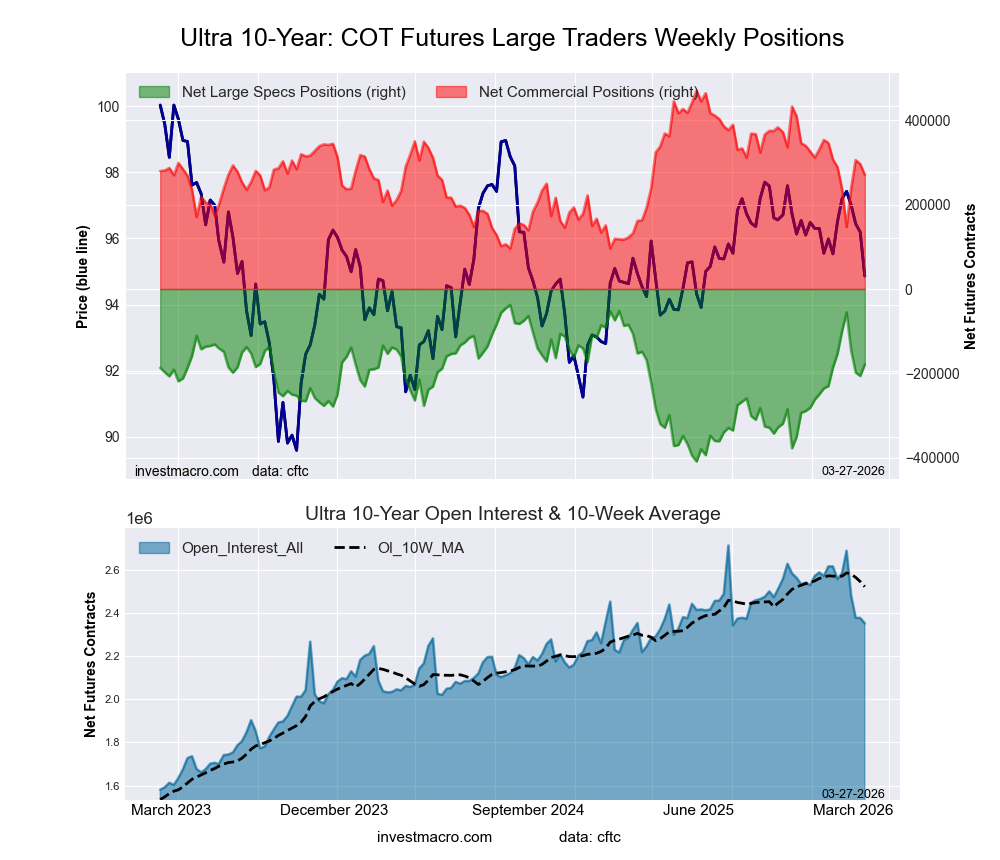
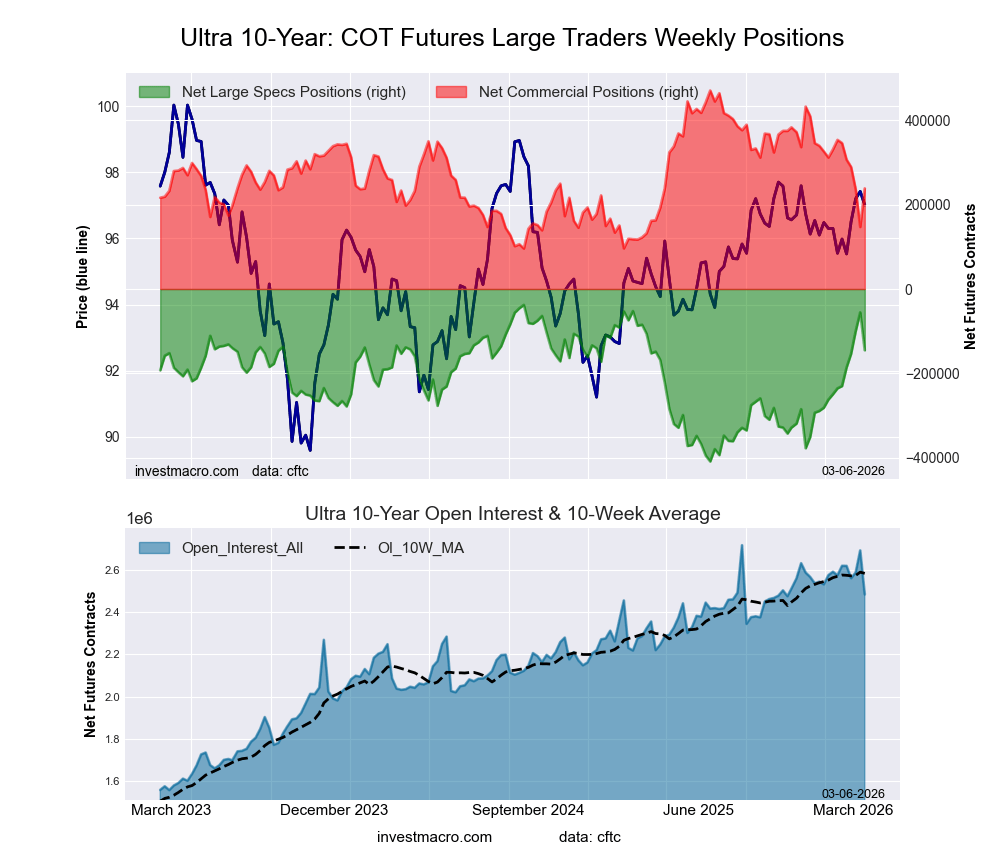
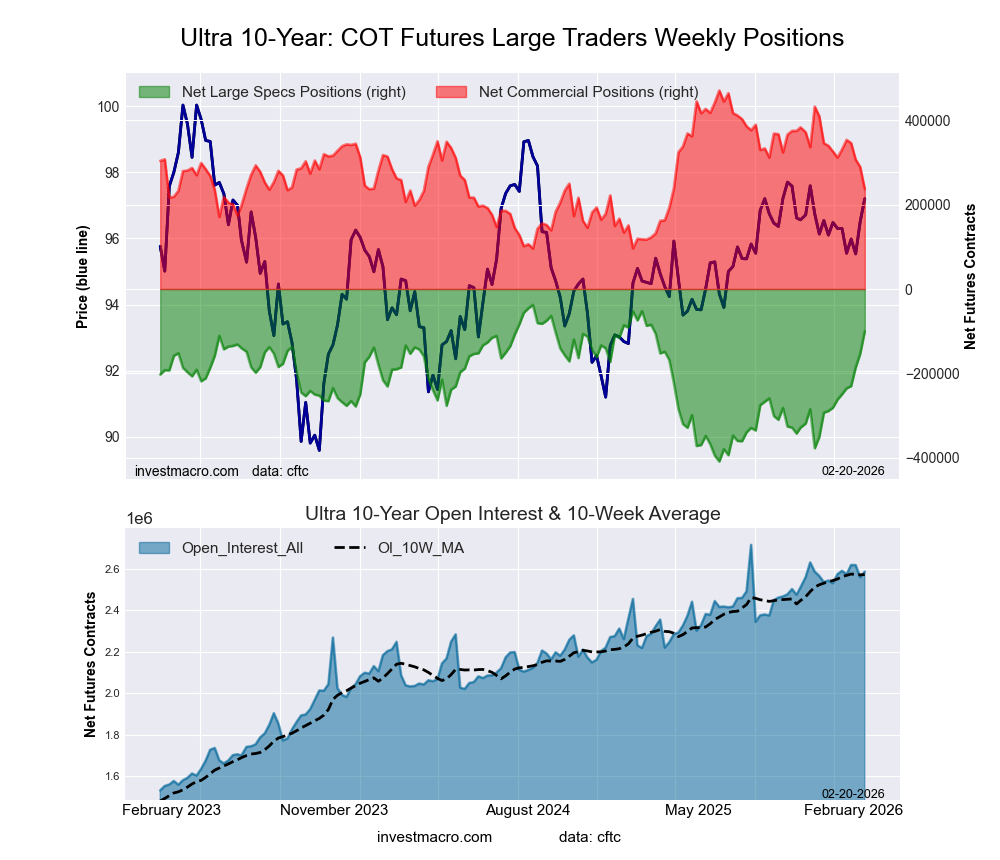
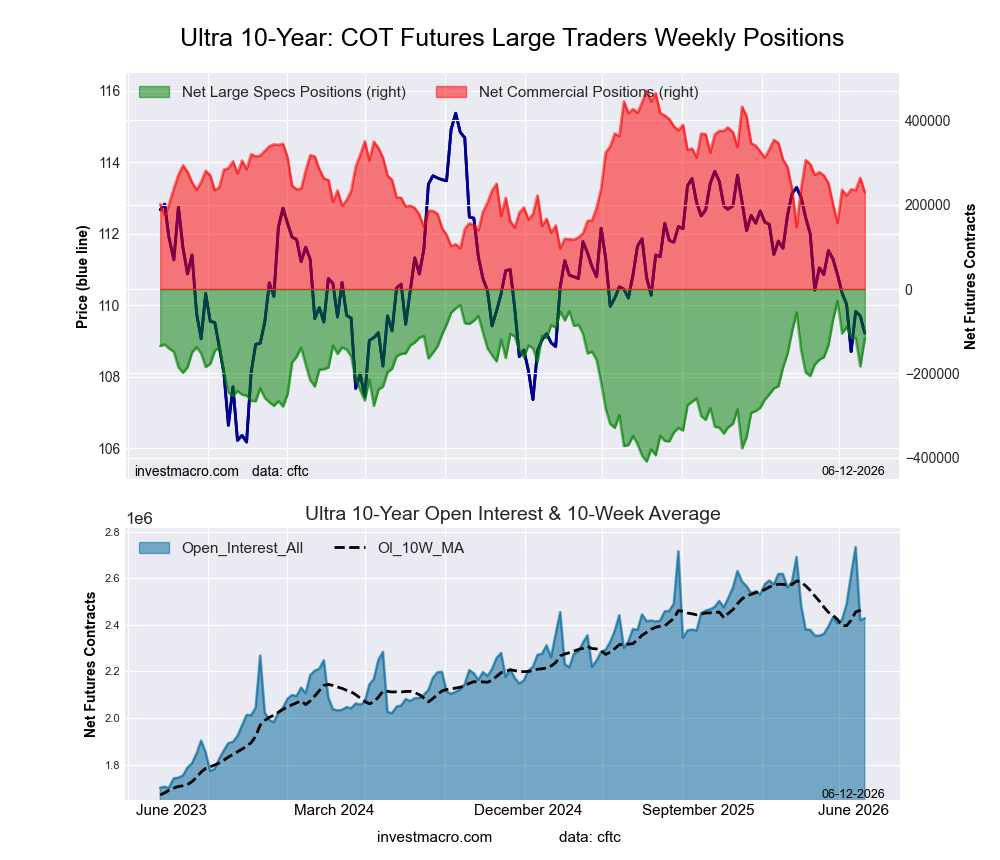
Ultra 10-Year Notes Futures:
 Positioning Notes:
- Ultra 10-Year Notes large speculator standing this week resulted in a net position of -117,107 contracts in the data reported through Tuesday.
- Weekly Speculator position gain of 65,983 contracts from the previous week which had a total of -183,090 net contracts.
- This week’s current strength score (range over the past 3 years, measured from 0 to 100) shows the speculators are currently Bullish with a score of 76.5 percent.
- The Commercials are Bearish with a score of 35.6 percent.
- The Small Traders (not shown in chart) are Bearish-Extreme with a score of 19.3 percent.
Price Trend-Following Model: Downtrend
Our weekly trend-following model classifies the current market price position as: Downtrend.
| Ultra 10-Year Notes Statistics | SPECULATORS | COMMERCIALS | SMALL TRADERS |
| – Percent of Open Interest Longs: | 9.7 | 81.3 | 7.9 |
| – Percent of Open Interest Shorts: | 14.5 | 71.8 | 12.5 |
| – Net Position: | -117,107 | 229,011 | -111,904 |
| – Gross Longs: | 234,404 | 1,972,879 | 192,813 |
| – Gross Shorts: | 351,511 | 1,743,868 | 304,717 |
| – Long to Short Ratio: | 0.7 to 1 | 1.1 to 1 | 0.6 to 1 |
| NET POSITION TREND: | |||
| – Strength Index Score (3 Year Range Pct): | 76.5 | 35.6 | 19.3 |
| – Strength Index Reading (3 Year Range): | Bullish | Bearish | Bearish-Extreme |
| NET POSITION MOVEMENT INDEX: | |||
| – 6-Week Change in Strength Index: | -23.5 | 19.6 | 12.6 |
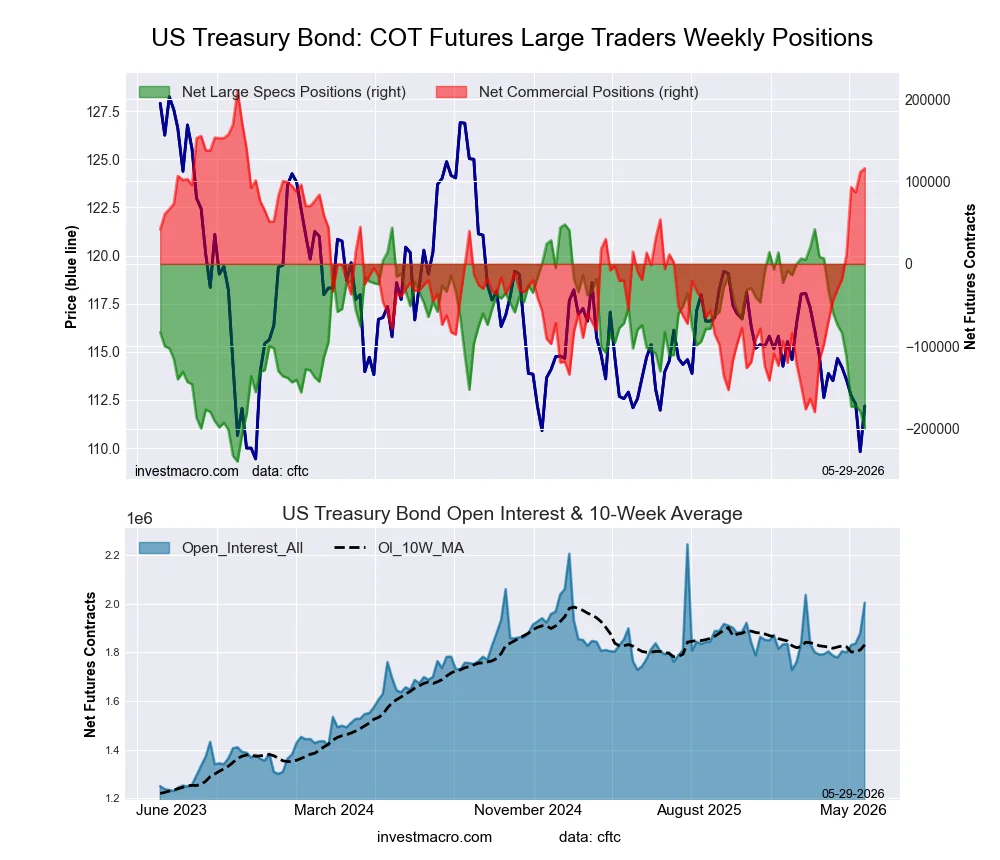
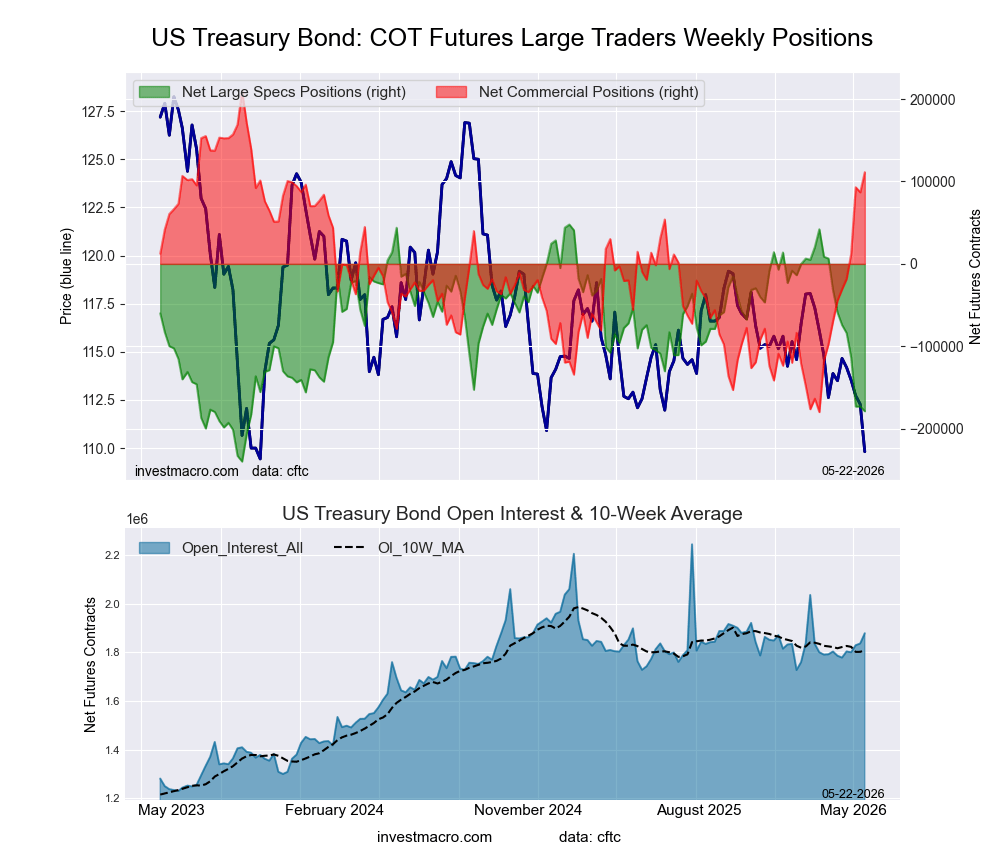
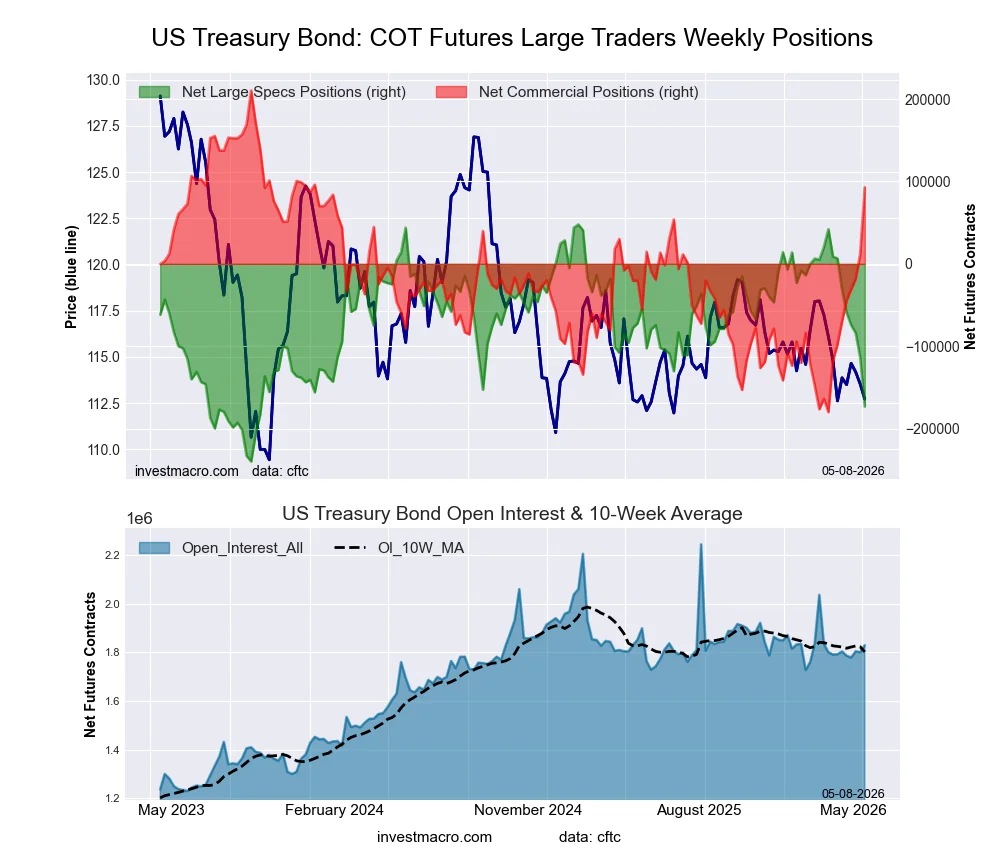
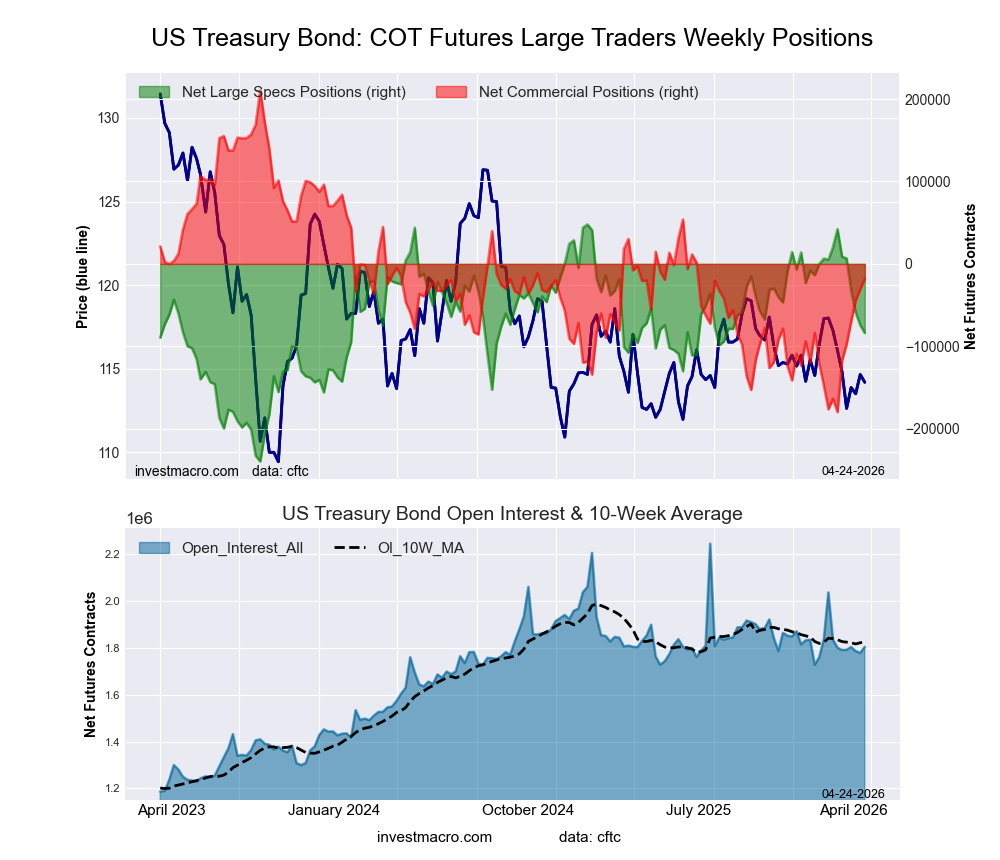
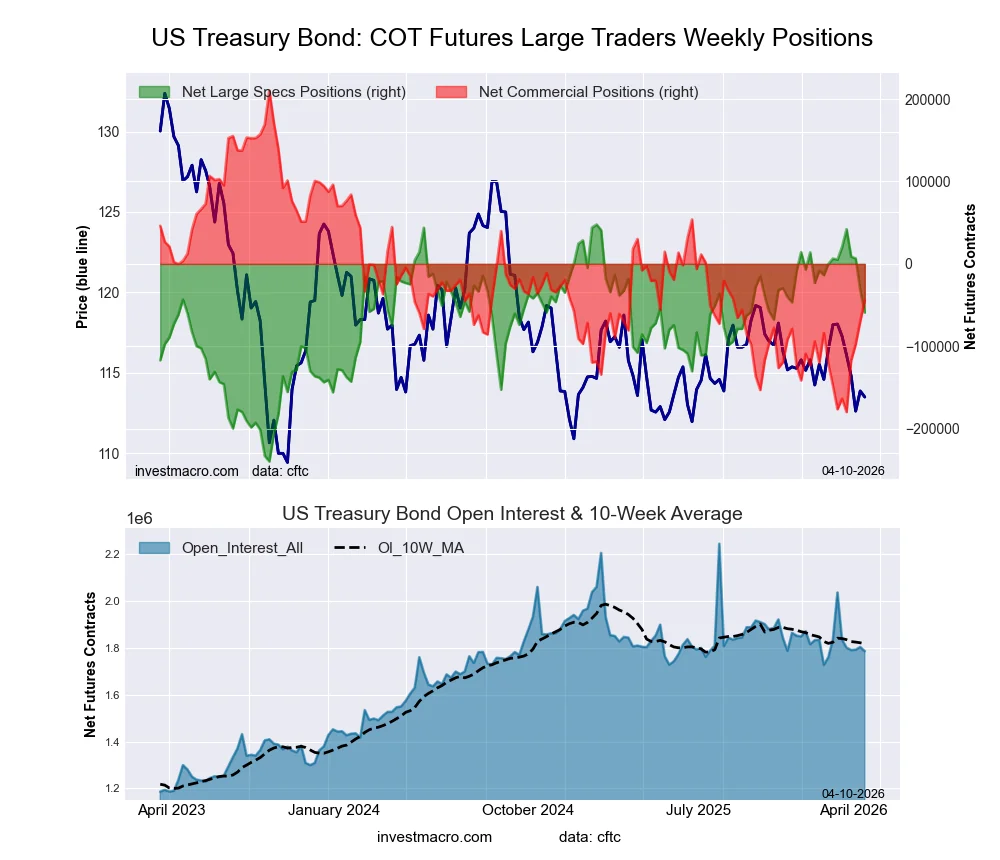
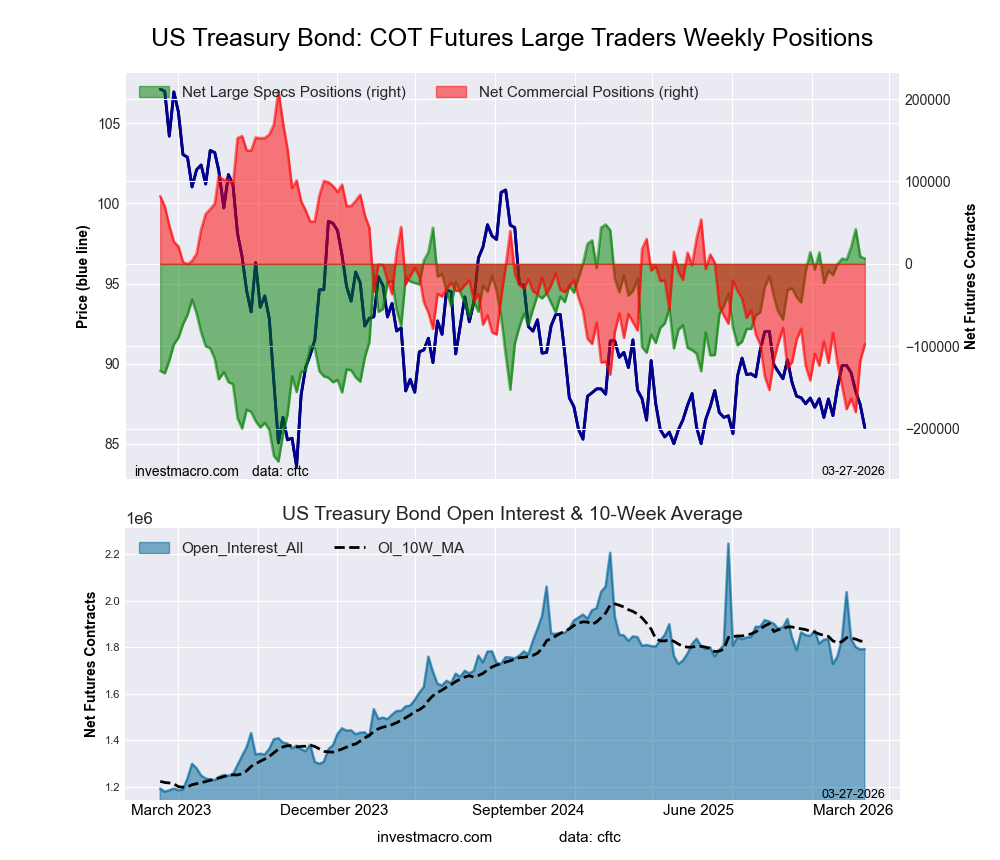
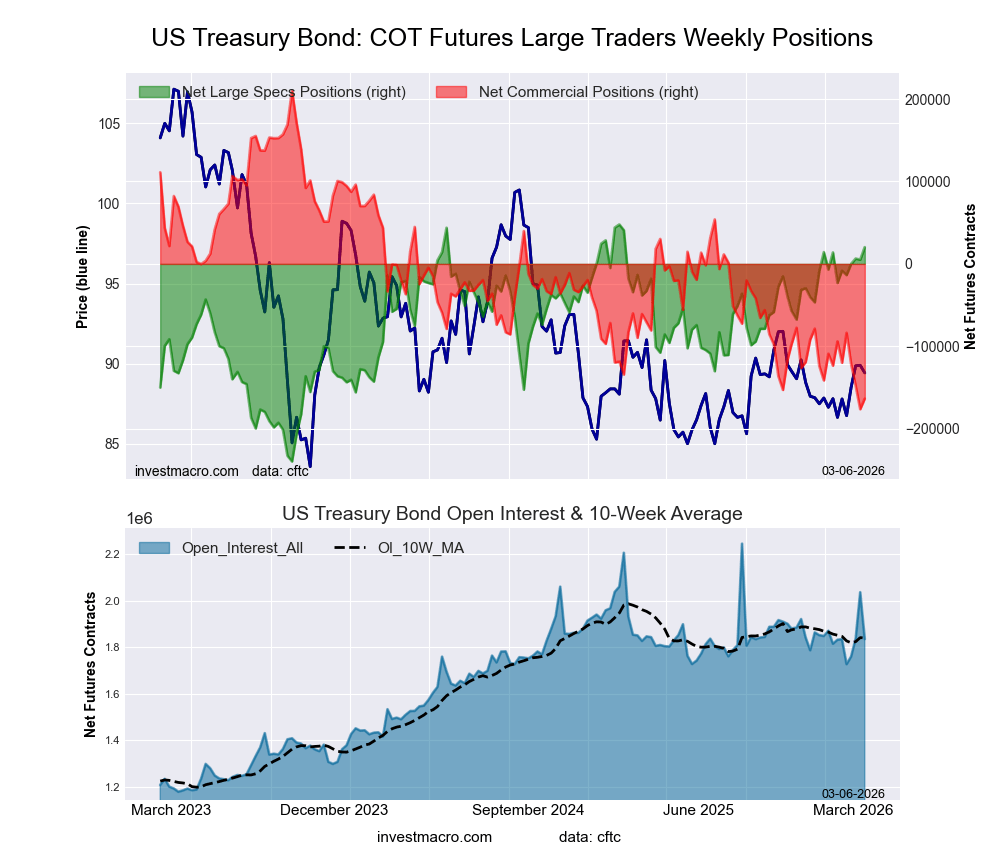
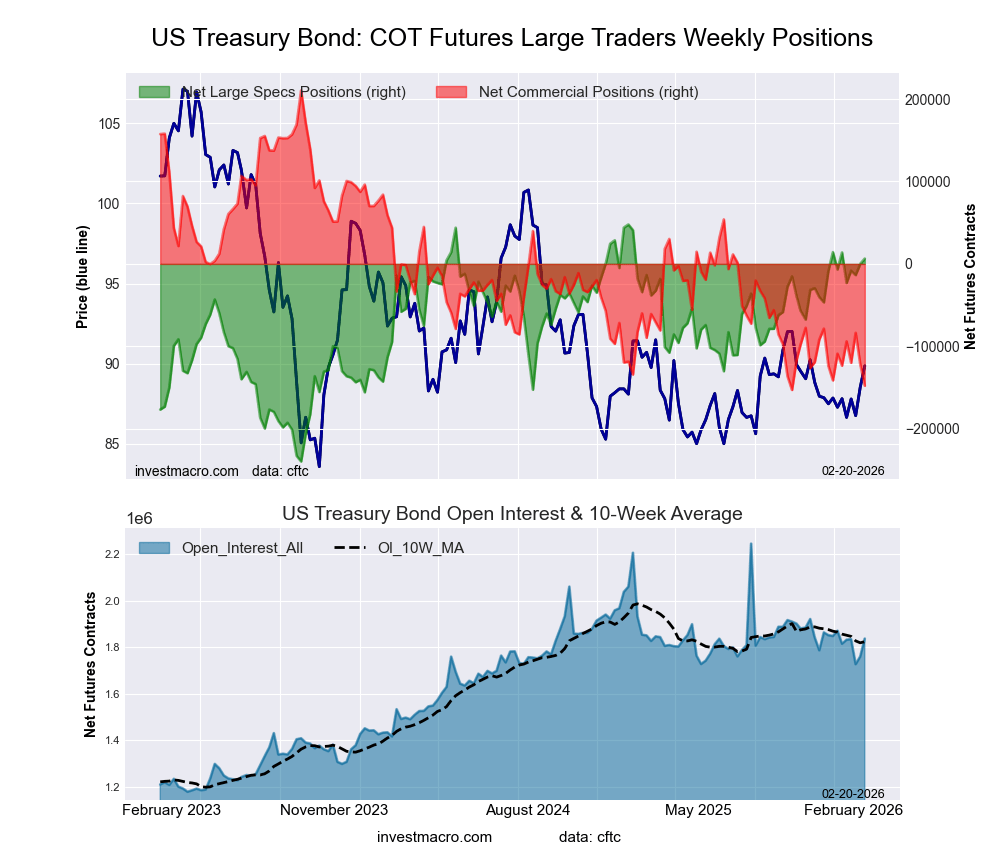
US Treasury Bonds Futures:
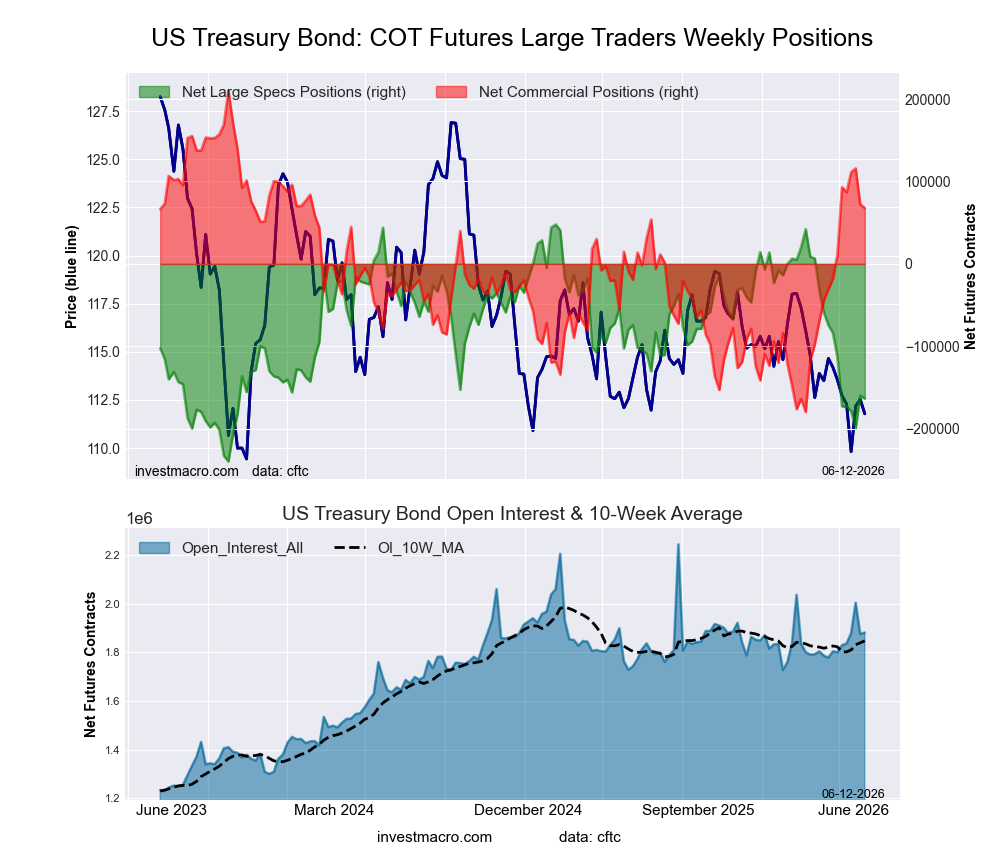 Positioning Notes:
- US Treasury Bonds large speculator standing this week resulted in a net position of -163,305 contracts in the data reported through Tuesday.
- Weekly Speculator position decline of -3,452 contracts from the previous week which had a total of -159,853 net contracts.
- This week’s current strength score (range over the past 3 years, measured from 0 to 100) shows the speculators are currently Bearish with a score of 26.6 percent.
- The Commercials are Bullish with a score of 63.5 percent.
- The Small Traders (not shown in chart) are Bearish with a score of 47.2 percent.
Price Trend-Following Model: Downtrend
Our weekly trend-following model classifies the current market price position as: Downtrend.
| US Treasury Bonds Statistics | SPECULATORS | COMMERCIALS | SMALL TRADERS |
| – Percent of Open Interest Longs: | 11.4 | 75.5 | 12.2 |
| – Percent of Open Interest Shorts: | 20.1 | 71.9 | 7.2 |
| – Net Position: | -163,305 | 67,844 | 95,461 |
| – Gross Longs: | 214,112 | 1,420,514 | 230,427 |
| – Gross Shorts: | 377,417 | 1,352,670 | 134,966 |
| – Long to Short Ratio: | 0.6 to 1 | 1.1 to 1 | 1.7 to 1 |
| NET POSITION TREND: | |||
| – Strength Index Score (3 Year Range Pct): | 26.6 | 63.5 | 47.2 |
| – Strength Index Reading (3 Year Range): | Bearish | Bullish | Bearish |
| NET POSITION MOVEMENT INDEX: | |||
| – 6-Week Change in Strength Index: | -17.3 | 14.3 | -4.4 |
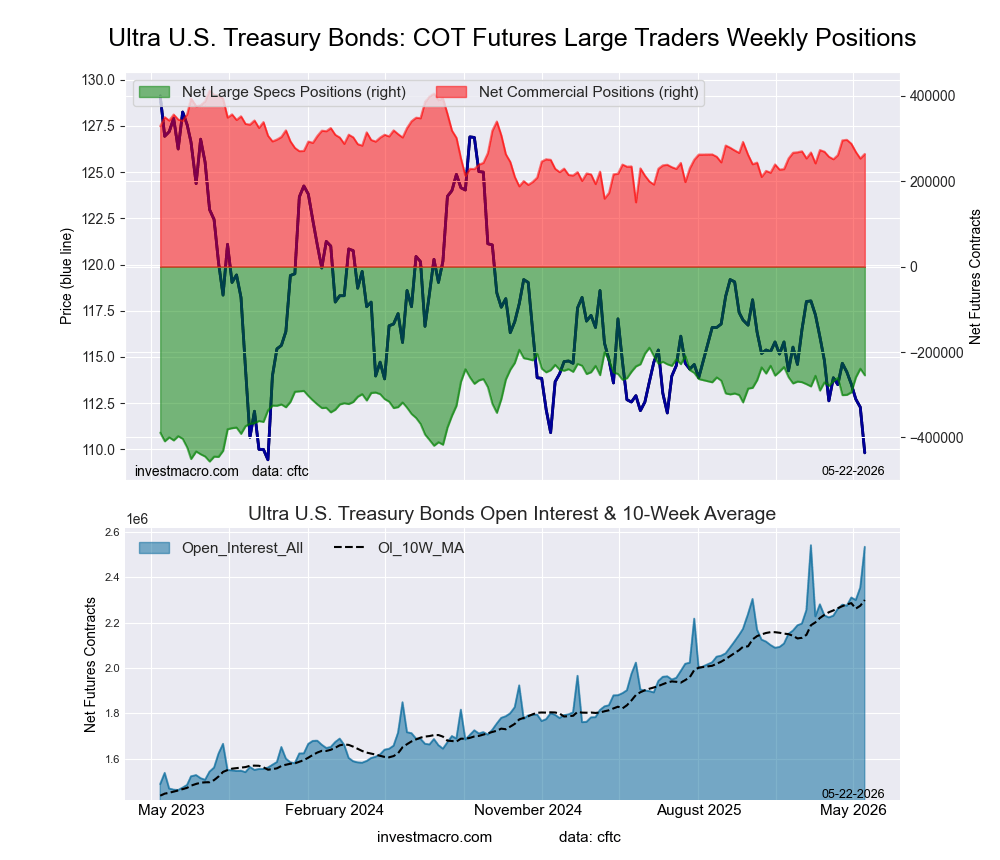
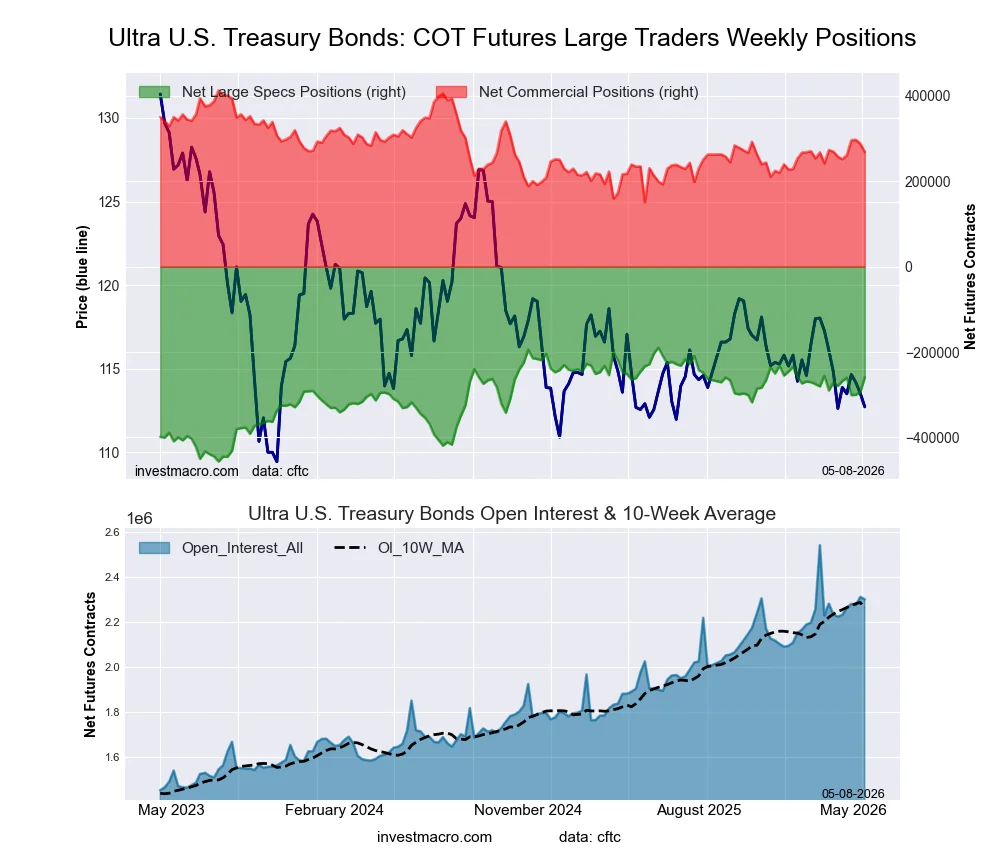
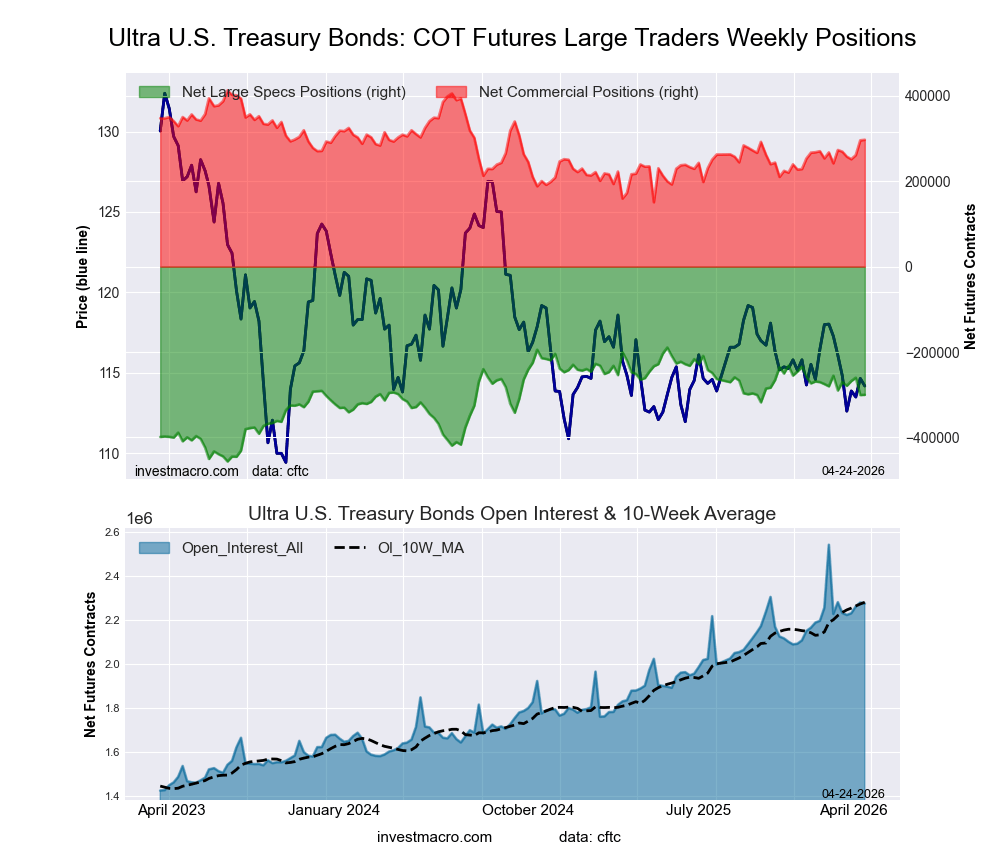
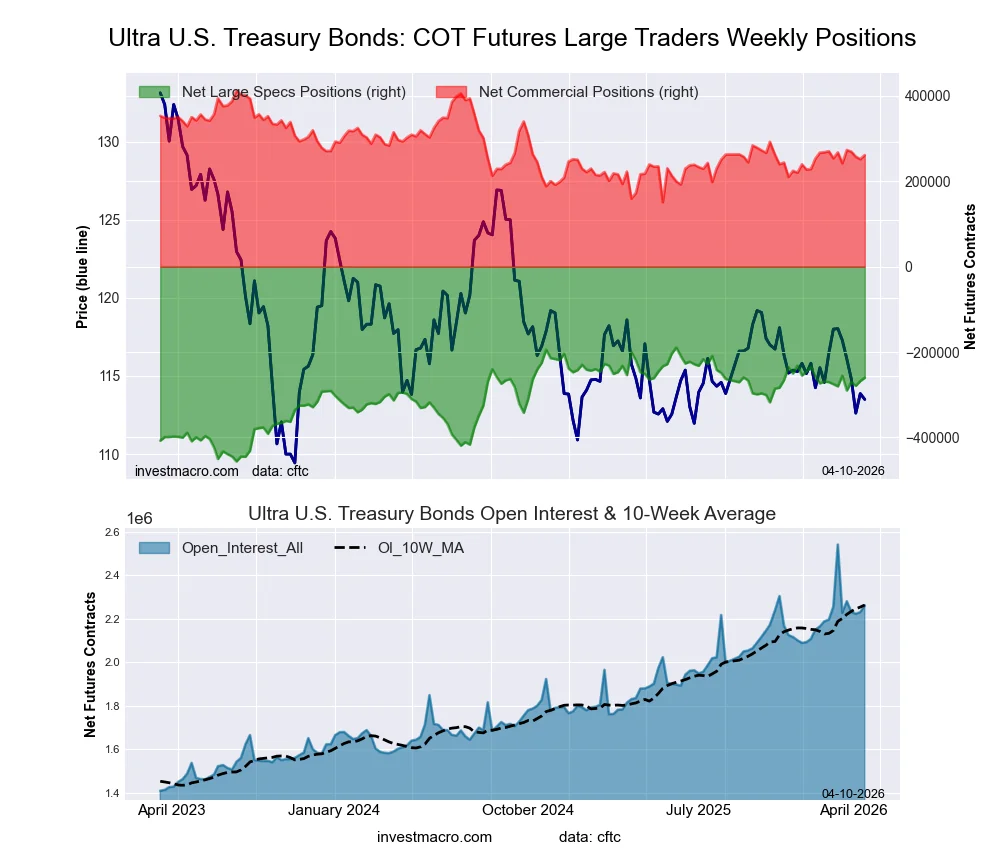
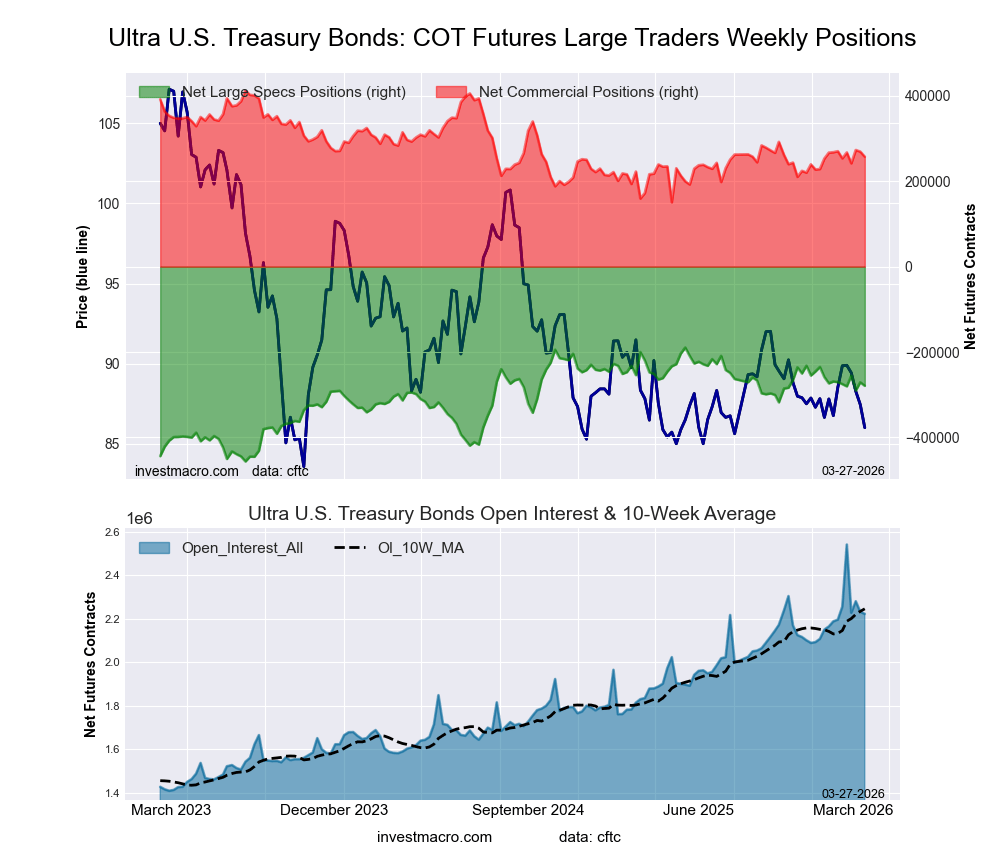
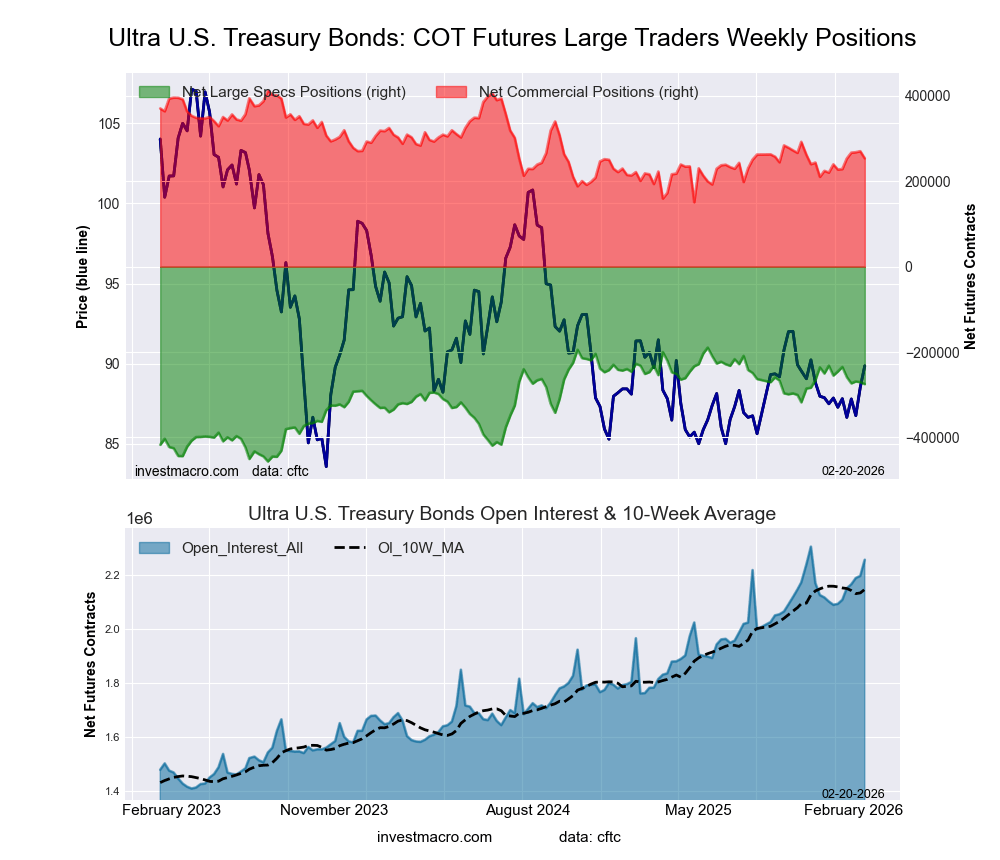
Ultra US Treasury Bonds Futures:
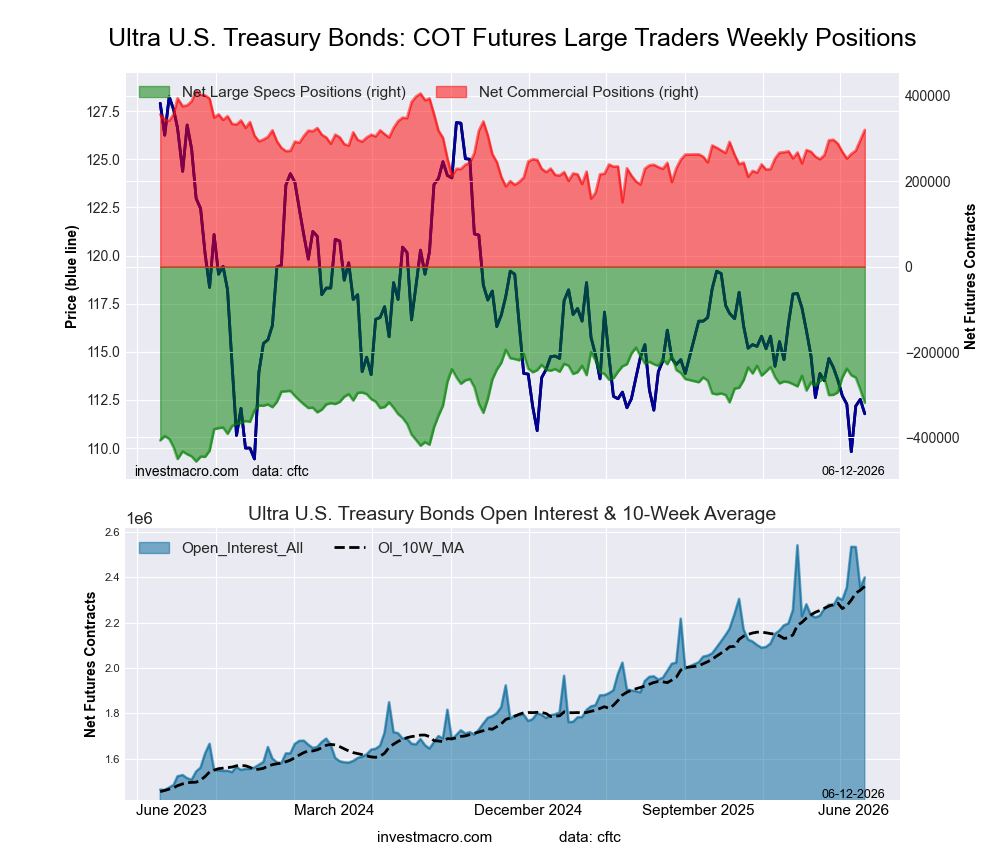 Positioning Notes:
- Ultra US Treasury Bonds large speculator standing this week resulted in a net position of -318,731 contracts in the data reported through Tuesday.
- Weekly Speculator position decline of -31,021 contracts from the previous week which had a total of -287,710 net contracts.
- This week’s current strength score (range over the past 3 years, measured from 0 to 100) shows the speculators are currently Bullish with a score of 51.6 percent.
- The Commercials are Bullish with a score of 64.7 percent.
- The Small Traders (not shown in chart) are Bearish-Extreme with a score of 13.6 percent.
Price Trend-Following Model: Downtrend
Our weekly trend-following model classifies the current market price position as: Downtrend.
| Ultra US Treasury Bonds Statistics | SPECULATORS | COMMERCIALS | SMALL TRADERS |
| – Percent of Open Interest Longs: | 5.6 | 85.3 | 7.6 |
| – Percent of Open Interest Shorts: | 18.9 | 71.9 | 7.6 |
| – Net Position: | -318,731 | 320,235 | -1,504 |
| – Gross Longs: | 133,885 | 2,046,697 | 181,460 |
| – Gross Shorts: | 452,616 | 1,726,462 | 182,964 |
| – Long to Short Ratio: | 0.3 to 1 | 1.2 to 1 | 1.0 to 1 |
| NET POSITION TREND: | |||
| – Strength Index Score (3 Year Range Pct): | 51.6 | 64.7 | 13.6 |
| – Strength Index Reading (3 Year Range): | Bullish | Bullish | Bearish-Extreme |
| NET POSITION MOVEMENT INDEX: | |||
| – 6-Week Change in Strength Index: | -9.2 | 12.3 | -8.0 |
Article By InvestMacro – Receive our weekly COT Reports by Email
*COT Report: The COT data, released weekly to the public each Friday, is updated through the most recent Tuesday (data is 3 days old) and shows a quick view of how large speculators or non-commercials (for-profit traders) were positioned in the futures markets.
The CFTC categorizes trader positions according to commercial hedgers (traders who use futures contracts for hedging as part of the business), non-commercials (large traders who speculate to realize trading profits) and nonreportable traders (usually small traders/speculators) as well as their open interest (contracts open in the market at time of reporting).See CFTC criteria here.
All information and opinions on this website and contained in this article are for general informational purposes only and do not constitute investment advice.