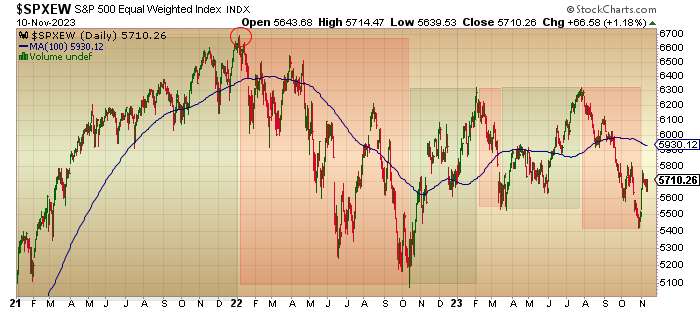
As we head into the home stretch for calendar year 2023, it is no secret that the vast majority of stocks have been in a downtrend since January 2022. While the S&P 500 is calculated using an inordinate weighting in seven mega-cap stocks, the Unweighted S&P 500 (shown below) has been thrashing about for the better part of two years, leaving the majority of traders and investors feeling like they have been left behind.
No New Highs
Because stocks have not seen a new high in 22 months, an entire generation is in a complete quandary these days, completely unfamiliar with how to navigate a market that no longer has the support of the Federal Reserve. No more quantitative easing, no more zero interest rate policy, and no more Plunge Protection Team, all serving to deliver up juicy stock market profits resulting in handsome performance bonuses with amazing regularity every single year since March 2009. Not even a global pandemic and economic shutdown could derail the bull or the expansion, thanks to copious helicopter cash drops and banking system life jackets.
Despite a shockingly obvious attempt in 2023 by the Wall Street spin doctors to create a new “flaveur de jour” called “Artificial Intelligence,” the new narrative designed to lure the masses back into the excitement of stock market participation was successful in creating a brand new breed of worthless companies all claiming to be leaders in the field of “AI,” but it all ended in July and after a painful September and terrorist-ravaged October, these poor stock trading children are once again plunged back into the reality of what we old folks had to deal with before Hank Paulson and Ben Bernanke bailed out a gaggle of criminally-responsible banks and taught new “kiddie fleet” how to “live long and plunder” without having to read a balance sheet or income statement.
I have been astounded all through September and October how legion after legion of Millennials and Genexers that came into the world of stocks and bonds after the 2008 GFC have gone from the “Buy the Effing Dip” mentality to “Sell the Effing Rip” mentality while fully convinced that the “new normal” of a hostile Fed was going to bring on the Crash of ’23.
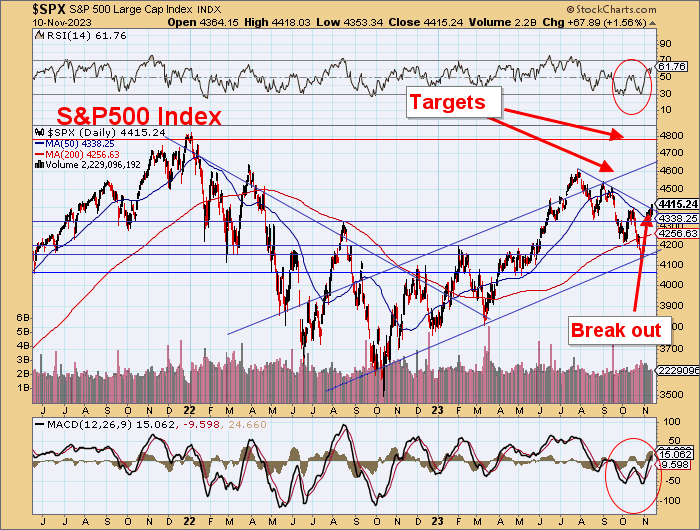
The S&P 500 is now a full 312 points off those October lows, and this new generation of doom-and-gloom bears is still working off the “hard landing” platform that calls for new lows that will take out the October 2022 nadir and suck the life out of the “everything bubble” once and for all.
Now, we are nine days into November, and they are exhibiting behavior that is completely typical of the early stages of a new bull market. They are mere shadows of the brash, confident, take-on-the-world “super-traders” that took GME from $0.70 to $120 in 2021. They are beaten, battered, self-professed victims of an unfair world where their “divine right” of stock market riches was ripped away from them by the evil Boomers that rule the world.
Unfortunately, they are also displaying behaviors quite normal after extended periods of stagnant or declining prices; they are infected with a recency bias that has imprisoned them in a blind fog of delusion. Whereas the phrase “The Fed has our backs” emboldened a cherubic group of fuzzy-face day-traders after 2009, the phrase “higher for longer” denotes the level of pain these kids are being forced to endure in the new normal of laisser-faire investing.
The S&P 500 is now a full 312 points off those October lows, and this new generation of doom-and-gloom bears is still working off the “hard landing” platform that calls for new lows that will take out the October 2022 nadir and suck the life out of the “everything bubble” once and for all.
Finally, if I am forced to watch one more Instagram video of a 20-something girl in designer clothes and a Coach bag daubing her eyes and sniffling into the camera because after paying her bills every month, “I have nothing left for a life — no clubs, no holidays in Cancun, no health club — NOTHING!”, I am going to fire my old ten-pound eight-ball pencil sharpener through the monitor. Every generation since Omar the Club Wielder picked up chicks by thumping them over the head has had to make sacrifices at one time or another. Get used to it.
Stocks
With the exception of a minor Powell-inflicted setback on Thursday, the SPDR S&P 500 ETF (SPY:NYSE) went out at $440.19, which is the highest since the October 17 close at $438.14 and is now threatening to test the September high at $449.49.
With the relative strength index (“RSI”) at 62.15, there is still more room, especially if it clears the downtrend line drawn off the July-September tops.
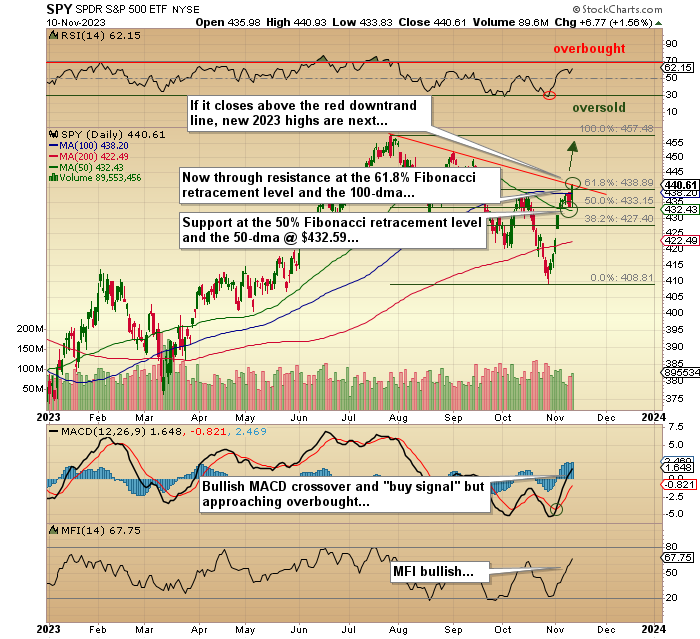
I am long in two equal tranches of calls, with the SPY Dec $ 445 costing $7.75 (bought pre-Israel-Hamas) and the Dec $425 calls costing $6.89 (bought end-of-month). They closed out the week at $5.41 and $20.15, respectively, and thus have turned a public flogging with cat-o-nine-tails into a six-band parade in a mere nine days.
As I have been chirping about since September, when the sky was falling all around us, the probability of a face-ripping year-end rally was high, and despite the events in the Middle East, performance-chasing portfolio managers had to buy stocks. And buying them, they are certainly doing with the panic phase not yet even begun. Add to that the massive short position in the long end of the bond market (specifically the iShares 20+ Year Treasury Bond ETF (TLT:US)), and you have a wonderful concoction of short-squeeze ingredients all simmering beautifully on the stock market stove.
While there are still possible speed bumps in the road ahead, I think those visions of bonus-driven sugar plums dancing in the heads of thousands of underweight and underperforming portfolio managers will drive stocks higher right up until the bonus cheques hit their bank accounts in early January. Then watch how fast the bullish narrative switches back to “hard landing” economics and “lag effect” lacerations halting the rally.
Gold and Silver
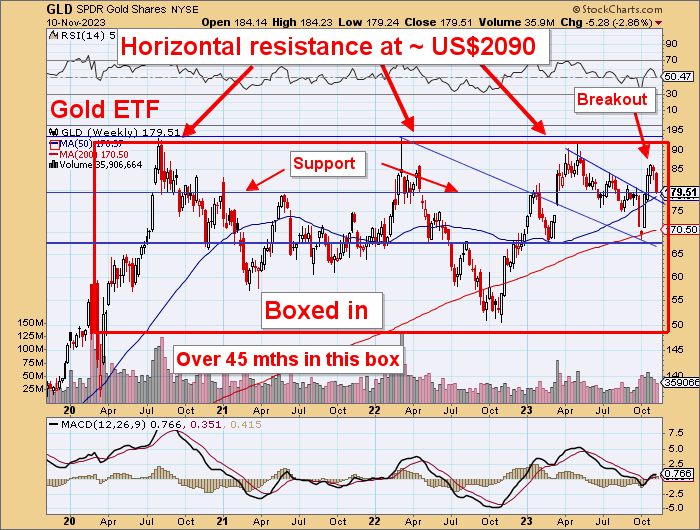
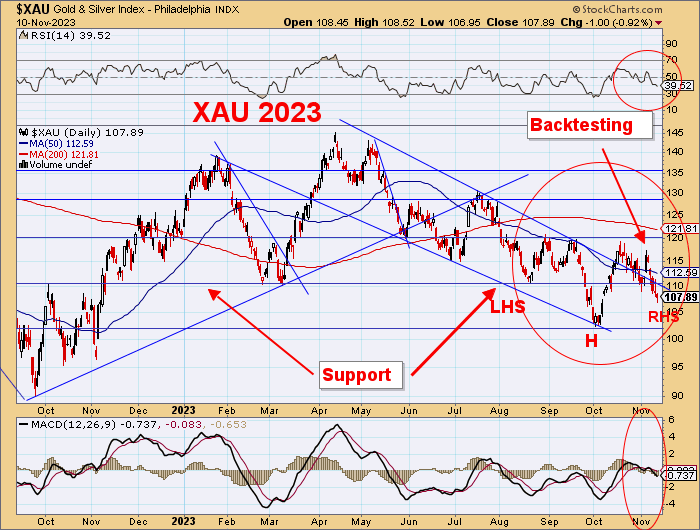
If I had to make a bet, the year 2023 is going to be considered the year that even the staunchest of bulls throw in the towel and pronounce gold to be “a barbarous relic.”
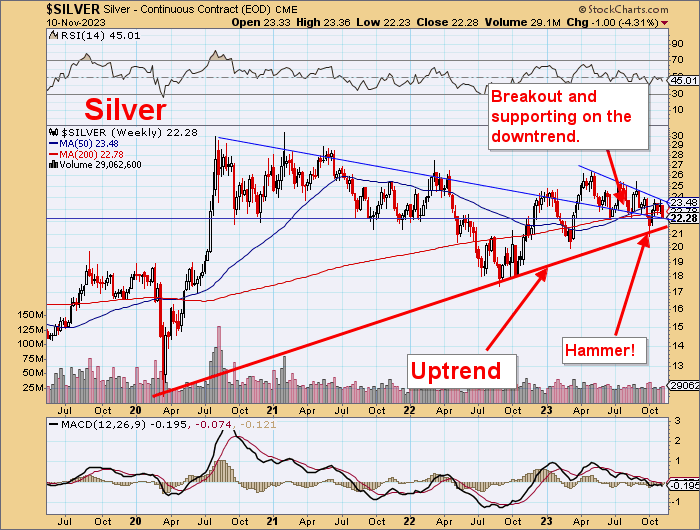
I can see from my Twitter feed that the youngsters are all feeling physically invaded by the abysmal performance of silver, which is certainly the most heavily promoted of all the metals. I would argue that copper has been just as dismal as silver, but just not on as many radar screens. You will never find the 500 tweets a day calling for a crash in the U.S. dollar that will take copper “to da moon” (followed by ten exclamation marks) like there was last August when the BRICS conference was being trotted out as the “seminal event” that would eliminate the U.S. dollar’s reserve currency status and take gold and silver to atmospheric levels.
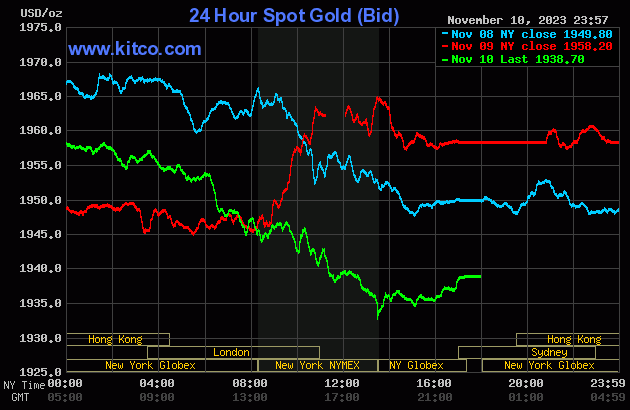
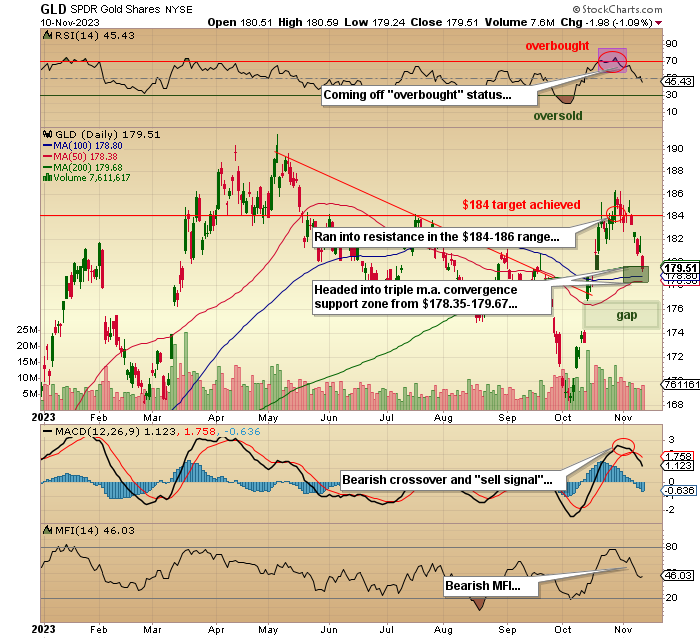
I am on the record as having dumped my SPDR Gold Shares ETF (GLD:NYSE) trading positions above $184 as spot gold cranked out to $2,019 into the geopolitical maelstrom of early October, but all that represented was a trading decision and in no way altered my expectations for new highs, albeit the actions of the bullion banks late last month completely neutralized my call for “new all-time highs by New Year’s Day.”
They provided over 70,000 contracts representing over 7 million ounces of phony, notional gold, and under the weight of such oppressive supply, those “gold to da moon!” buyers were once again pistol-whipped into submission with the GLD:NYSE going out under $180 and spot gold below $1,940.
What people should recognize is that gold (and to a lesser degree silver) are considered “Enemies of the State,” and despite the U.S. being the (alleged) holder of 8,133 metric tonnes of the yellow metal, their two primary foes — Russia and China — are stockpiling it in record quantities and are soon quite likely to surpass the U.S. as the holders of the largest cache of real money on the planet. That allows for two speculative possibilities: the first is that the U.S. has already sold all of its gold and is actually short 286 million ounces and needs to keep a lid on prices until they figure out how to extricate itself from yet “another fine mess.”
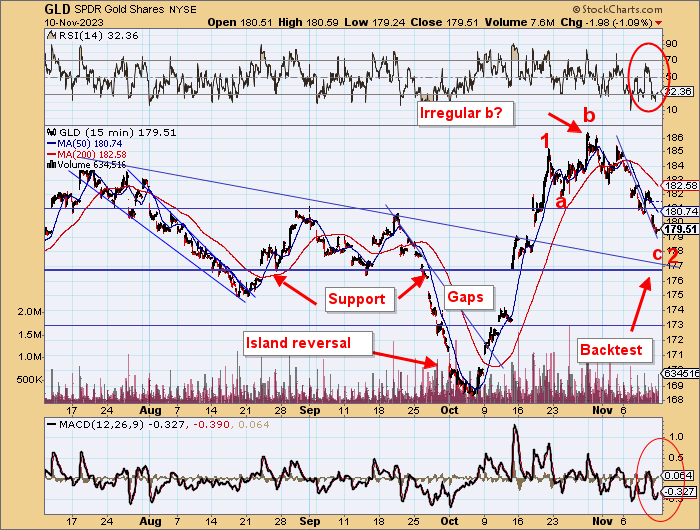
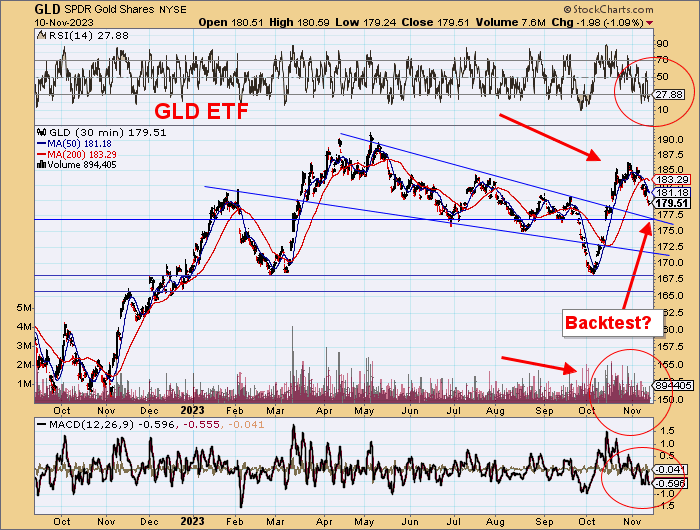
The level on the GLD:NYSE (now $179.51) at which to start warming up the “BUY” button is where the 50-dma, the 100-dma, and the 200-dma are starting to converge, which is between $178.38 and $179.68.
The second speculative possibility is that the rocket scientists at the Pentagon and at Langley have decided to hit Russia and China where it hurts the most — in their pocketbooks.
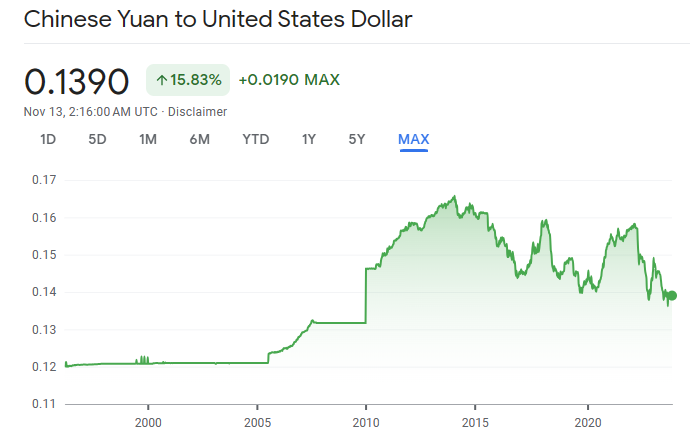
The easiest way to do that is to use the Crimex (futures exchange known as “the paper markets”) to massage the U.S. dollar-denominated gold price downward, which in turn should theoretically move the Russian ruble and Chinese yuan higher, thus making trade with those two dastardly enemies more expensive for everyone around the world settling major transaction in dollars. Such manipulation would discourage depositors from emptying bank accounts in favor of gold and silver held outside of the banking system, and as we all know, monetary and fiscal policy has only one intention — to protect and promote the banks.
This could be nothing more than rank speculation and tinfoil hat conspiracy theorizing, but it is the reason that the scar tissue on my back arms and face has forced me to trade gold and silver rather than marry them. It just seems to make sense to me that if an entity that NEVER gets a margin call is shorting the $%$% out of gold, I had better stand aside. That is what the COT was telling us back in late October, and those who listened and are now hiding in the weeds, as am I, have cash in hand awaiting a chance to pounce at the point where the bullion bank behemoths have fallen back to sleep after gorging on a $560 million meal.
The level on the GLD:NYSE (now $179.51) at which to start warming up the “BUY” button is where the 50-dma, the 100-dma, and the 200-dma are starting to converge, which is between $178.38 and $179.68. Mind you, when I went long the GLD:NYSE back on October 4 with a price under $170.00, RSI had plunged to a massively oversold low of 20.16.
It went out at 45.43 on the week, which is not nearly as compelling as it was in early October. I might have to wait to see that big gap at $174-176 created by the events in the Middle East filled in before I take a stab, and the way to do that is to wait for a two-day-close above the $178.35-$179.68 convergence zone. If it fails, then I know the gap is in the crosshairs.
In spot gold terms, the gap is in the $1,890-1,910 zone, and if that also fails, the early October lows are to be expected, and that would not be good.
Juniors
The junior miners are going to have a particularly challenging tax-loss season as investors harvest capital losses and apply them against past gains or bank them in anticipation of future gains, but what it spells is selling pressure. There are those who think that the poor performance of the TSX Venture Exchange will result in fewer gains against which to apply losses, but within the TSXV, there are pockets of strength (like lithium earlier in the year) where enormous gains were realized. If I am holding shares in a junior silver deal, I am likely to book a loss and switch it to a junior gold and around the same price so that I have a protected window of tax-free capital gains going into 2024.
The exploration stocks have always thrived or struggled “on the margin” of either bullish or bearish sentiment for the metals. When the senior and intermediate gold and silver miners and developers catch a cold, the explorers catch pneumonia. The developers, however, are where one finds the greatest bargains because as they get kneecapped along with other junior resource stocks, their value per ounce or value per pound of whatever proven resource they hold gets taken down despite the outlook for that resource.
I am sure that the junior gold developer space is littered with stories like Getchell which is typical of resource sector bear markets where “Undervalued gold deals” are like noses; everybody has one. (That phrase became popular in the smoky boardrooms of investment banking houses back in the 1980s and I must confess that in the interest of decency, I used the word “noses” in place of another anatomical appendage common to all humanity.)
There was a time when I was a younger, angry man that I refused to buy stocks unless they were in the resource category. They had to have a product that the world needed, and while they were volatile, it was infinitely more honorable to own a hard asset than some “story stock” where the CEO is a paid actor and reads off a script sheet every time a question is asked while signing stock buyback orders designed by activist fund managers just as a boatload of options vest.
Everyone over the age of 50 remembers the darling of the dotcom era, former GE Chairman and CEO Jack Welch, who ran the NYSE darling from 1981 to 2001, exiting with a record $487 million severance package. Back in the heyday of the technology boom pre-2001, Welch was a regular on CNBC, where hosts doted and fawned over him like a 60’s rock star.
He would lecture people on integrity and leadership, and American values and became the poster child for American exceptionalism. Then, when the dotcom bubble popped, and the rose-colored glasses were ground into tiny grains of sand, the world eventually discovered that, as Warren Buffett famously said about bear markets: “who was without swimming trunks when the tide went out.”
GE crashed and burned in the 2000s, and since the peak in 2001 at $198/share, GE has not exceeded the Welch-era highs in twenty years. Most importantly, the Welch legacy of exaltation has since been replaced with a reputation for underhanded financial reporting, risky deals, improper treatment of staff, and general corporate malfeasance of the highest order. Like Sam Bankman-Fried, the CNBC crowd reveres and worships these Oscar-winning corporate impersonators until they blow up, after which the spin involves simply never mentioning them again except in a cold, calculating, impersonal manner.
There are hundreds of Welches and SBF’s out there, all well-rehearsed in the art of subterfuge and shell-gaming. Like the magician that wants you to focus on the waving pink handkerchief, the MSM wants us all to focus on the narrative rather than the reality, which is precisely why I have learned that whether you own stocks or bonds or gold, there is no morality or immorality inherent in such ownership. This entire liberal-left notion of “ESG” being a prerequisite for responsible corporate behavior is a load of horsefeathers.
As I move into the twilight of senior citizenship, I have found immense joy in seeing through the thin veils of a bullish narrative or the odious linen of a bearish narrative, choosing instead to “rent” a position in either the SPY’s or the GLD’s or the QQQ’s without the tepid assumption of either guilt or innocence. You see, in the world of trading and investing and in the philosophy of free market capitalism, the only judge, jury, and executioner is one’s Statement of Profit and Loss, and if it says “profit,” you are headed to the clouds with a harp and white toga and if it says “loss,” you get out the asbestos footwear really quick.
Such are the rules of the back alley trader and pool-room preacher.
This letter makes no guarantee or warranty on the accuracy or completeness of the data provided. Nothing contained herein is intended or shall be deemed to be investment advice, implied or otherwise. This letter represents my views and replicates trades that I am making but nothing more than that. Always consult your registered advisor to assist you with your investments. I accept no liability for any loss arising from the use of the data contained on this letter. Options and junior mining stocks contain a high level of risk that may result in the loss of part or all invested capital and therefore are suitable for experienced and professional investors and traders only. One should be familiar with the risks involved in junior mining and options trading and we recommend consulting a financial adviser if you feel you do not understand the risks involved.