By InvestMacro
The latest update for the weekly Commitment of Traders (COT) report was released by the Commodity Futures Trading Commission (CFTC) on Friday for data ending on Tuesday May 5th.
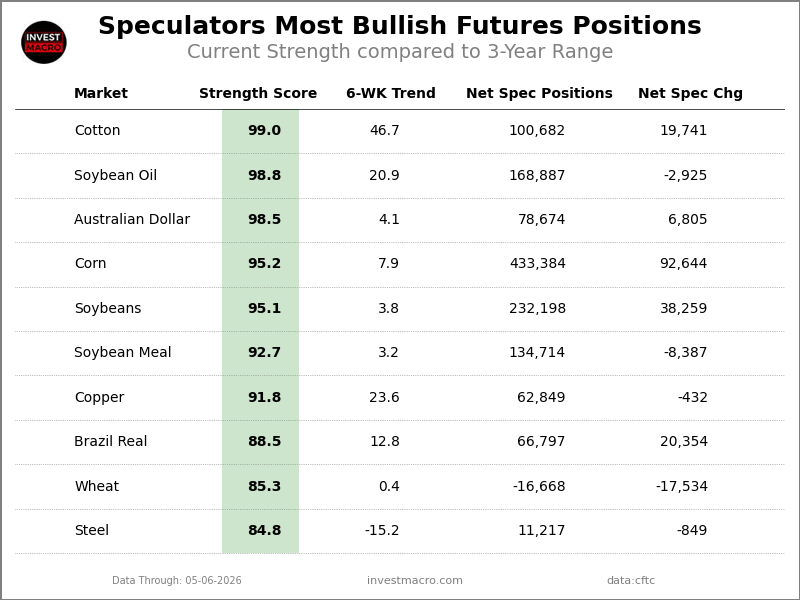
This weekly Extreme Positions report highlights the Most Bullish and Most Bearish Positions for the speculator category and is a current snapshot of how speculators were positioned as of Tuesday. Extreme positioning in these markets can foreshadow strong moves in the underlying market.
To signify an extreme position, we use the Strength Index (also known as the COT Index) of each instrument, a common method of measuring COT data. The Strength Index is simply a comparison of current trader positions against the range of positions over the previous 3 years. We use over 80 percent as extremely bullish and under 20 percent as extremely bearish (Compare Strength Index scores across all markets in the data table or cot leaders table).
The 6-WK Trend score is the change in the Strength Index over the past 6 weeks and signals how strong and which way the Strength Index is going.
Free Reports:
 Download Our Metatrader 4 Indicators – Put Our Free MetaTrader 4 Custom Indicators on your charts when you join our Weekly Newsletter
 Get our Weekly Commitment of Traders Reports - See where the biggest traders (Hedge Funds and Commercial Hedgers) are positioned in the futures markets on a weekly basis.
Here Are This Week’s Most Bullish Speculator Positions:
Cotton
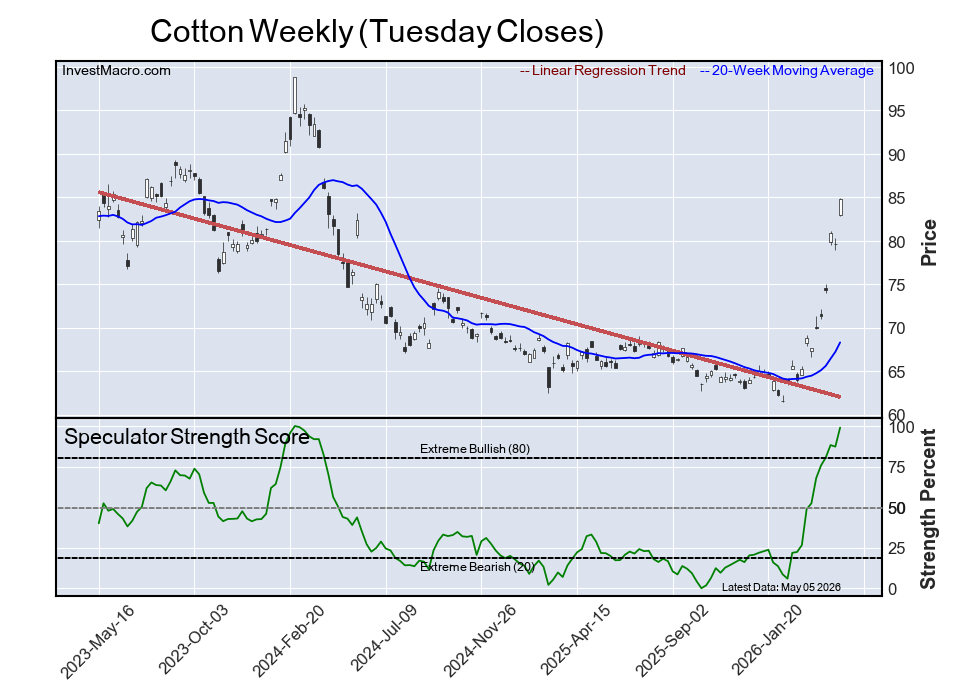
The Cotton speculator position comes in at the top of the extreme standings this week as the Cotton speculator level is at a 99 percent score of its 3-year range.
The six-week trend for the percent strength score was an increase by 47 percentage points this week. The speculator position registered 100,682 net contracts this week with a gain of 19,741 contracts in speculator bets.
Speculators or Non-Commercials Notes:
Speculators, classified as non-commercial traders by the CFTC, are made up of large commodity funds, hedge funds and other significant for-profit participants. The Specs are generally regarded as trend-followers in their behavior towards price action – net speculator bets and prices tend to go in the same directions. These traders often look to buy when prices are rising and sell when prices are falling. To illustrate this point, many times speculator contracts can be found at their most extremes (bullish or bearish) when prices are also close to their highest or lowest levels.
These extreme levels can be dangerous for the large speculators as the trade is most crowded, there is less trading ammunition still sitting on the sidelines to push the trend further and prices have moved a significant distance. When the trend becomes exhausted, some speculators take profits while others look to also exit positions when prices fail to continue in the same direction. This process usually plays out over many months to years and can ultimately create a reverse effect where prices start to fall and speculators start a process of selling when prices are falling.
Soybean Oil
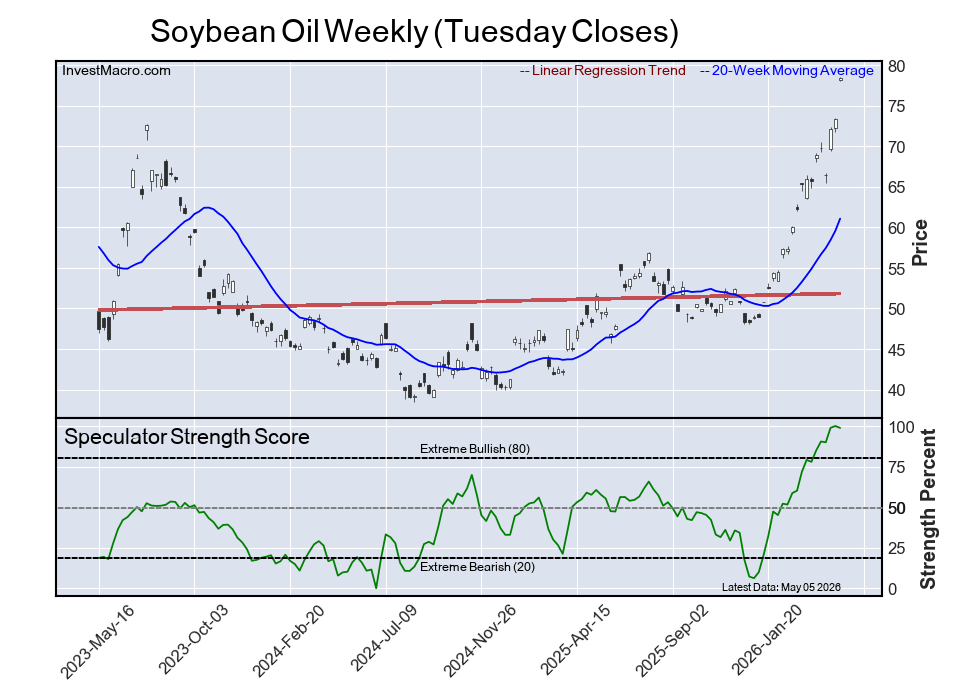
The Soybean Oil speculator position comes in second this week in the extreme standings. The Soybean Oil speculator level resides at an approximate 99 percent score of its 3-year range.
The six-week trend for the speculator strength score came in at a boost of 21 percentage points this week. The overall speculator position was 168,887 net contracts this week with a fall of -2,925 contracts in the weekly speculator bets.
Australian Dollar
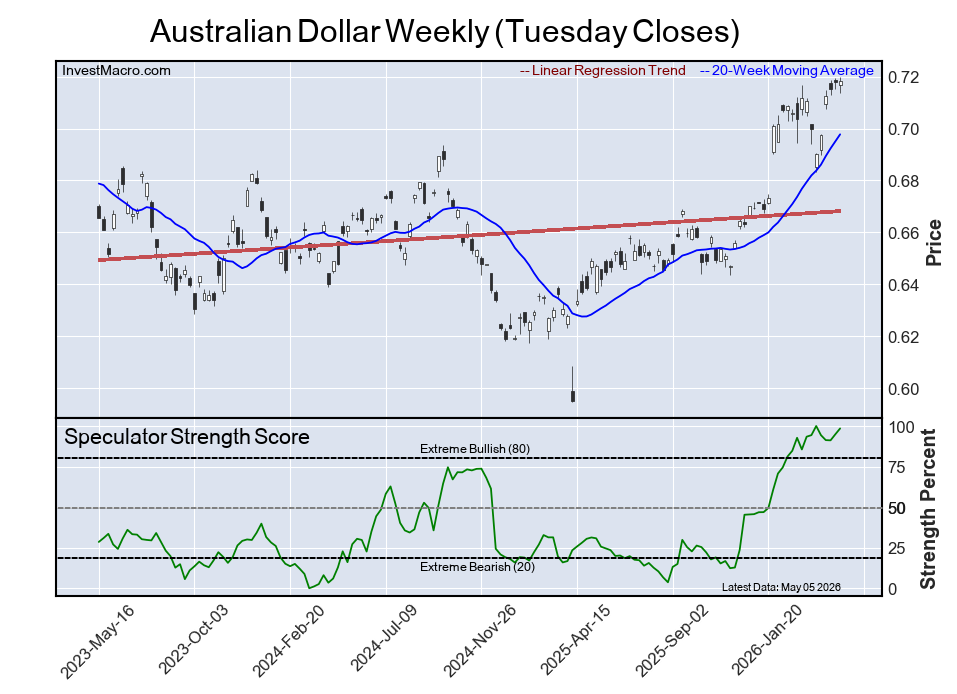
The Australian Dollar speculator position comes in as the third in the most bullish extreme standings this week with the AUD speculator level also currently at an approximate 99 percent score of its 3-year range.
The six-week trend for the percent strength score totaled an advance by 4 percentage points this week. The overall net speculator position was a total of 78,674 net contracts this week with a boost of 6,805 contract in the weekly speculator bets.
Corn
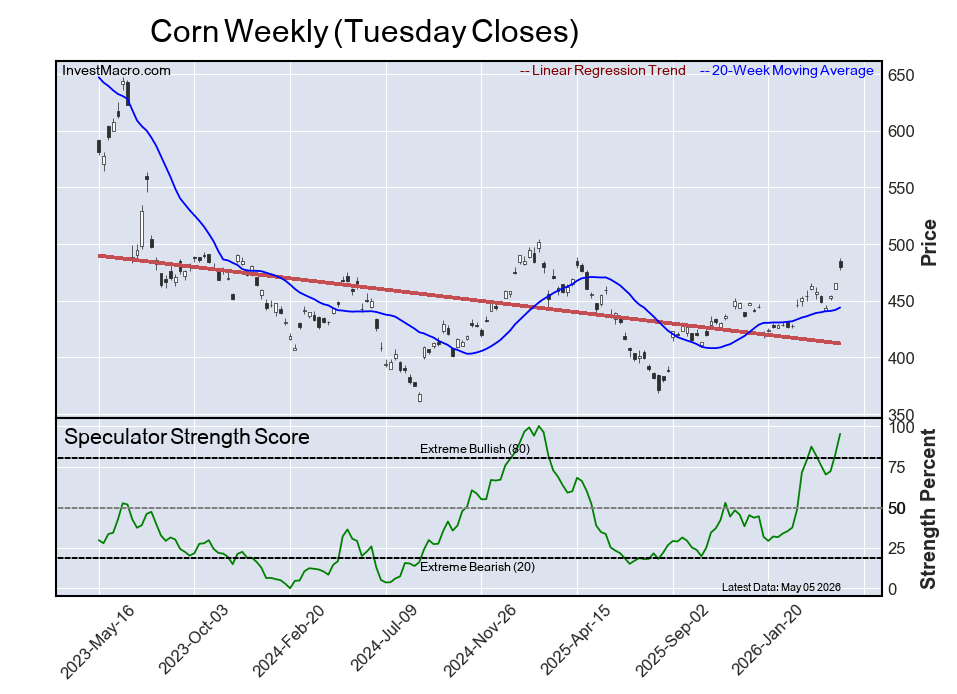
The Corn speculator position comes up number four in the extreme standings this week. The Corn speculator level is at a 95 percent score of its 3-year range.
The six-week trend for the speculator strength score totaled a rise higher by 8 percentage points this week and the overall speculator position was 433,384 net contracts this week with a strong gain of 92,644 contracts in the speculator bets.
Soybeans
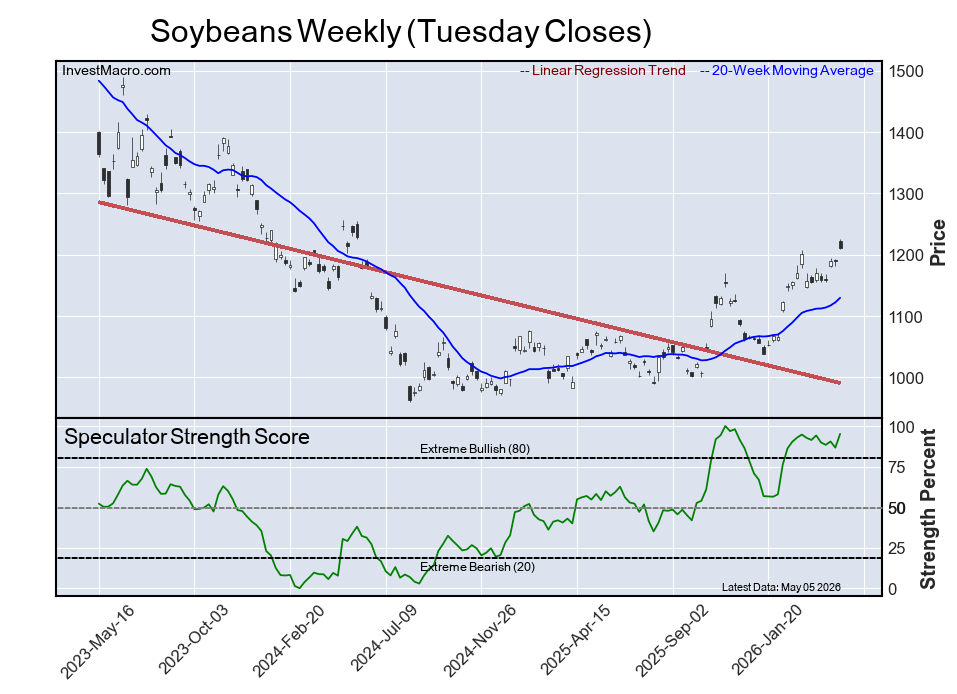
The Soybeans speculator position rounds out the top five in this week’s bullish extreme standings as the Soybeans speculator level sits at a 95 percent score of its 3-year range. The six-week trend for the speculator strength score was a boost of 4 percentage points this week.
The speculator position was 232,198 net contracts this week with a rise of 38,259 contracts in the weekly speculator bets.
The Most Bearish Speculator Positions of the Week:
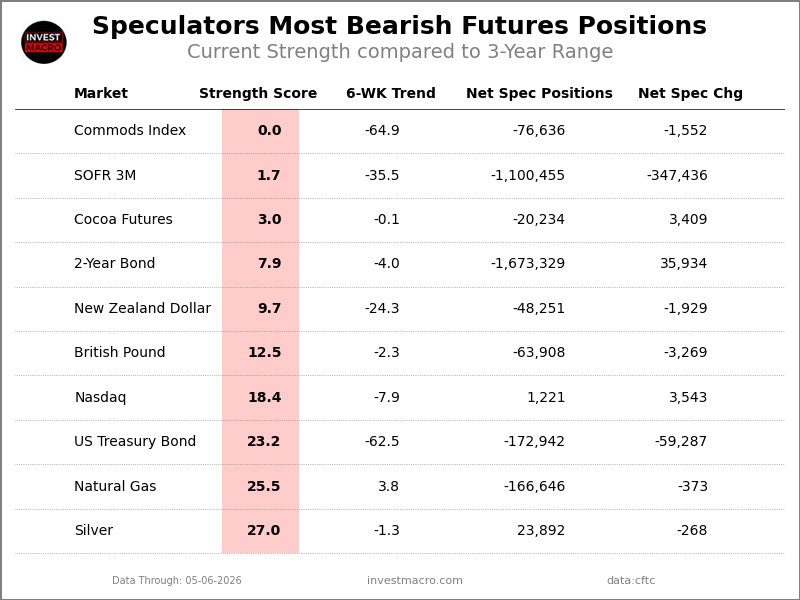
3-Month Secured Overnight Financing Rate
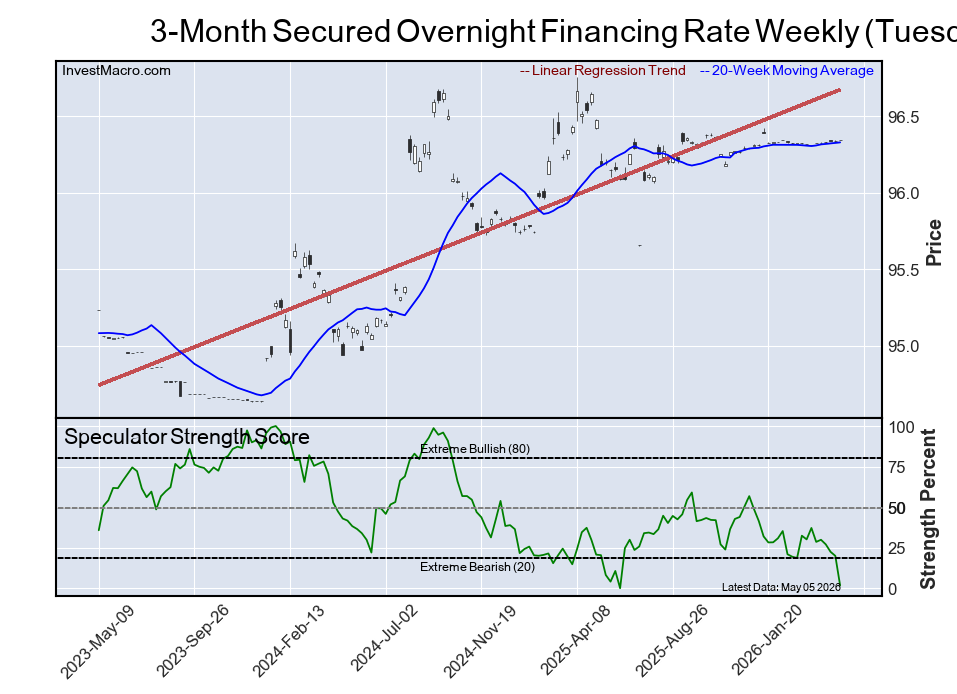
The 3-Month Secured Overnight Financing Rate speculator position comes in as the most bearish extreme standing this week. The SOFR 3-Months speculator level is at just a 2 percent score of its 3-year range.
The six-week trend for the speculator strength score was a fall by -35 percentage points this week while the overall speculator position was -1,100,455 net contracts this week with a fall of -347,436 contracts in the speculator bets.
Cocoa Futures
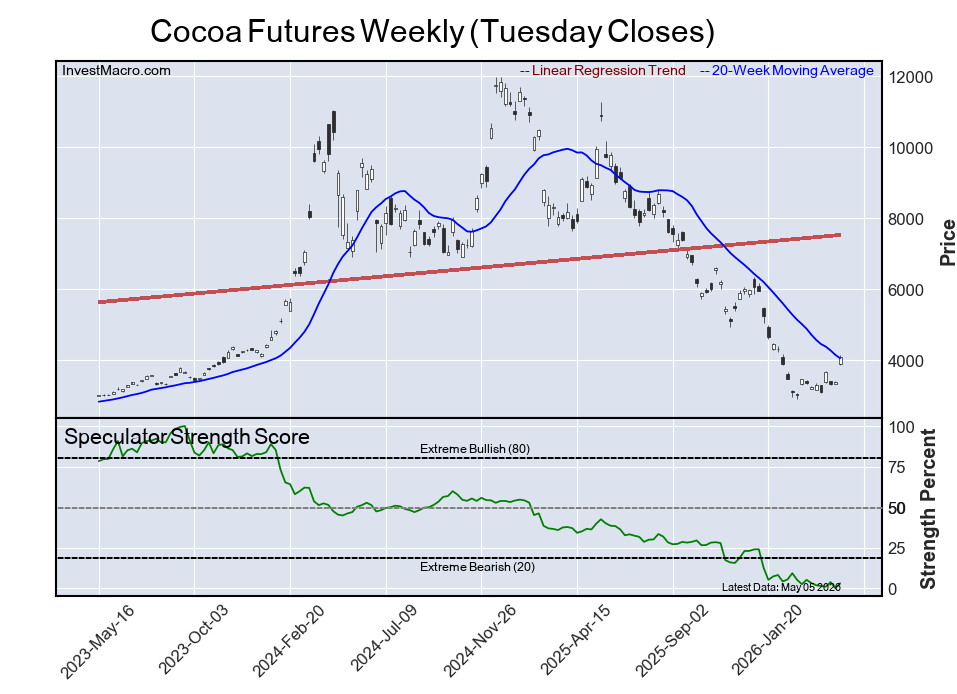
The Cocoa Futures speculator position comes in next for the most bearish extreme standing on the week as the Cocoa speculator level sits at a 3 percent score of its 3-year range.
The six-week trend for the speculator strength score saw no change this week while the speculator position was -20,234 net contracts this week with a boost of 3,409 contracts in the weekly speculator bets.
2-Year Bond
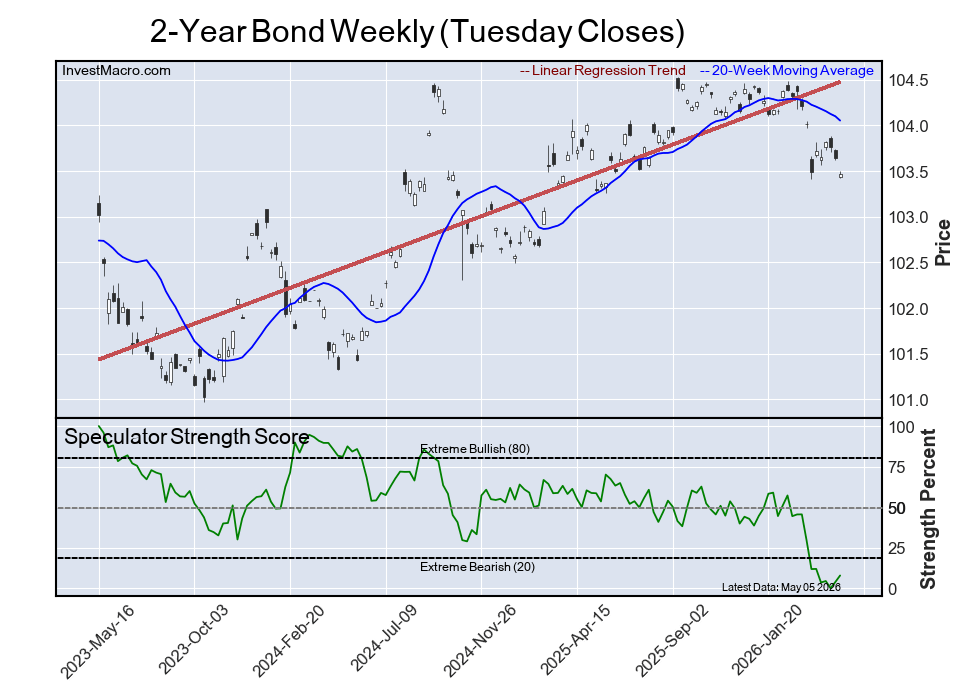
The 2-Year Bond speculator position comes in as third most bearish extreme standing of the week. The 2-Year speculator level resides at a 8 percent score of its 3-year range.
The six-week trend for the speculator strength score was a decline by -4 percentage points this week and the overall speculator position was -1,673,329 net contracts this week with an addition of 35,934 contracts in the speculator bets.
New Zealand Dollar
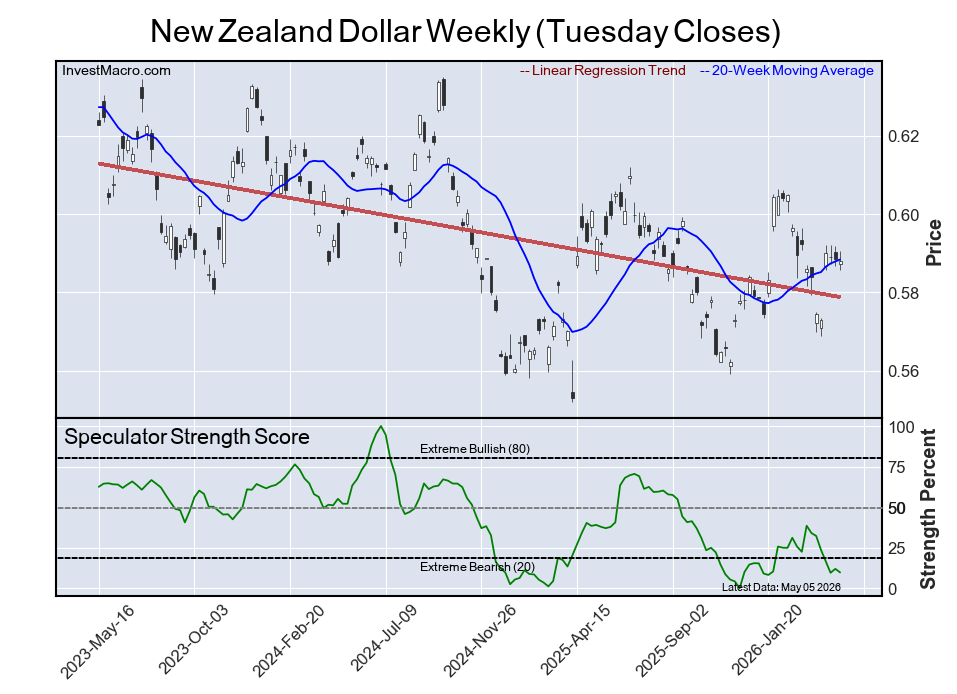
The New Zealand Dollar speculator position comes in as this week’s fourth most bearish extreme standing with the NZD speculator level sitting at a 10 percent score of its 3-year range.
The six-week trend for the speculator strength score was a fall by -24 percentage points this week. The speculator position was -48,251 net contracts this week with a retreat of -1,929 contracts in the weekly speculator bets.
British Pound
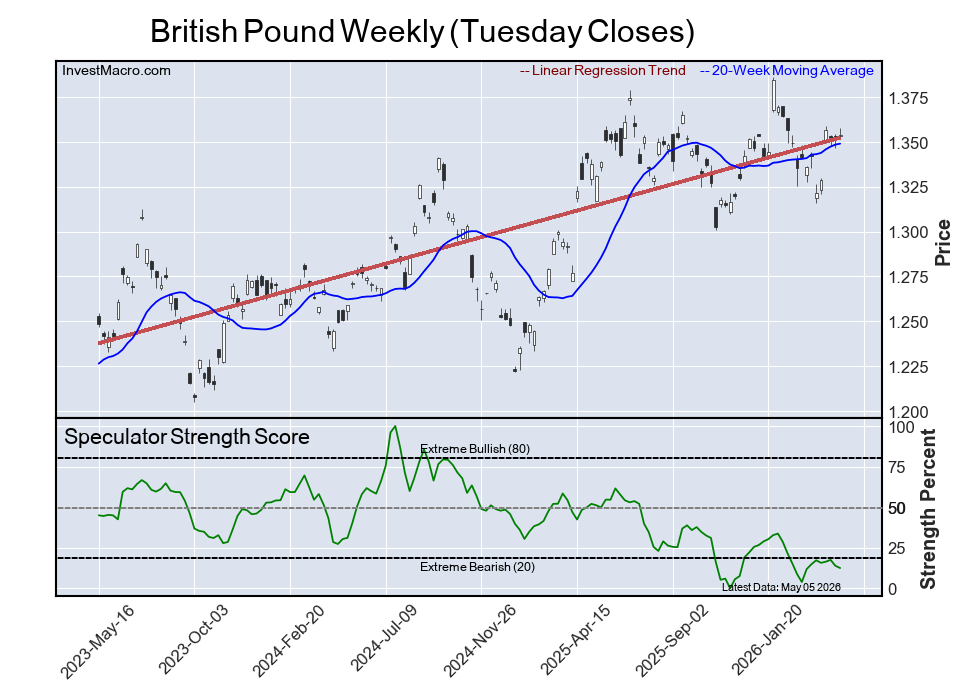
Next, the British Pound speculator position comes in as the fifth most bearish extreme standing for this week with the GBP speculator level at a 12 percent score of its 3-year range.
The six-week trend for the speculator strength score was a decrease by -2 percentage points this week and the speculator position was -63,908 net contracts this week with a fall of -3,269 contracts in the weekly speculator bets.
Article By InvestMacro – Receive our weekly COT Newsletter
*COT Report: The COT data, released weekly to the public each Friday, is updated through the most recent Tuesday (data is 3 days old) and shows a quick view of how large speculators or non-commercials (for-profit traders) were positioned in the futures markets.
The CFTC categorizes trader positions according to commercial hedgers (traders who use futures contracts for hedging as part of the business), non-commercials (large traders who speculate to realize trading profits) and nonreportable traders (usually small traders/speculators) as well as their open interest (contracts open in the market at time of reporting). See CFTC criteria here.

- The US and European stock indices are rising again amid renewed investor interest in the AI industry. Jul 10, 2026
- USD/JPY Falls as Yen Recovers Weekly Losses Jul 10, 2026
- Crude oil prices surged sharply by 7% in reaction to the rapid escalation of the conflict in the Middle East Jul 9, 2026
- Middle East Tensions Weigh on Gold Jul 9, 2026
- Pound Awaits Tighter Policy from Bank of England Jul 8, 2026
- The United States carried out airstrikes on Iran after Iran’s attacked tankers in the Strait of Hormuz. The RBNZ raised the interest rate to 2.5% Jul 8, 2026
- RoboForex Brings Full-Scale Trading to Telegram Jul 7, 2026
- Your Bourse Integrates TradingView Charts and Trading Platform Library with Trade Server Jul 7, 2026
- Yen Still Under Pressure: Markets Await Action from Authorities Jul 7, 2026
- Germany’s DAX Index has updated its all‑time high. OPEC+ countries have agreed to increase production Jul 7, 2026