
By InvestMacro
Here are the latest charts and statistics for the Commitment of Traders (COT) data published by the Commodities Futures Trading Commission (CFTC).
The latest COT data is updated through Tuesday April 21st and shows a quick view of how large traders (for-profit speculators and commercial entities) were positioned in the futures markets.
Weekly Speculator Bets led by Natural Gas
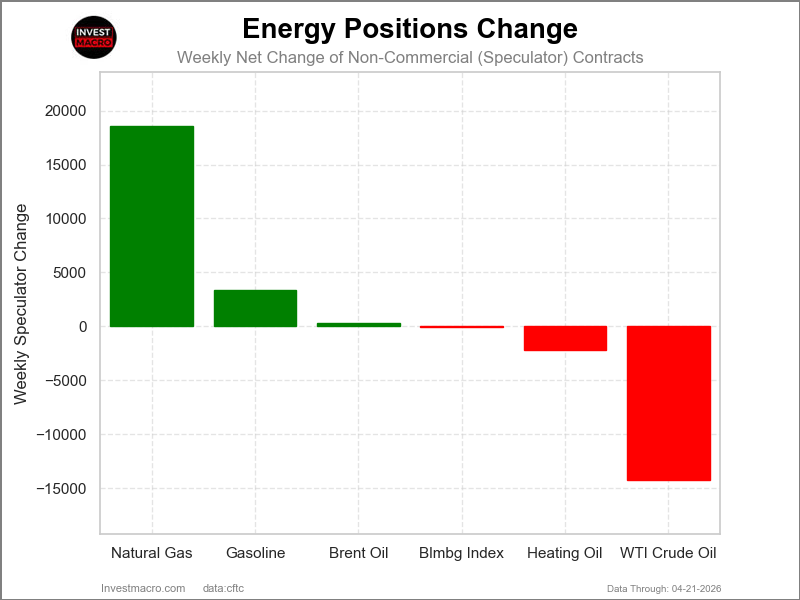
The COT energy market speculator bets were mixed this week as three out of the six energy markets we cover had higher positioning while the other three markets had lower speculator contracts.
Leading the gains for the energy markets was Natural Gas (18,573 contracts) with Gasoline (3,350 contracts) and Brent Oil (322 contracts) also having positive weeks.
The markets with declines in speculator bets for the week were WTI Crude (-14,239 contracts), Heating Oil (-2,152 contracts) and Bloomberg Index (-35 contracts) also seeing lower bets on the week.
Free Reports:
 Sign Up for Our Stock Market Newsletter – Get updated on News, Charts & Rankings of Public Companies when you join our Stocks Newsletter
 Get our Weekly Commitment of Traders Reports - See where the biggest traders (Hedge Funds and Commercial Hedgers) are positioned in the futures markets on a weekly basis.
Gasoline and Brent Oil lead Energy market price performance.
Energy Markets were mostly higher across the board this week with Gasoline being the leader in price performance with a 13.42% gain on the week. Brent Oil came in next with an 11.40% upswing, while Heating Oil saw a strong weekly gain of 8.87%. WTI Crude Oil was also higher and rose by 8.79% for the week while the Bloomberg Commodity Index advanced by 4.03% over the past 5 days.
On the downside, Natural Gas was the only market to see a negative price performance on the week with a modest -0.96% decline.
Energy Data:
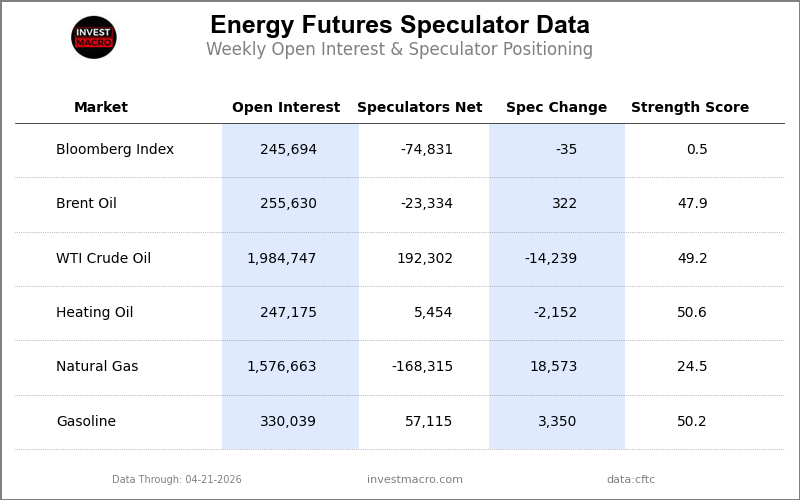
Legend: Weekly Speculators Change | Speculators Current Net Position | Speculators Strength Score compared to last 3-Years (0-100 range)
Strength Scores led by Heating Oil & Gasoline
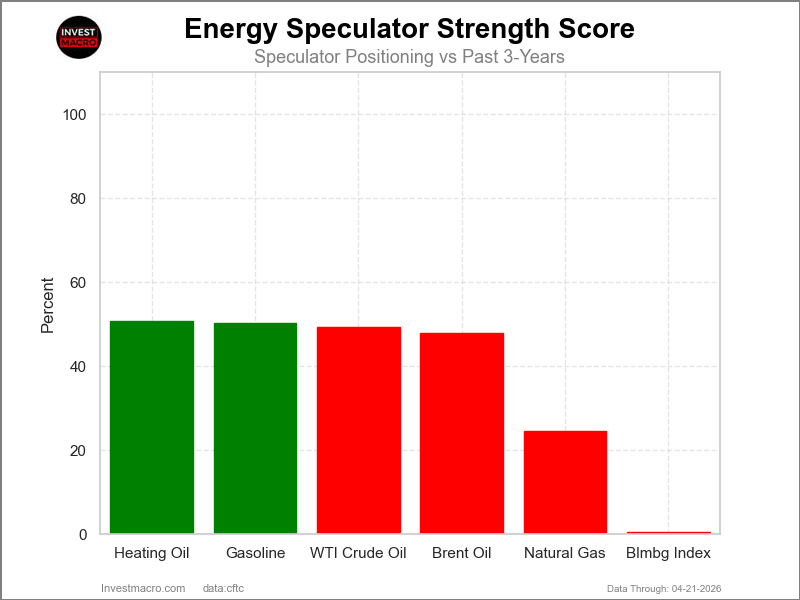
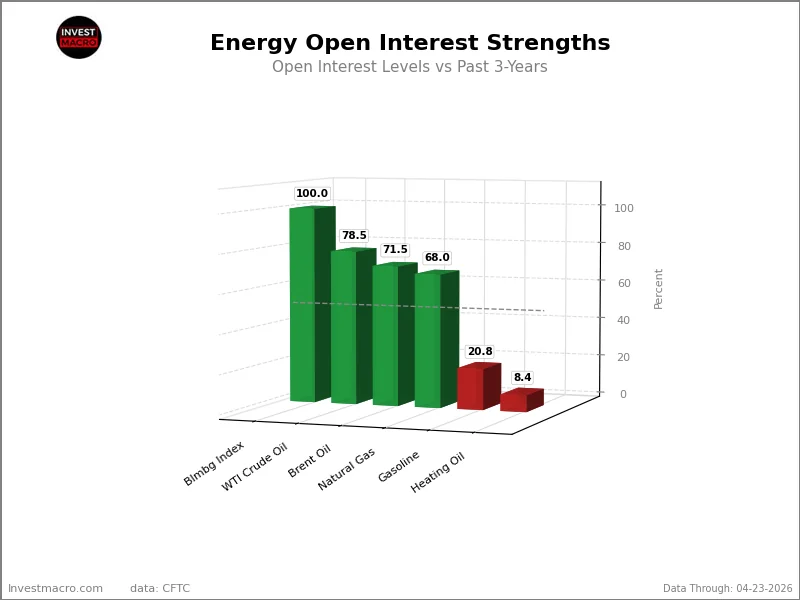
COT Strength Scores (a normalized measure of Speculator positions over a 3-Year range, from 0 to 100 where above 80 is Extreme-Bullish and below 20 is Extreme-Bearish) showed that Heating Oil (50.6 percent) and Gasoline (50.2 percent) lead the energy markets this week. WTI Crude Oil (49.2 percent) and Brent Crude Oil (47.9 percent) come in as the next highest in the weekly strength scores.
On the downside, the Bloomberg Index (0.5 percent) comes in at the lowest strength level currently and is in Extreme-Bearish territory (below 20 percent). The next lowest strength score was Natural Gas (24.5 percent).
Strength Statistics:
WTI Crude Oil (49.2 percent) vs WTI Crude Oil previous week (53.7 percent)
Brent Crude Oil (47.9 percent) vs Brent Crude Oil previous week (47.4 percent)
Natural Gas (24.5 percent) vs Natural Gas previous week (12.5 percent)
Gasoline (50.2 percent) vs Gasoline previous week (46.5 percent)
Heating Oil (50.6 percent) vs Heating Oil previous week (53.5 percent)
Bloomberg Commodity Index (0.5 percent) vs Bloomberg Commodity Index previous week (0.6 percent)
Natural Gas top the 6-Week Strength Trends
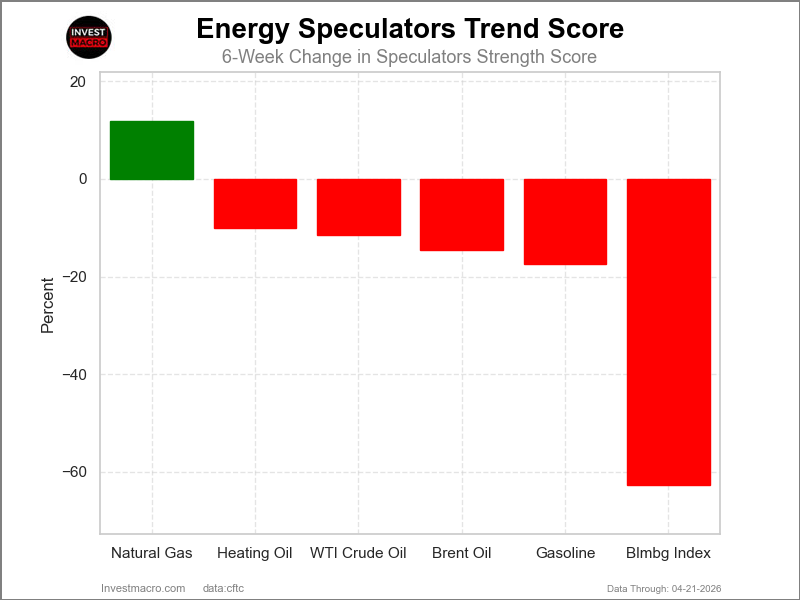
COT Strength Score Trends (or move index, calculates the 6-week changes in strength scores) showed that Natural Gas (11.9 percent) leads the past six weeks trends for the energy markets.
Bloomberg Index (-62.7 percent) leads the downside trend scores currently with Gasoline (-17.5 percent) as the next market with lower trend scores.
Move Statistics:
WTI Crude Oil (-11.5 percent) vs WTI Crude Oil previous week (11.1 percent)
Brent Crude Oil (-14.5 percent) vs Brent Crude Oil previous week (5.4 percent)
Natural Gas (11.9 percent) vs Natural Gas previous week (12.5 percent)
Gasoline (-17.5 percent) vs Gasoline previous week (-42.0 percent)
Heating Oil (-10.0 percent) vs Heating Oil previous week (-13.2 percent)
Bloomberg Commodity Index (-62.7 percent) vs Bloomberg Commodity Index previous week (-61.6 percent)
Individual COT Market Charts:
WTI Crude Oil Futures Futures:
 Positioning Notes:
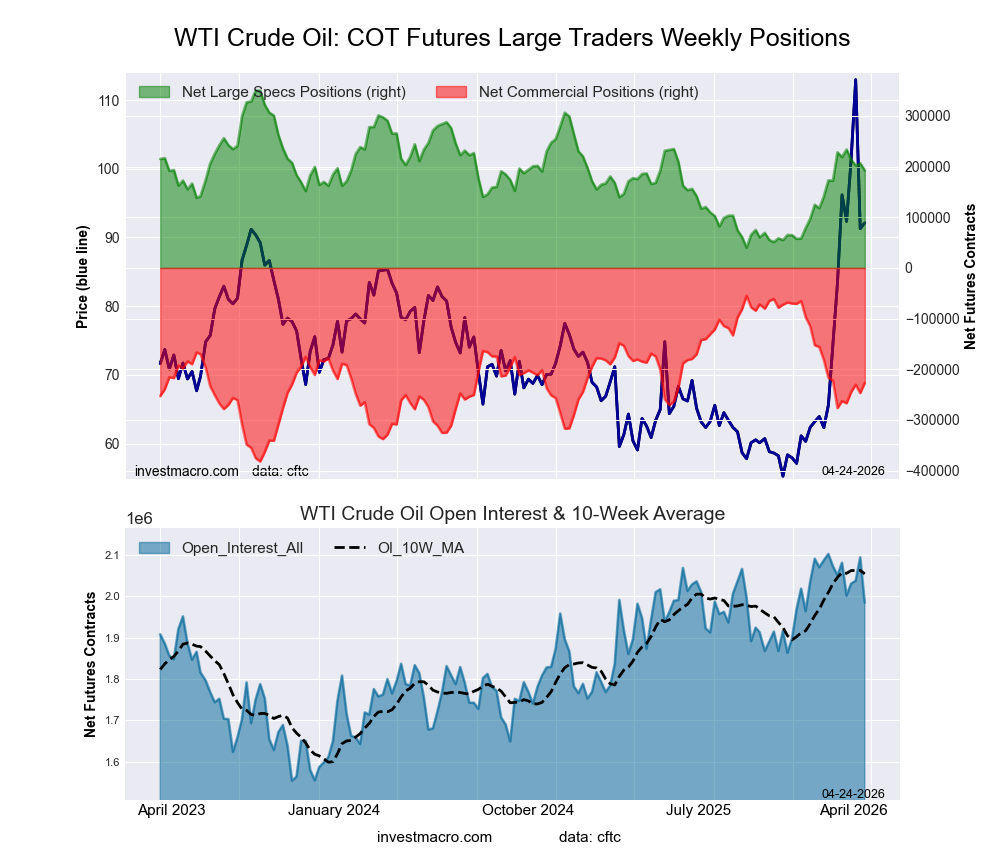
- WTI Crude Oil Futures large speculator standing this week totaled a net position of 192,302 contracts in the data reported through Tuesday.
- Weekly Speculator position decrease of -14,239 contracts from the previous week which had a total of 206,541 net contracts.
- This week’s current strength score (range over the past 3 years, measured from 0 to 100) shows the speculators are currently Bearish with a score of 49.2 percent.
- The Commercials are Bearish with a score of 47.5 percent.
- The Small Traders (not shown in chart) are Bullish with a score of 68.9 percent.
Price Trend-Following Model: Uptrend
Our weekly trend-following model classifies the current market price position as: Uptrend.
| WTI Crude Oil Futures Statistics | SPECULATORS | COMMERCIALS | SMALL TRADERS |
| – Percent of Open Interest Longs: | 19.1 | 44.0 | 3.8 |
| – Percent of Open Interest Shorts: | 9.5 | 55.4 | 2.1 |
| – Net Position: | 192,302 | -226,711 | 34,409 |
| – Gross Longs: | 380,020 | 873,316 | 76,070 |
| – Gross Shorts: | 187,718 | 1,100,027 | 41,661 |
| – Long to Short Ratio: | 2.0 to 1 | 0.8 to 1 | 1.8 to 1 |
| NET POSITION TREND: | |||
| – Strength Index Score (3 Year Range Pct): | 49.2 | 47.5 | 68.9 |
| – Strength Index Reading (3 Year Range): | Bearish | Bearish | Bullish |
| NET POSITION MOVEMENT INDEX: | |||
| – 6-Week Change in Strength Index: | -11.5 | 15.2 | -27.7 |
Brent Crude Oil Futures Futures:
 Positioning Notes:
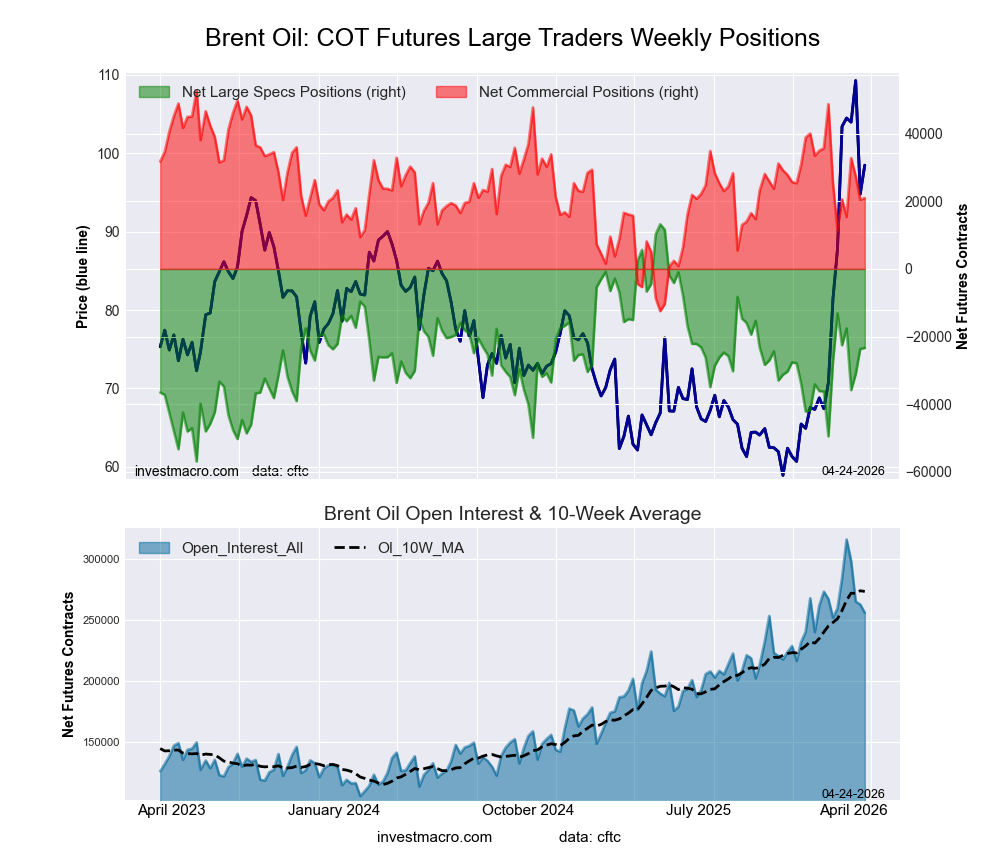
- Brent Crude Oil Futures large speculator standing this week totaled a net position of -23,334 contracts in the data reported through Tuesday.
- Weekly Speculator position boost of 322 contracts from the previous week which had a total of -23,656 net contracts.
- This week’s current strength score (range over the past 3 years, measured from 0 to 100) shows the speculators are currently Bearish with a score of 47.9 percent.
- The Commercials are Bullish with a score of 51.2 percent.
- The Small Traders (not shown in chart) are Bullish with a score of 69.2 percent.
Price Trend-Following Model: Uptrend
Our weekly trend-following model classifies the current market price position as: Uptrend.
| Brent Crude Oil Futures Statistics | SPECULATORS | COMMERCIALS | SMALL TRADERS |
| – Percent of Open Interest Longs: | 24.7 | 36.5 | 4.2 |
| – Percent of Open Interest Shorts: | 33.8 | 28.3 | 3.3 |
| – Net Position: | -23,334 | 20,950 | 2,384 |
| – Gross Longs: | 63,018 | 93,286 | 10,766 |
| – Gross Shorts: | 86,352 | 72,336 | 8,382 |
| – Long to Short Ratio: | 0.7 to 1 | 1.3 to 1 | 1.3 to 1 |
| NET POSITION TREND: | |||
| – Strength Index Score (3 Year Range Pct): | 47.9 | 51.2 | 69.2 |
| – Strength Index Reading (3 Year Range): | Bearish | Bullish | Bullish |
| NET POSITION MOVEMENT INDEX: | |||
| – 6-Week Change in Strength Index: | -14.5 | 14.5 | 9.2 |
Natural Gas Futures Futures:
 Positioning Notes:
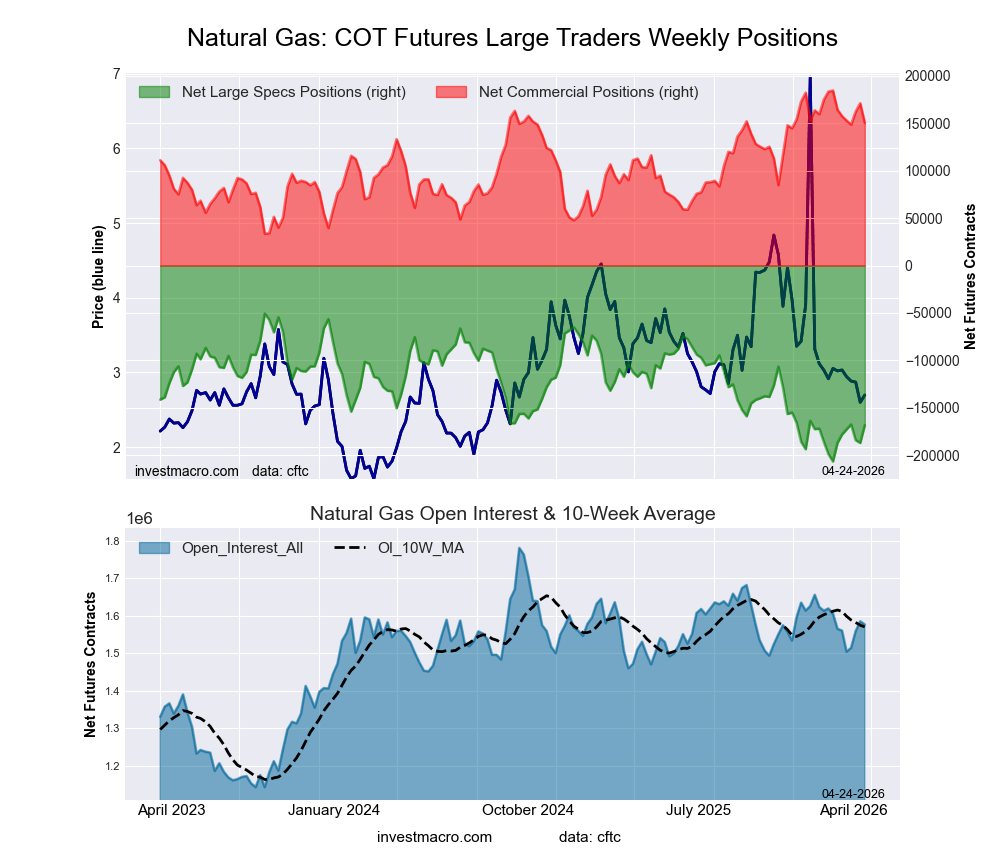
- Natural Gas Futures large speculator standing this week totaled a net position of -168,315 contracts in the data reported through Tuesday.
- Weekly Speculator position increase of 18,573 contracts from the previous week which had a total of -186,888 net contracts.
- This week’s current strength score (range over the past 3 years, measured from 0 to 100) shows the speculators are currently Bearish with a score of 24.5 percent.
- The Commercials are Bullish with a score of 77.4 percent.
- The Small Traders (not shown in chart) are Bearish with a score of 48.6 percent.
Price Trend-Following Model: Downtrend
Our weekly trend-following model classifies the current market price position as: Downtrend.
| Natural Gas Futures Statistics | SPECULATORS | COMMERCIALS | SMALL TRADERS |
| – Percent of Open Interest Longs: | 15.4 | 35.3 | 3.7 |
| – Percent of Open Interest Shorts: | 26.0 | 25.8 | 2.5 |
| – Net Position: | -168,315 | 150,316 | 17,999 |
| – Gross Longs: | 242,027 | 556,426 | 58,043 |
| – Gross Shorts: | 410,342 | 406,110 | 40,044 |
| – Long to Short Ratio: | 0.6 to 1 | 1.4 to 1 | 1.4 to 1 |
| NET POSITION TREND: | |||
| – Strength Index Score (3 Year Range Pct): | 24.5 | 77.4 | 48.6 |
| – Strength Index Reading (3 Year Range): | Bearish | Bullish | Bearish |
| NET POSITION MOVEMENT INDEX: | |||
| – 6-Week Change in Strength Index: | 11.9 | -9.2 | -11.8 |
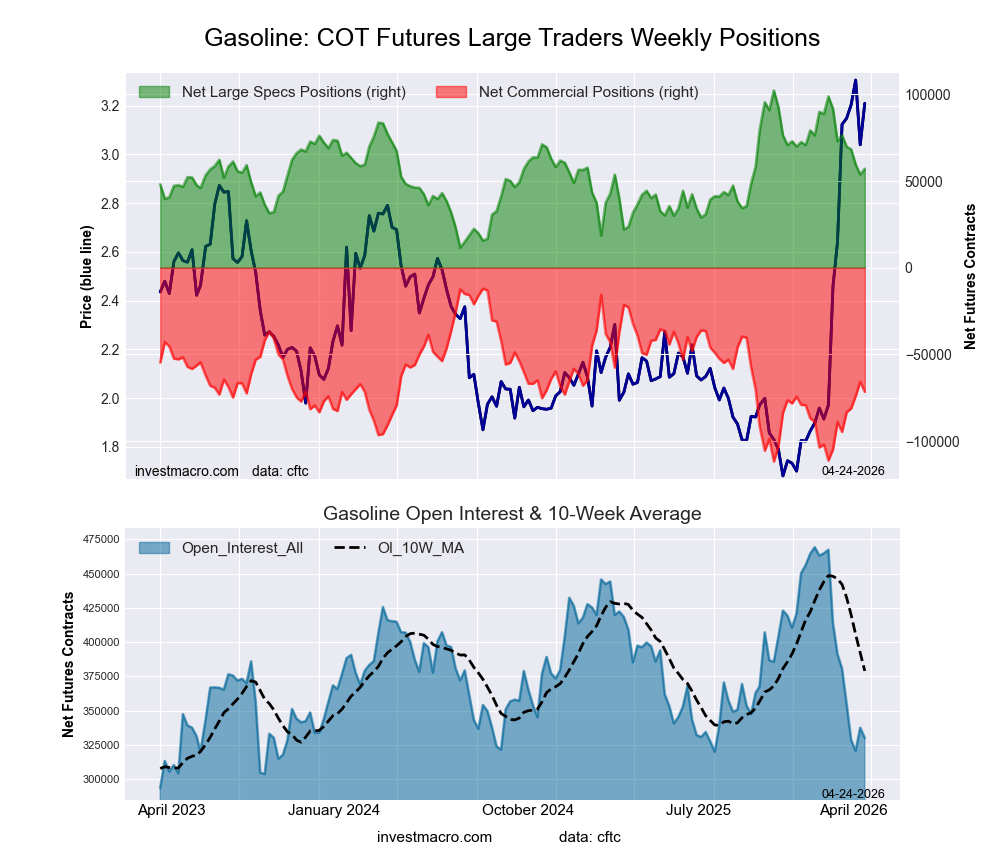
Gasoline Blendstock Futures Futures:
 Positioning Notes:
- Gasoline Blendstock Futures large speculator standing this week totaled a net position of 57,115 contracts in the data reported through Tuesday.
- Weekly Speculator position increase of 3,350 contracts from the previous week which had a total of 53,765 net contracts.
- This week’s current strength score (range over the past 3 years, measured from 0 to 100) shows the speculators are currently Bullish with a score of 50.2 percent.
- The Commercials are Bearish with a score of 40.3 percent.
- The Small Traders (not shown in chart) are Bullish-Extreme with a score of 83.4 percent.
Price Trend-Following Model: Strong Uptrend
Our weekly trend-following model classifies the current market price position as: Strong Uptrend.
| Nasdaq Mini Futures Statistics | SPECULATORS | COMMERCIALS | SMALL TRADERS |
| – Percent of Open Interest Longs: | 24.1 | 50.6 | 8.4 |
| – Percent of Open Interest Shorts: | 6.8 | 72.3 | 4.0 |
| – Net Position: | 57,115 | -71,572 | 14,457 |
| – Gross Longs: | 79,546 | 167,081 | 27,799 |
| – Gross Shorts: | 22,431 | 238,653 | 13,342 |
| – Long to Short Ratio: | 3.5 to 1 | 0.7 to 1 | 2.1 to 1 |
| NET POSITION TREND: | |||
| – Strength Index Score (3 Year Range Pct): | 50.2 | 40.3 | 83.4 |
| – Strength Index Reading (3 Year Range): | Bullish | Bearish | Bullish-Extreme |
| NET POSITION MOVEMENT INDEX: | |||
| – 6-Week Change in Strength Index: | -17.5 | 17.5 | -7.3 |
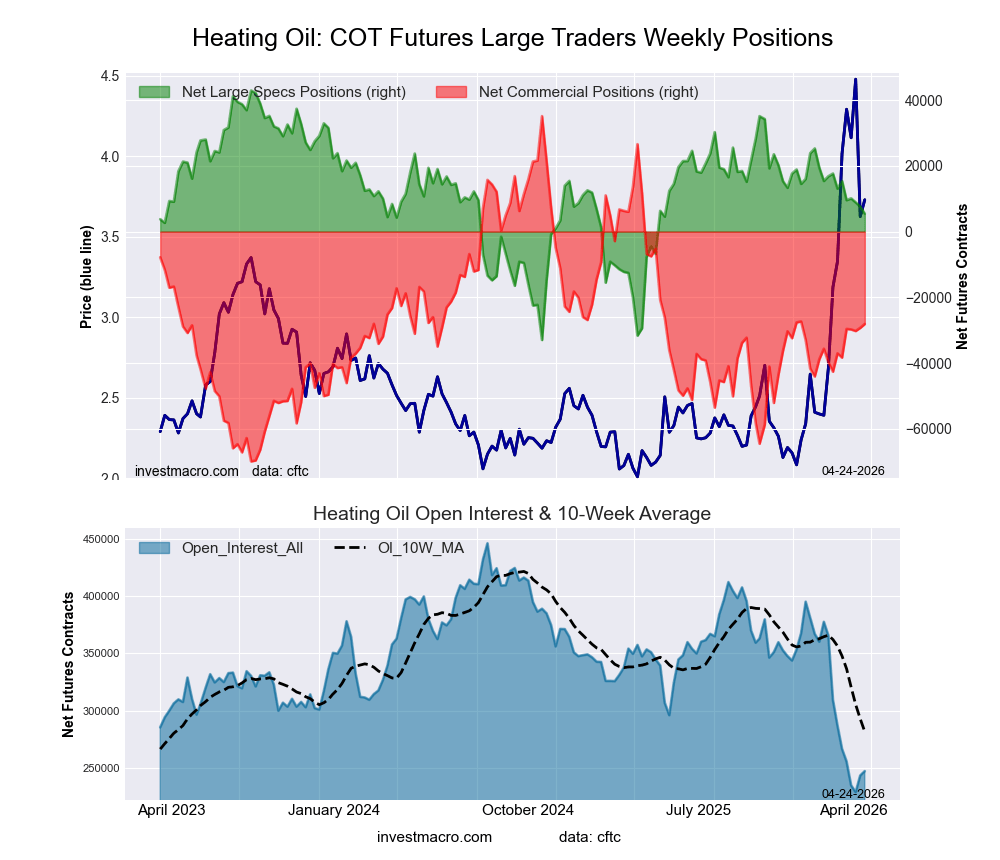
#2 Heating Oil NY-Harbor Futures Futures:
 Positioning Notes:
- #2 Heating Oil NY-Harbor Futures large speculator standing this week totaled a net position of 5,454 contracts in the data reported through Tuesday.
- Weekly Speculator position lowering of -2,152 contracts from the previous week which had a total of 7,606 net contracts.
- This week’s current strength score (range over the past 3 years, measured from 0 to 100) shows the speculators are currently Bullish with a score of 50.6 percent.
- The Commercials are Bearish with a score of 39.8 percent.
- The Small Traders (not shown in chart) are Bullish-Extreme with a score of 80.0 percent.
Price Trend-Following Model: Uptrend
Our weekly trend-following model classifies the current market price position as: Uptrend.
| Heating Oil Futures Statistics | SPECULATORS | COMMERCIALS | SMALL TRADERS |
| – Percent of Open Interest Longs: | 15.0 | 49.0 | 18.7 |
| – Percent of Open Interest Shorts: | 12.8 | 60.4 | 9.6 |
| – Net Position: | 5,454 | -28,100 | 22,646 |
| – Gross Longs: | 37,085 | 121,175 | 46,321 |
| – Gross Shorts: | 31,631 | 149,275 | 23,675 |
| – Long to Short Ratio: | 1.2 to 1 | 0.8 to 1 | 2.0 to 1 |
| NET POSITION TREND: | |||
| – Strength Index Score (3 Year Range Pct): | 50.6 | 39.8 | 80.0 |
| – Strength Index Reading (3 Year Range): | Bullish | Bearish | Bullish-Extreme |
| NET POSITION MOVEMENT INDEX: | |||
| – 6-Week Change in Strength Index: | -10.0 | 8.5 | -3.6 |
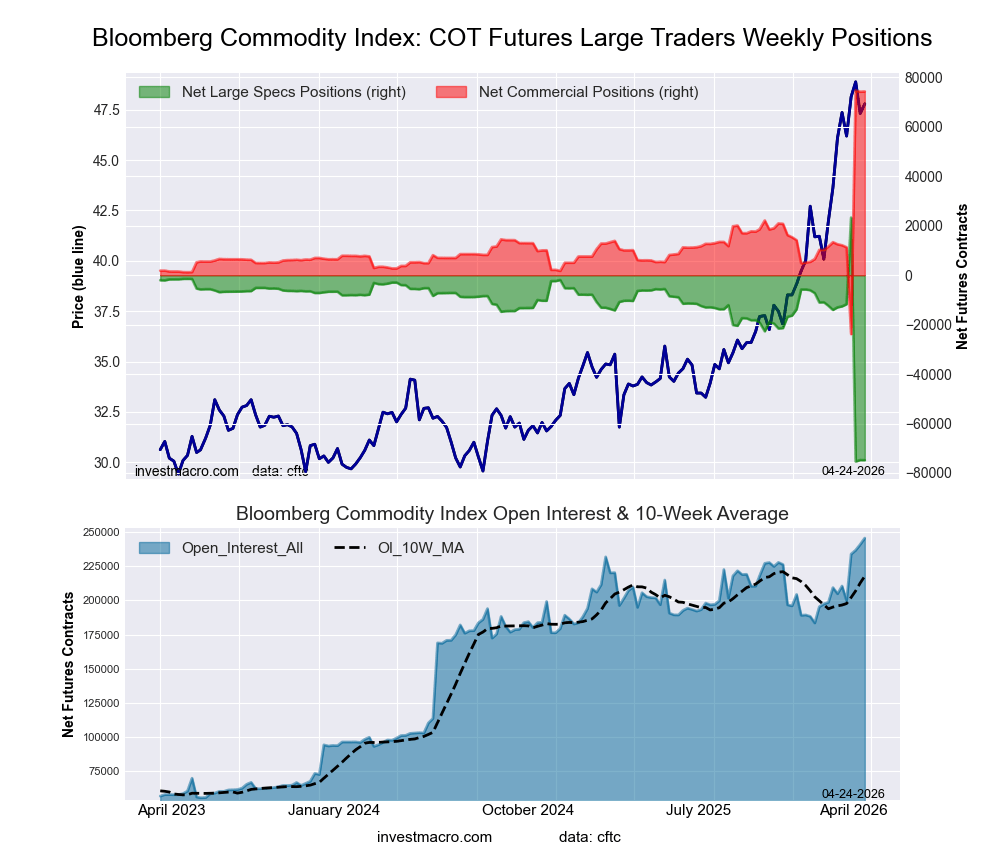
Bloomberg Commodity Index Futures Futures:
 Positioning Notes:
- Bloomberg Commodity Index Futures large speculator standing this week totaled a net position of -74,831 contracts in the data reported through Tuesday.
- Weekly Speculator position reduction of -35 contracts from the previous week which had a total of -74,796 net contracts.
- This week’s current strength score (range over the past 3 years, measured from 0 to 100) shows the speculators are currently Bearish-Extreme with a score of 0.5 percent.
- The Commercials are Bullish-Extreme with a score of 99.6 percent.
- The Small Traders (not shown in chart) are Bullish with a score of 63.7 percent.
Price Trend-Following Model: Uptrend
Our weekly trend-following model classifies the current market price position as: Uptrend.
| Bloomberg Index Futures Statistics | SPECULATORS | COMMERCIALS | SMALL TRADERS |
| – Percent of Open Interest Longs: | 44.5 | 54.7 | 0.2 |
| – Percent of Open Interest Shorts: | 75.0 | 24.4 | 0.0 |
| – Net Position: | -74,831 | 74,349 | 482 |
| – Gross Longs: | 109,438 | 134,349 | 521 |
| – Gross Shorts: | 184,269 | 60,000 | 39 |
| – Long to Short Ratio: | 0.6 to 1 | 2.2 to 1 | 13.4 to 1 |
| NET POSITION TREND: | |||
| – Strength Index Score (3 Year Range Pct): | 0.5 | 99.6 | 63.7 |
| – Strength Index Reading (3 Year Range): | Bearish-Extreme | Bullish-Extreme | Bullish |
| NET POSITION MOVEMENT INDEX: | |||
| – 6-Week Change in Strength Index: | -62.7 | 62.7 | -1.0 |
Article By InvestMacro – Receive our weekly COT Newsletter
*COT Report: The COT data, released weekly to the public each Friday, is updated through the most recent Tuesday (data is 3 days old) and shows a quick view of how large speculators or non-commercials (for-profit traders) were positioned in the futures markets.
The CFTC categorizes trader positions according to commercial hedgers (traders who use futures contracts for hedging as part of the business), non-commercials (large traders who speculate to realize trading profits) and nonreportable traders (usually small traders/speculators) as well as their open interest (contracts open in the market at time of reporting). See CFTC criteria here.

- EUR/USD: The Advantage Remains with the Dollar Jun 29, 2026
- Escalation of the US–Iran conflict is once again supporting the rise in oil prices Jun 29, 2026
- Oil prices fall back to pre‑war levels. Silver drops to a 7‑month low Jun 25, 2026
- Gold Falls to an Eight-Month Low: This May Not Be the Bottom Jun 25, 2026
- Stock indices came under heavy selling pressure amid growing skepticism about AI investments Jun 24, 2026
- The Pound Is Pressured Not by Politics, but by a Strong US Dollar Jun 24, 2026
- Global crude oil prices continued to decline. The AUD/USD exchange rate hit an 11‑week low Jun 23, 2026
- EUR/USD Remains Under Sellers’ Control as the Dollar Stays Strong Jun 23, 2026
- Gold Falls for the Third Consecutive Week: Is There Still Upside Potential? Jun 22, 2026
- Bank Indonesia raised its interest rate. Norges Bank and the SNB left rates unchanged Jun 19, 2026