
By InvestMacro
Open Interest (OI) is the amount of contracts that are currently live in the marketplace. OI Strength shows each market’s current strength compared to the past 3-years.
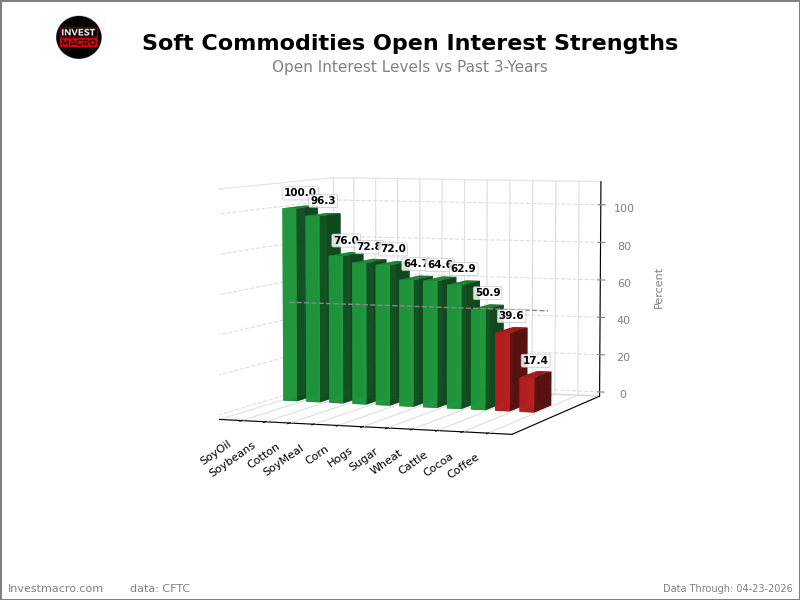
Here are the latest charts and statistics for the Commitment of Traders (COT) reports data published by the Commodities Futures Trading Commission (CFTC).
The latest COT data is updated through Tuesday April 21st and shows a quick view of how large traders (for-profit speculators and commercial entities) were positioned in the futures markets.
Weekly Speculator Changes led by Soybeans & Cocoa
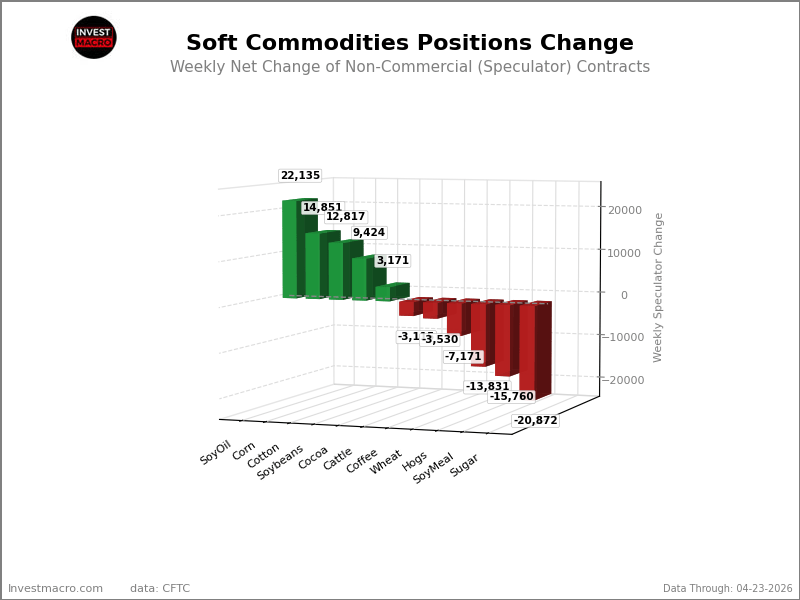
The COT soft commodities markets speculator bets were overall slightly lower this week as five out of the eleven softs markets we cover had higher positioning while the other six markets had lower speculator contracts.
Leading the gains for the softs markets was Soybean Oil (22,135 contracts) with Corn (14,851 contracts), Cotton (12,817 contracts), Soybeans (9,424 contracts), Cocoa (3,171 contracts) and Live Cattle (-3,115 contracts) also showing positive weeks.
Free Reports:
 Get our Weekly Commitment of Traders Reports - See where the biggest traders (Hedge Funds and Commercial Hedgers) are positioned in the futures markets on a weekly basis.
 Download Our Metatrader 4 Indicators – Put Our Free MetaTrader 4 Custom Indicators on your charts when you join our Weekly Newsletter
The markets with the declines in speculator bets this week were Sugar (-20,872 contracts), Soybean Meal (-15,760 contracts), Lean Hogs (-13,831 contracts), Wheat (-7,171 contracts) and with Coffee (-3,530 contracts) also registering lower bets on the week.
Sugar, Soybean Oil lead Soft Commodities price performance
The market’s leading price performance this week was by Sugar which rose by 5.70% over the past five days. This was followed by Soybean Oil, which rose by a strong 4.21%. Cocoa comes in next with a 4.15% gain on the week and Coffee ended up higher by 3.99%. Next up, Corn was up by roughly 3% with a 2.94% gain, followed by Wheat, which rose by 1.36%. Live Cattle and Lean Hogs each advanced by 0.84%, respectively, while Cotton edged up by just 0.04% to round out the gainers on the week.
On the downside, Soybeans dipped by -0.44% and was followed by Soybean Meal, which had the biggest negative return on the week with a -1.82% retreat.
Soft Commodities Data:
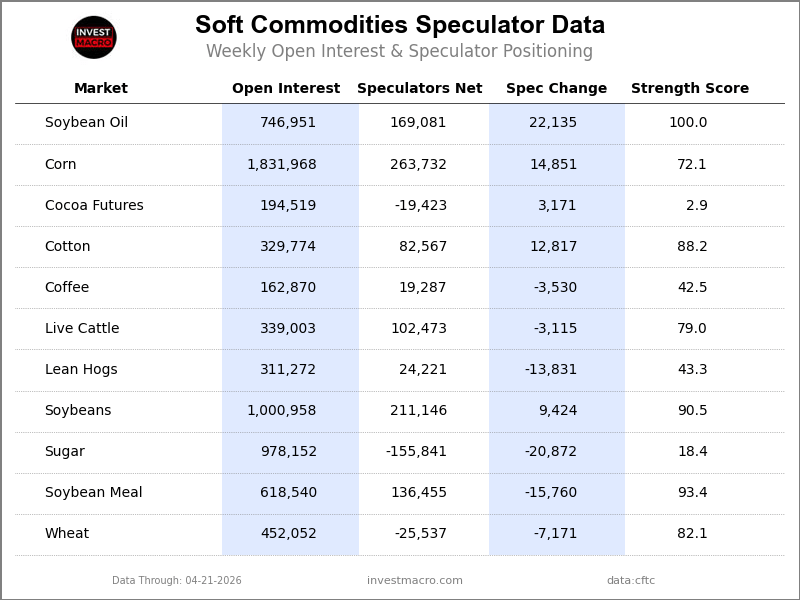
Legend: Weekly Speculators Change | Speculators Current Net Position | Speculators Strength Score compared to last 3-Years (0-100 range)
Strength Scores led by Soybean Oil & Soybean Meal
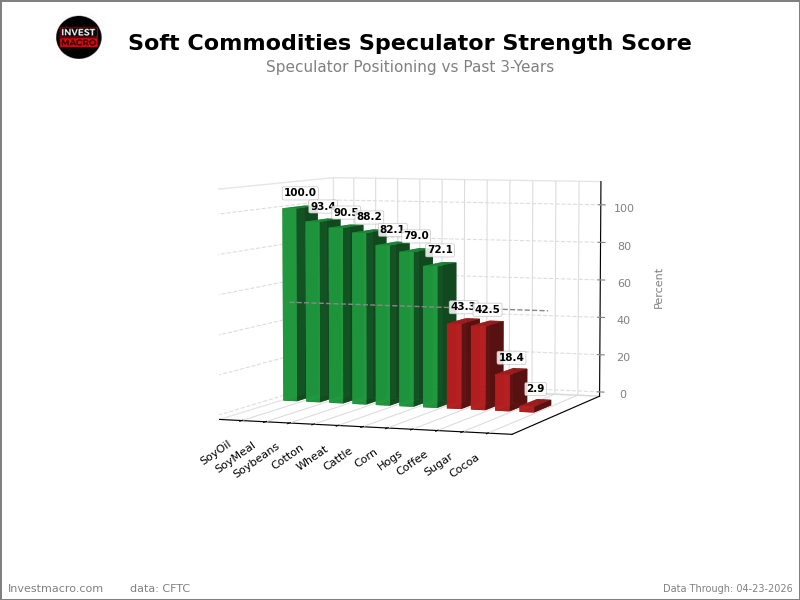
COT Strength Scores (a normalized measure of Speculator positions over a 3-Year range, from 0 to 100 where above 80 is Extreme-Bullish and below 20 is Extreme-Bearish) showed that Soybean Oil (100 percent) and Soybean Meal (93 percent) lead the softs markets this week. Soybeans (90 percent), Cotton (88 percent) and Wheat (82 percent) come in as the next highest in the weekly strength scores.
On the downside, Cocoa (3 percent) and Sugar (18 percent) come in at the lowest strength levels currently and are in Extreme-Bearish territory (below 20 percent). The next lowest strength scores are the Lean Hogs (43 percent) and the Coffee (43 percent).
Strength Statistics:
Corn (72.1 percent) vs Corn previous week (70.1 percent)
Sugar (18.4 percent) vs Sugar previous week (22.4 percent)
Coffee (42.5 percent) vs Coffee previous week (46.1 percent)
Soybeans (90.5 percent) vs Soybeans previous week (88.4 percent)
Soybean Oil (100.0 percent) vs Soybean Oil previous week (91.0 percent)
Soybean Meal (93.4 percent) vs Soybean Meal previous week (100.0 percent)
Live Cattle (79.0 percent) vs Live Cattle previous week (82.1 percent)
Lean Hogs (43.3 percent) vs Lean Hogs previous week (53.2 percent)
Cotton (88.2 percent) vs Cotton previous week (80.6 percent)
Cocoa (2.9 percent) vs Cocoa previous week (0.0 percent)
Wheat (82.1 percent) vs Wheat previous week (88.5 percent)
Cotton & Soybean Oil top the 6-Week Strength Trends
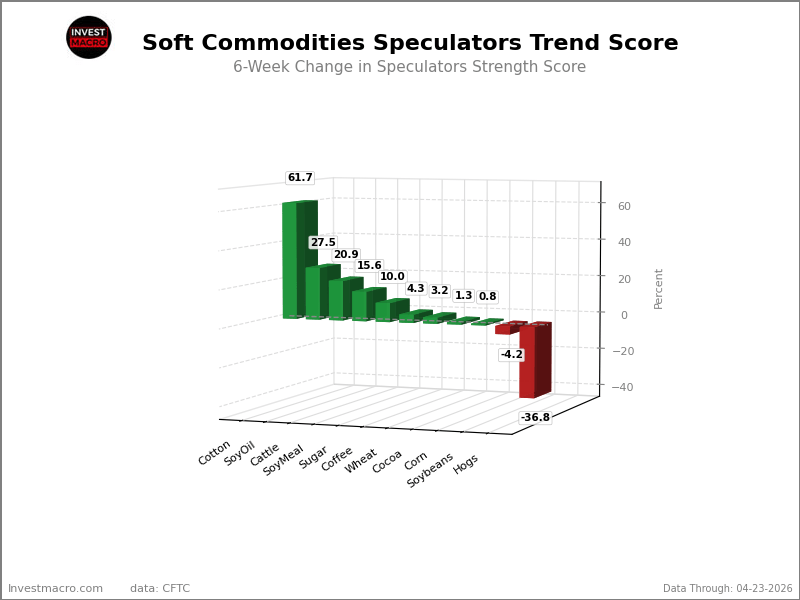
COT Strength Score Trends (or move index, calculates the 6-week changes in strength scores) showed that Cotton (62 percent) and Soybean Oil (28 percent) lead the past six weeks trends for soft commodities. Live Cattle (21 percent), Soybean Meal (16 percent) and Sugar (10 percent) are the next highest positive movers in the latest trends data.
Lean Hogs (-37 percent) leads the downside trend scores currently with Soybeans (-4 percent), Cocoa (1 percent) and Corn (1 percent) following next with lower trend scores.
Strength Trend Statistics:
Corn (0.8 percent) vs Corn previous week (21.6 percent)
Sugar (10.0 percent) vs Sugar previous week (20.8 percent)
Coffee (4.3 percent) vs Coffee previous week (12.1 percent)
Soybeans (-4.2 percent) vs Soybeans previous week (-4.5 percent)
Soybean Oil (27.5 percent) vs Soybean Oil previous week (30.1 percent)
Soybean Meal (15.6 percent) vs Soybean Meal previous week (33.2 percent)
Live Cattle (20.9 percent) vs Live Cattle previous week (17.6 percent)
Lean Hogs (-36.8 percent) vs Lean Hogs previous week (-26.5 percent)
Cotton (61.7 percent) vs Cotton previous week (58.3 percent)
Cocoa (1.3 percent) vs Cocoa previous week (-4.3 percent)
Wheat (3.2 percent) vs Wheat previous week (6.8 percent)
Individual Soft Commodities Markets:
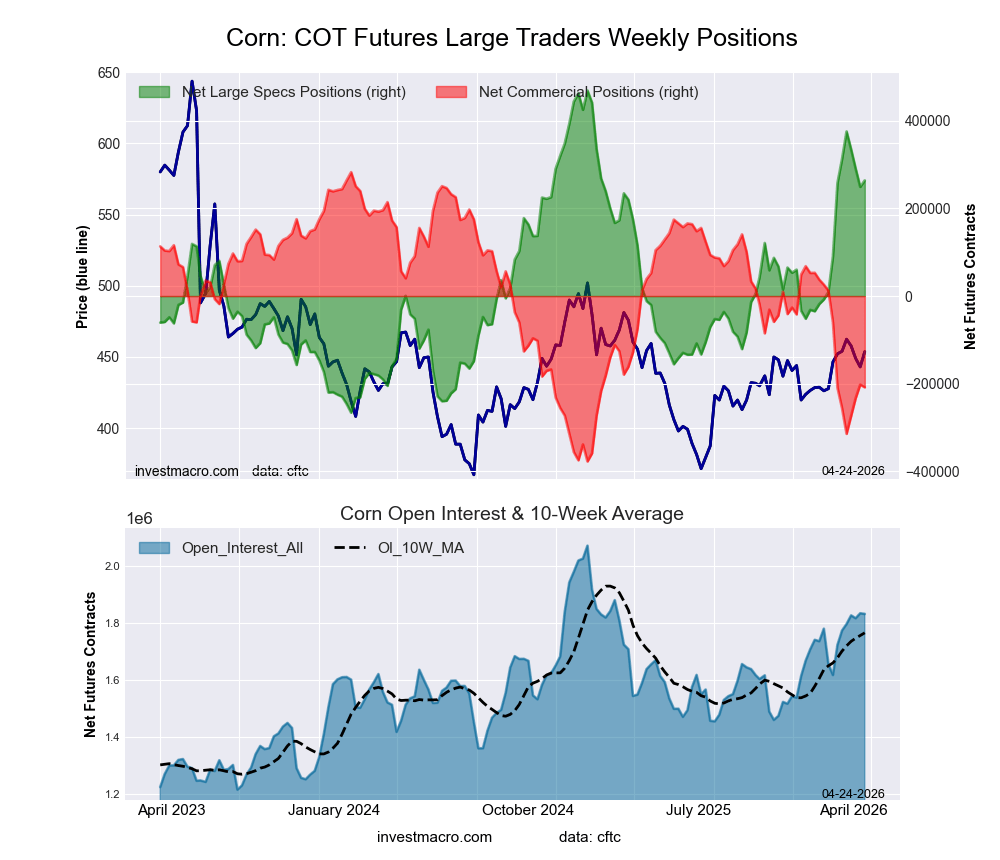
CORN Futures:
 Positioning Notes:
- CORN large speculator standing this week was a net position of 263,732 contracts in the data reported through Tuesday.
- Weekly Speculator position advance of 14,851 contracts from the previous week which had a total of 248,881 net contracts.
- This week’s current strength score (range over the past 3 years, measured from 0 to 100) shows the speculators are currently Bullish with a score of 72.1 percent.
- The Commercials are Bearish with a score of 25.6 percent.
- The Small Traders (not shown in chart) are Bearish with a score of 41.9 percent.
Price Trend-Following Model: Strong Uptrend
Our weekly trend-following model classifies the current market price position as: Strong Uptrend.
| CORN Futures Statistics | SPECULATORS | COMMERCIALS | SMALL TRADERS |
| – Percent of Open Interest Longs: | 26.2 | 40.9 | 7.8 |
| – Percent of Open Interest Shorts: | 11.8 | 52.3 | 10.8 |
| – Net Position: | 263,732 | -208,245 | -55,487 |
| – Gross Longs: | 480,510 | 749,591 | 142,181 |
| – Gross Shorts: | 216,778 | 957,836 | 197,668 |
| – Long to Short Ratio: | 2.2 to 1 | 0.8 to 1 | 0.7 to 1 |
| NET POSITION TREND: | |||
| – Strength Index Score (3 Year Range Pct): | 72.1 | 25.6 | 41.9 |
| – Strength Index Reading (3 Year Range): | Bullish | Bearish | Bearish |
| NET POSITION MOVEMENT INDEX: | |||
| – 6-Week Change in Strength Index: | 0.8 | 0.1 | -8.0 |
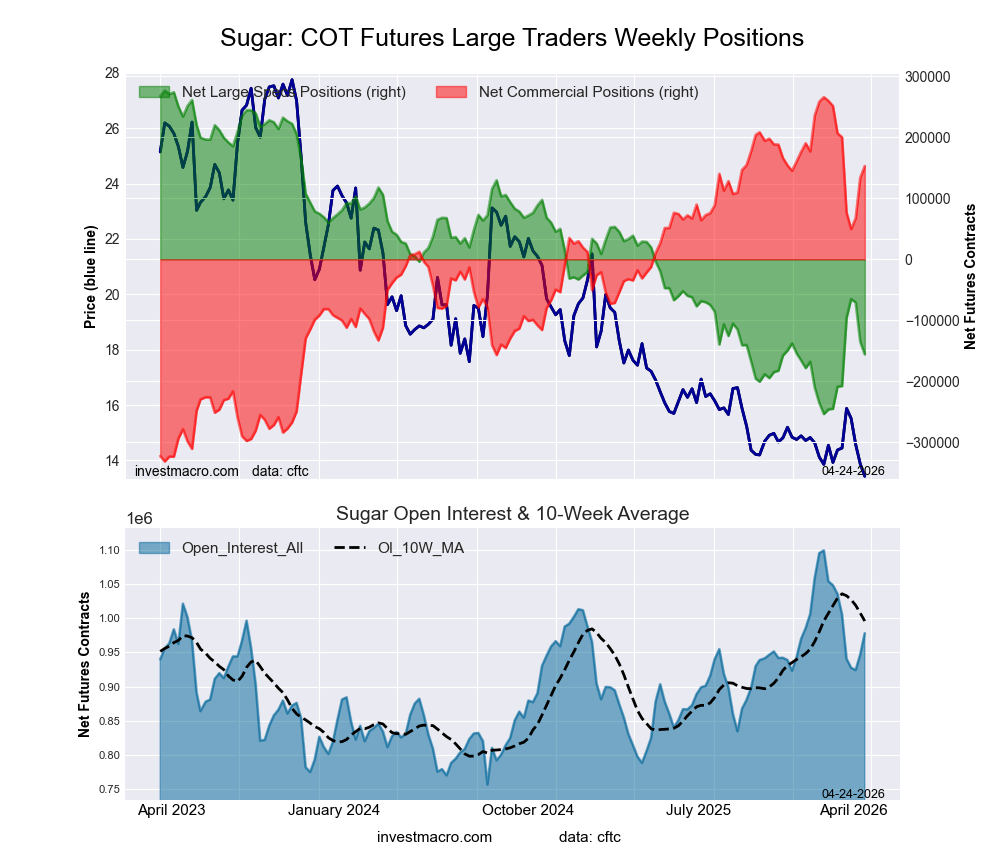
SUGAR Futures:
 Positioning Notes:
- SUGAR large speculator standing this week was a net position of -155,841 contracts in the data reported through Tuesday.
- Weekly Speculator position fall of -20,872 contracts from the previous week which had a total of -134,969 net contracts.
- This week’s current strength score (range over the past 3 years, measured from 0 to 100) shows the speculators are currently Bearish-Extreme with a score of 18.4 percent.
- The Commercials are Bullish-Extreme with a score of 81.1 percent.
- The Small Traders (not shown in chart) are Bearish with a score of 35.6 percent.
Price Trend-Following Model: Strong Downtrend
Our weekly trend-following model classifies the current market price position as: Strong Downtrend.
| SUGAR Futures Statistics | SPECULATORS | COMMERCIALS | SMALL TRADERS |
| – Percent of Open Interest Longs: | 19.7 | 54.8 | 9.2 |
| – Percent of Open Interest Shorts: | 35.7 | 39.2 | 8.8 |
| – Net Position: | -155,841 | 152,843 | 2,998 |
| – Gross Longs: | 193,071 | 535,845 | 89,527 |
| – Gross Shorts: | 348,912 | 383,002 | 86,529 |
| – Long to Short Ratio: | 0.6 to 1 | 1.4 to 1 | 1.0 to 1 |
| NET POSITION TREND: | |||
| – Strength Index Score (3 Year Range Pct): | 18.4 | 81.1 | 35.6 |
| – Strength Index Reading (3 Year Range): | Bearish-Extreme | Bullish-Extreme | Bearish |
| NET POSITION MOVEMENT INDEX: | |||
| – 6-Week Change in Strength Index: | 10.0 | -9.0 | 1.1 |
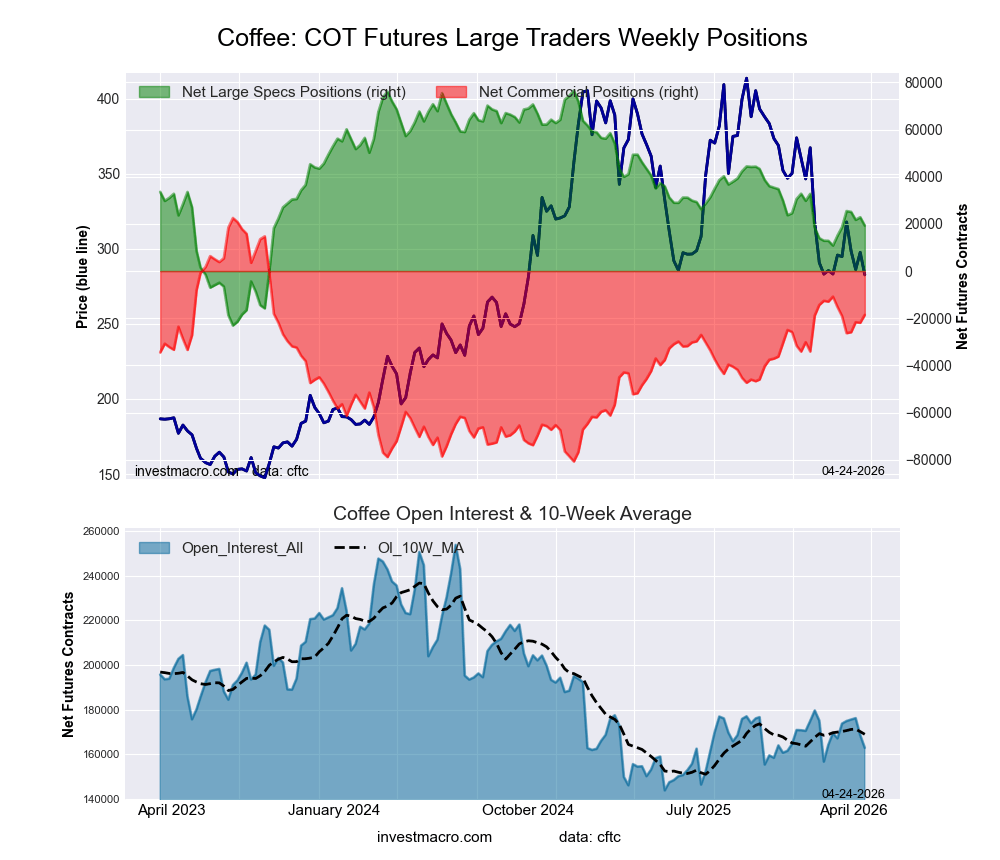
COFFEE Futures:
 Positioning Notes:
- COFFEE large speculator standing this week was a net position of 19,287 contracts in the data reported through Tuesday.
- Weekly Speculator position decline of -3,530 contracts from the previous week which had a total of 22,817 net contracts.
- This week’s current strength score (range over the past 3 years, measured from 0 to 100) shows the speculators are currently Bearish with a score of 42.5 percent.
- The Commercials are Bullish with a score of 60.2 percent.
- The Small Traders (not shown in chart) are Bearish-Extreme with a score of 3.2 percent.
Price Trend-Following Model: Downtrend
Our weekly trend-following model classifies the current market price position as: Downtrend.
| COFFEE Futures Statistics | SPECULATORS | COMMERCIALS | SMALL TRADERS |
| – Percent of Open Interest Longs: | 31.3 | 38.0 | 4.2 |
| – Percent of Open Interest Shorts: | 19.4 | 49.4 | 4.6 |
| – Net Position: | 19,287 | -18,586 | -701 |
| – Gross Longs: | 50,927 | 61,935 | 6,764 |
| – Gross Shorts: | 31,640 | 80,521 | 7,465 |
| – Long to Short Ratio: | 1.6 to 1 | 0.8 to 1 | 0.9 to 1 |
| NET POSITION TREND: | |||
| – Strength Index Score (3 Year Range Pct): | 42.5 | 60.2 | 3.2 |
| – Strength Index Reading (3 Year Range): | Bearish | Bullish | Bearish-Extreme |
| NET POSITION MOVEMENT INDEX: | |||
| – 6-Week Change in Strength Index: | 4.3 | -3.2 | -16.5 |
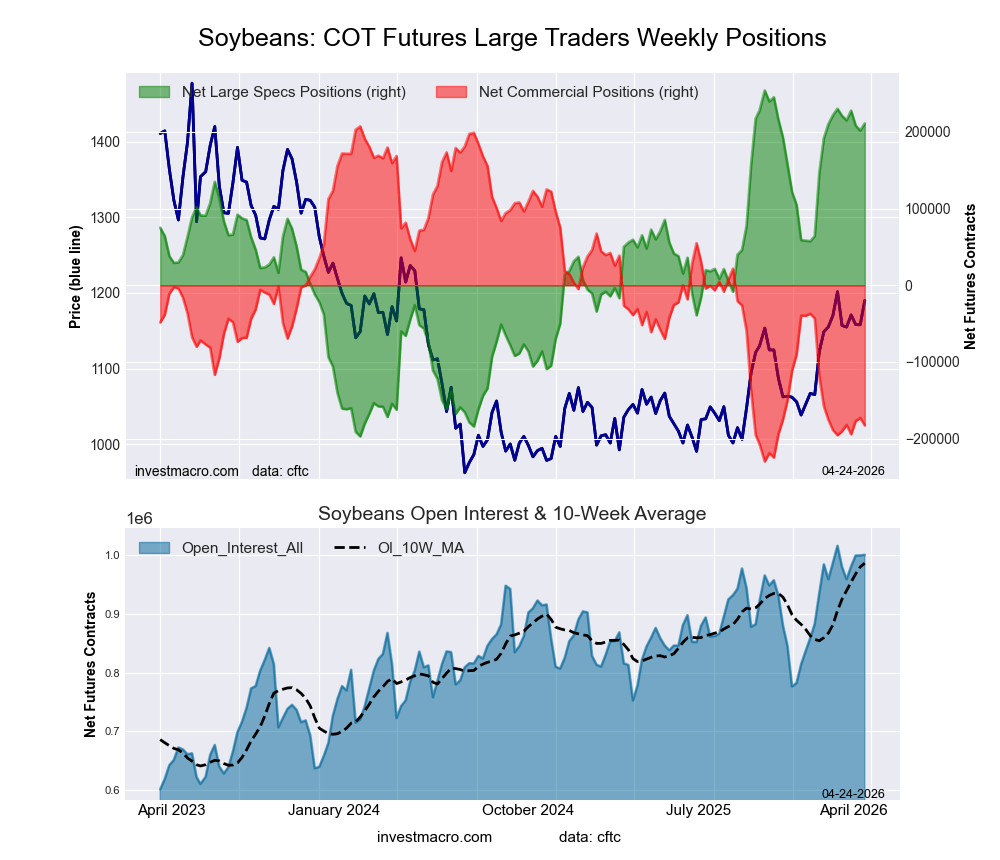
SOYBEANS Futures:
 Positioning Notes:
- SOYBEANS large speculator standing this week was a net position of 211,146 contracts in the data reported through Tuesday.
- Weekly Speculator position rise of 9,424 contracts from the previous week which had a total of 201,722 net contracts.
- This week’s current strength score (range over the past 3 years, measured from 0 to 100) shows the speculators are currently Bullish-Extreme with a score of 90.5 percent.
- The Commercials are Bearish-Extreme with a score of 10.7 percent.
- The Small Traders (not shown in chart) are Bearish with a score of 23.6 percent.
Price Trend-Following Model: Uptrend
Our weekly trend-following model classifies the current market price position as: Uptrend.
| SOYBEANS Futures Statistics | SPECULATORS | COMMERCIALS | SMALL TRADERS |
| – Percent of Open Interest Longs: | 28.6 | 45.0 | 5.4 |
| – Percent of Open Interest Shorts: | 7.5 | 63.3 | 8.3 |
| – Net Position: | 211,146 | -182,906 | -28,240 |
| – Gross Longs: | 286,201 | 450,786 | 54,457 |
| – Gross Shorts: | 75,055 | 633,692 | 82,697 |
| – Long to Short Ratio: | 3.8 to 1 | 0.7 to 1 | 0.7 to 1 |
| NET POSITION TREND: | |||
| – Strength Index Score (3 Year Range Pct): | 90.5 | 10.7 | 23.6 |
| – Strength Index Reading (3 Year Range): | Bullish-Extreme | Bearish-Extreme | Bearish |
| NET POSITION MOVEMENT INDEX: | |||
| – 6-Week Change in Strength Index: | -4.2 | 2.9 | 20.9 |
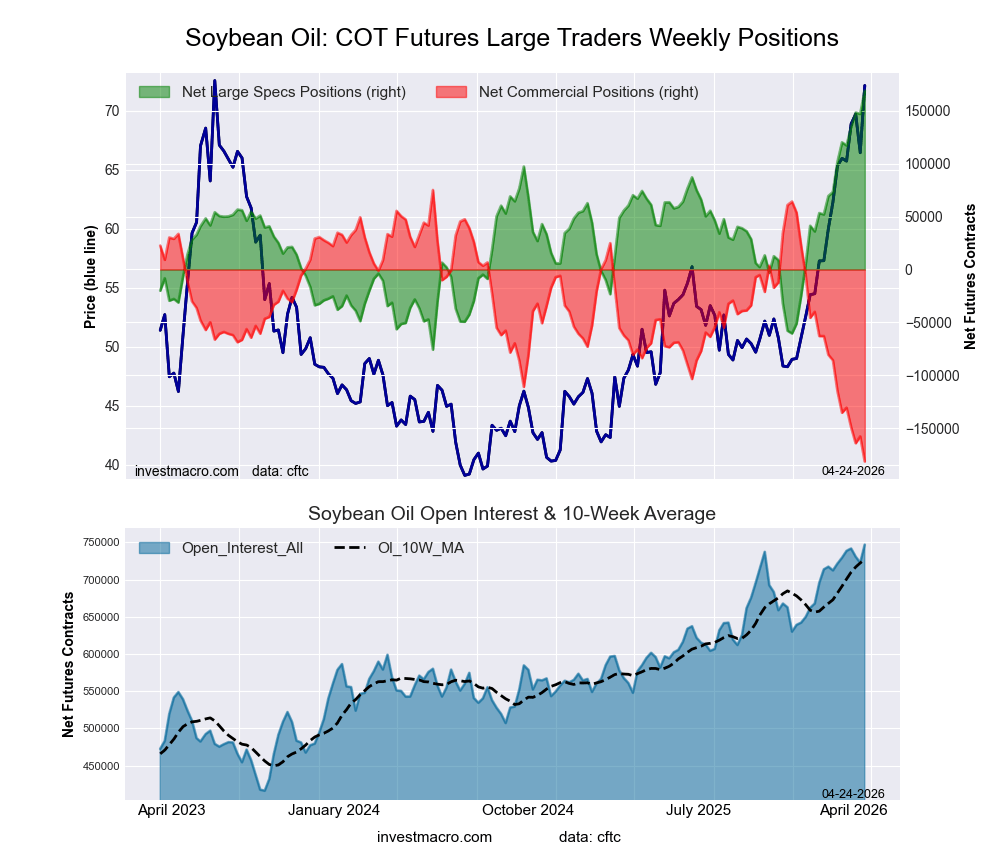
SOYBEAN OIL Futures:
 Positioning Notes:
- SOYBEAN OIL large speculator standing this week was a net position of 169,081 contracts in the data reported through Tuesday.
- Weekly Speculator position gain of 22,135 contracts from the previous week which had a total of 146,946 net contracts.
- This week’s current strength score (range over the past 3 years, measured from 0 to 100) shows the speculators are currently Bullish-Extreme with a score of 100.0 percent.
- The Commercials are Bearish-Extreme with a score of 0.0 percent.
- The Small Traders (not shown in chart) are Bullish with a score of 79.6 percent.
Price Trend-Following Model: Uptrend
Our weekly trend-following model classifies the current market price position as: Uptrend.
| SOYBEAN OIL Futures Statistics | SPECULATORS | COMMERCIALS | SMALL TRADERS |
| – Percent of Open Interest Longs: | 30.0 | 42.5 | 5.4 |
| – Percent of Open Interest Shorts: | 7.4 | 66.8 | 3.7 |
| – Net Position: | 169,081 | -181,380 | 12,299 |
| – Gross Longs: | 224,348 | 317,537 | 40,242 |
| – Gross Shorts: | 55,267 | 498,917 | 27,943 |
| – Long to Short Ratio: | 4.1 to 1 | 0.6 to 1 | 1.4 to 1 |
| NET POSITION TREND: | |||
| – Strength Index Score (3 Year Range Pct): | 100.0 | 0.0 | 79.6 |
| – Strength Index Reading (3 Year Range): | Bullish-Extreme | Bearish-Extreme | Bullish |
| NET POSITION MOVEMENT INDEX: | |||
| – 6-Week Change in Strength Index: | 27.5 | -25.9 | -4.6 |
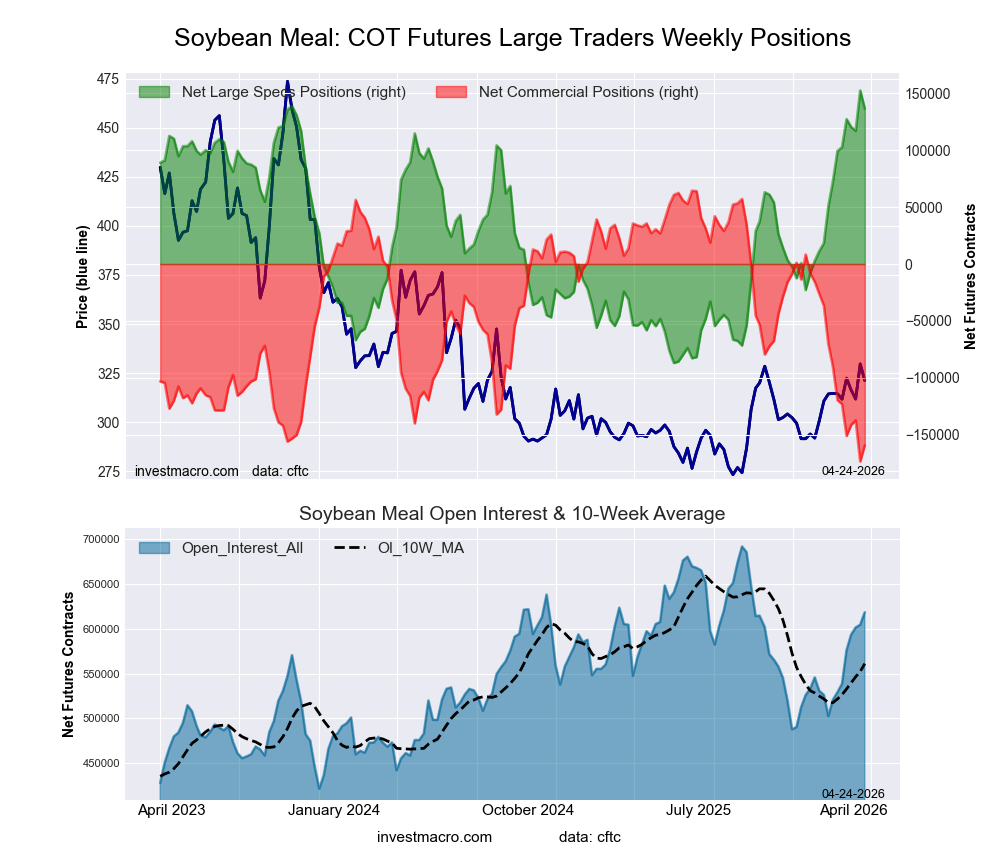
SOYBEAN MEAL Futures:
 Positioning Notes:
- SOYBEAN MEAL large speculator standing this week was a net position of 136,455 contracts in the data reported through Tuesday.
- Weekly Speculator position decline of -15,760 contracts from the previous week which had a total of 152,215 net contracts.
- This week’s current strength score (range over the past 3 years, measured from 0 to 100) shows the speculators are currently Bullish-Extreme with a score of 93.4 percent.
- The Commercials are Bearish-Extreme with a score of 6.0 percent.
- The Small Traders (not shown in chart) are Bullish with a score of 70.1 percent.
Price Trend-Following Model: Uptrend
Our weekly trend-following model classifies the current market price position as: Uptrend.
| SOYBEAN MEAL Futures Statistics | SPECULATORS | COMMERCIALS | SMALL TRADERS |
| – Percent of Open Interest Longs: | 30.2 | 44.5 | 7.9 |
| – Percent of Open Interest Shorts: | 8.1 | 70.2 | 4.2 |
| – Net Position: | 136,455 | -159,019 | 22,564 |
| – Gross Longs: | 186,789 | 275,402 | 48,845 |
| – Gross Shorts: | 50,334 | 434,421 | 26,281 |
| – Long to Short Ratio: | 3.7 to 1 | 0.6 to 1 | 1.9 to 1 |
| NET POSITION TREND: | |||
| – Strength Index Score (3 Year Range Pct): | 93.4 | 6.0 | 70.1 |
| – Strength Index Reading (3 Year Range): | Bullish-Extreme | Bearish-Extreme | Bullish |
| NET POSITION MOVEMENT INDEX: | |||
| – 6-Week Change in Strength Index: | 15.6 | -16.7 | 12.9 |
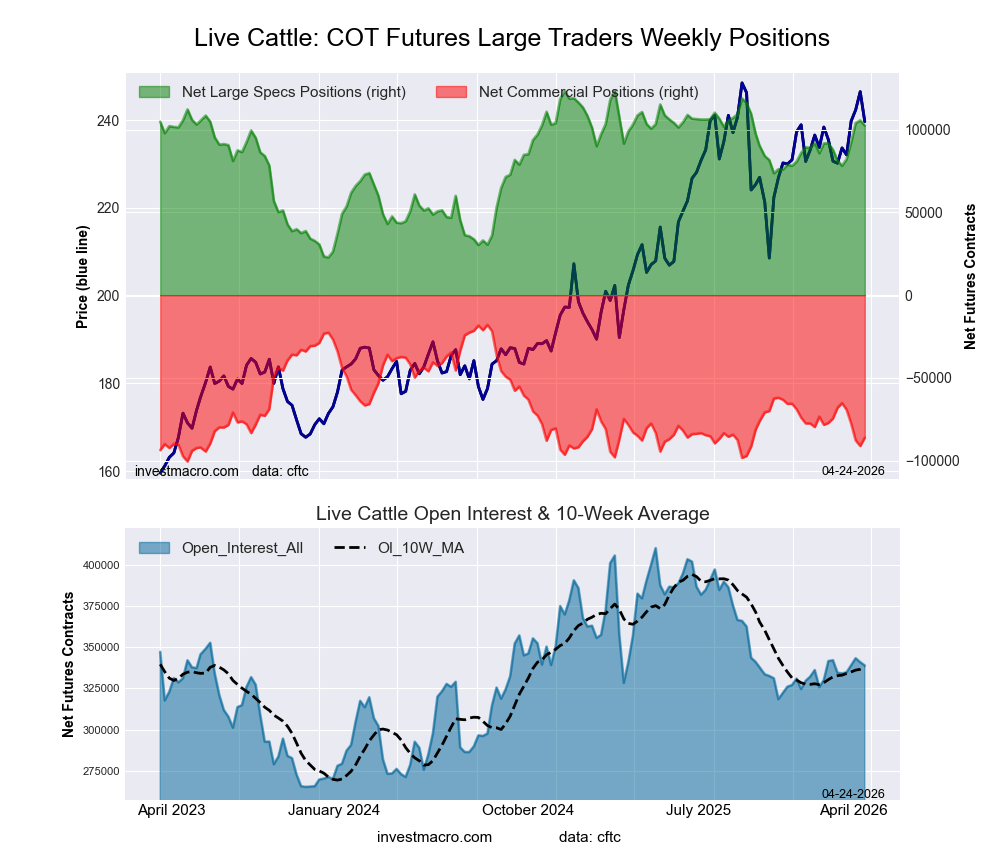
LIVE CATTLE Futures:
 Positioning Notes:
- LIVE CATTLE large speculator standing this week was a net position of 102,473 contracts in the data reported through Tuesday.
- Weekly Speculator position fall of -3,115 contracts from the previous week which had a total of 105,588 net contracts.
- This week’s current strength score (range over the past 3 years, measured from 0 to 100) shows the speculators are currently Bullish with a score of 79.0 percent.
- The Commercials are Bearish-Extreme with a score of 17.4 percent.
- The Small Traders (not shown in chart) are Bearish with a score of 40.8 percent.
Price Trend-Following Model: Strong Uptrend
Our weekly trend-following model classifies the current market price position as: Strong Uptrend.
| LIVE CATTLE Futures Statistics | SPECULATORS | COMMERCIALS | SMALL TRADERS |
| – Percent of Open Interest Longs: | 46.2 | 28.4 | 8.1 |
| – Percent of Open Interest Shorts: | 15.9 | 53.9 | 12.9 |
| – Net Position: | 102,473 | -86,112 | -16,361 |
| – Gross Longs: | 156,520 | 96,446 | 27,472 |
| – Gross Shorts: | 54,047 | 182,558 | 43,833 |
| – Long to Short Ratio: | 2.9 to 1 | 0.5 to 1 | 0.6 to 1 |
| NET POSITION TREND: | |||
| – Strength Index Score (3 Year Range Pct): | 79.0 | 17.4 | 40.8 |
| – Strength Index Reading (3 Year Range): | Bullish | Bearish-Extreme | Bearish |
| NET POSITION MOVEMENT INDEX: | |||
| – 6-Week Change in Strength Index: | 20.9 | -21.9 | -10.6 |
LEAN HOGS Futures:
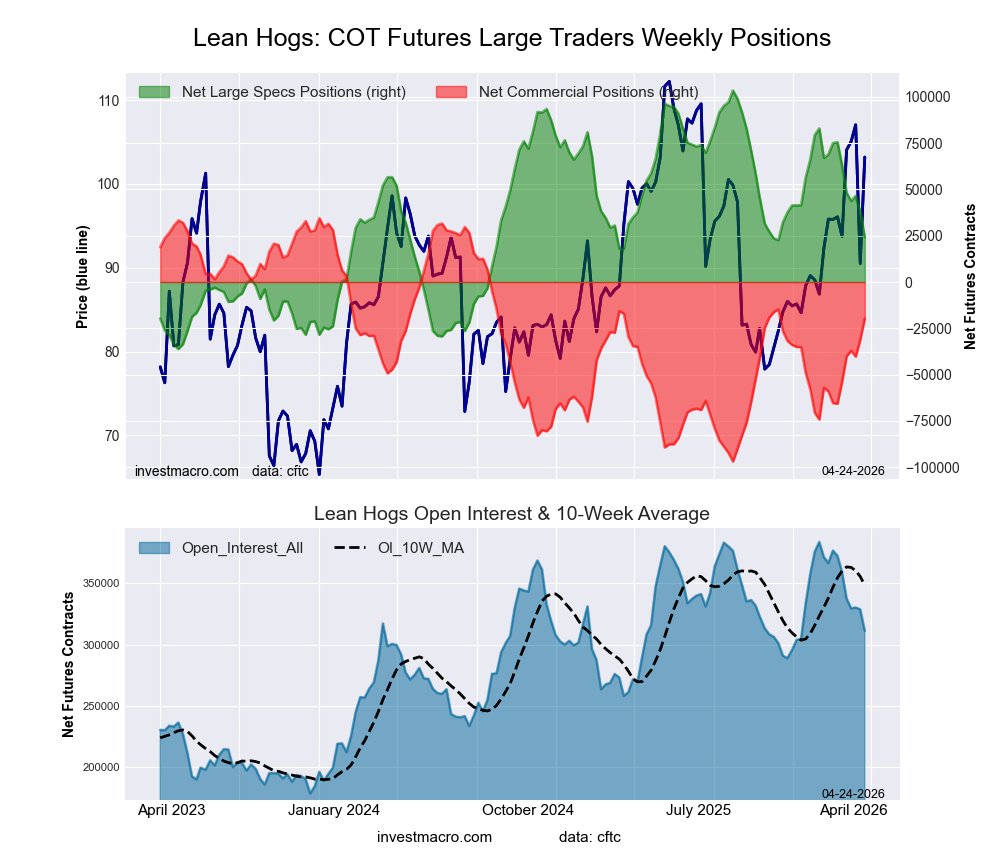 Positioning Notes:
- LEAN HOGS large speculator standing this week was a net position of 24,221 contracts in the data reported through Tuesday.
- Weekly Speculator position decrease of -13,831 contracts from the previous week which had a total of 38,052 net contracts.
- This week’s current strength score (range over the past 3 years, measured from 0 to 100) shows the speculators are currently Bearish with a score of 43.3 percent.
- The Commercials are Bullish with a score of 58.7 percent.
- The Small Traders (not shown in chart) are Bullish with a score of 51.5 percent.
Price Trend-Following Model: Uptrend
Our weekly trend-following model classifies the current market price position as: Uptrend.
| LEAN HOGS Futures Statistics | SPECULATORS | COMMERCIALS | SMALL TRADERS |
| – Percent of Open Interest Longs: | 31.8 | 37.0 | 6.8 |
| – Percent of Open Interest Shorts: | 24.0 | 43.4 | 8.3 |
| – Net Position: | 24,221 | -19,752 | -4,469 |
| – Gross Longs: | 98,890 | 115,319 | 21,270 |
| – Gross Shorts: | 74,669 | 135,071 | 25,739 |
| – Long to Short Ratio: | 1.3 to 1 | 0.9 to 1 | 0.8 to 1 |
| NET POSITION TREND: | |||
| – Strength Index Score (3 Year Range Pct): | 43.3 | 58.7 | 51.5 |
| – Strength Index Reading (3 Year Range): | Bearish | Bullish | Bullish |
| NET POSITION MOVEMENT INDEX: | |||
| – 6-Week Change in Strength Index: | -36.8 | 35.0 | 32.7 |
COTTON Futures:
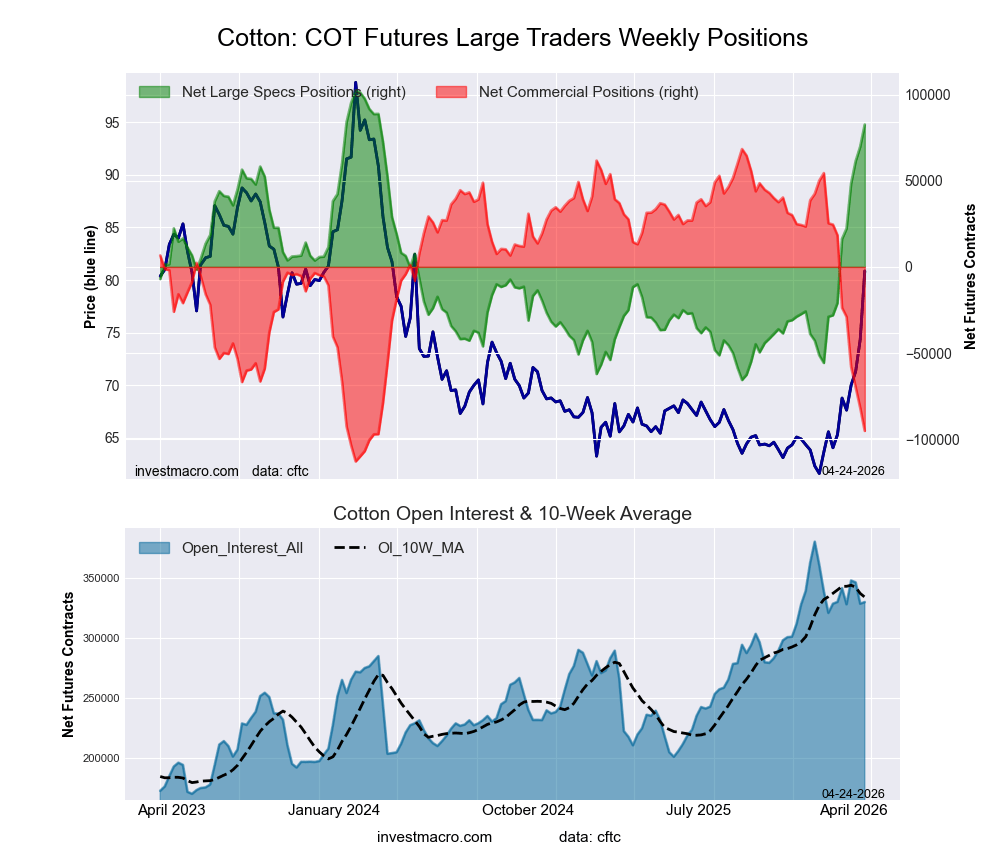 Positioning Notes:
- COTTON large speculator standing this week was a net position of 82,567 contracts in the data reported through Tuesday.
- Weekly Speculator position gain of 12,817 contracts from the previous week which had a total of 69,750 net contracts.
- This week’s current strength score (range over the past 3 years, measured from 0 to 100) shows the speculators are currently Bullish-Extreme with a score of 88.2 percent.
- The Commercials are Bearish-Extreme with a score of 9.8 percent.
- The Small Traders (not shown in chart) are Bullish-Extreme with a score of 100.0 percent.
Price Trend-Following Model: Strong Uptrend
Our weekly trend-following model classifies the current market price position as: Strong Uptrend.
| COTTON Futures Statistics | SPECULATORS | COMMERCIALS | SMALL TRADERS |
| – Percent of Open Interest Longs: | 41.3 | 32.9 | 6.3 |
| – Percent of Open Interest Shorts: | 16.3 | 61.8 | 2.5 |
| – Net Position: | 82,567 | -95,143 | 12,576 |
| – Gross Longs: | 136,259 | 108,509 | 20,884 |
| – Gross Shorts: | 53,692 | 203,652 | 8,308 |
| – Long to Short Ratio: | 2.5 to 1 | 0.5 to 1 | 2.5 to 1 |
| NET POSITION TREND: | |||
| – Strength Index Score (3 Year Range Pct): | 88.2 | 9.8 | 100.0 |
| – Strength Index Reading (3 Year Range): | Bullish-Extreme | Bearish-Extreme | Bullish-Extreme |
| NET POSITION MOVEMENT INDEX: | |||
| – 6-Week Change in Strength Index: | 61.7 | -62.6 | 63.3 |
COCOA Futures:
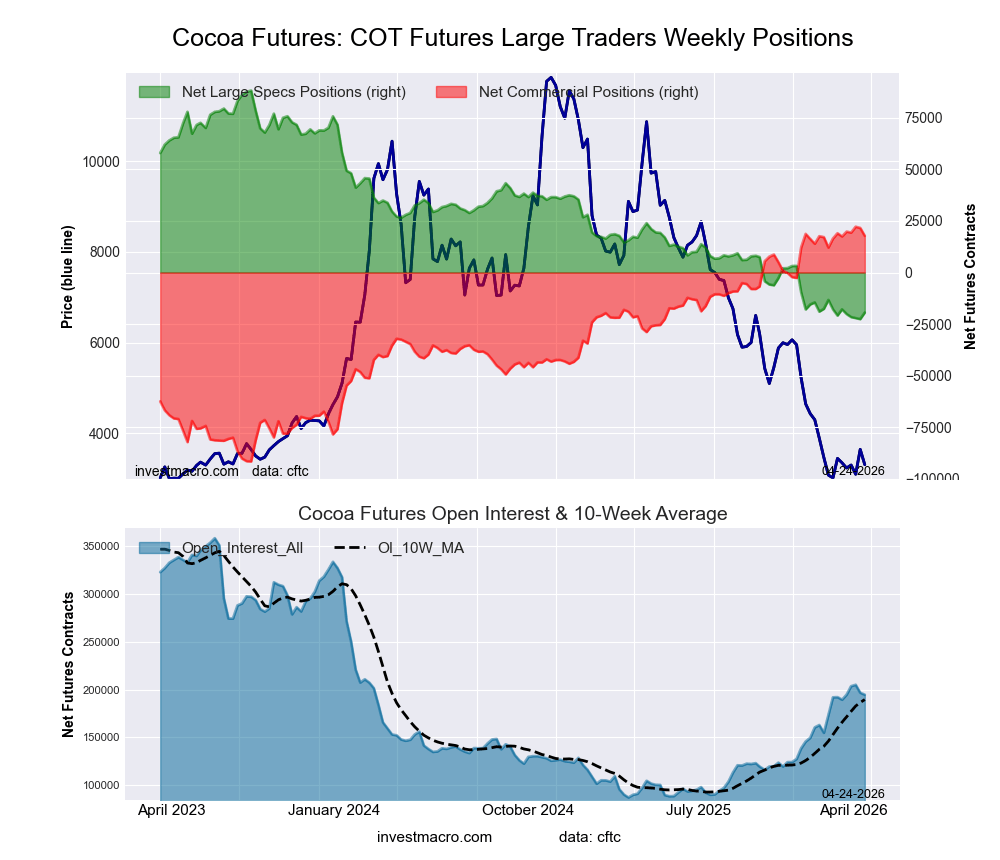 Positioning Notes:
- COCOA large speculator standing this week was a net position of -19,423 contracts in the data reported through Tuesday.
- Weekly Speculator position gain of 3,171 contracts from the previous week which had a total of -22,594 net contracts.
- This week’s current strength score (range over the past 3 years, measured from 0 to 100) shows the speculators are currently Bearish-Extreme with a score of 2.9 percent.
- The Commercials are Bullish-Extreme with a score of 96.2 percent.
- The Small Traders (not shown in chart) are Bearish with a score of 42.5 percent.
Price Trend-Following Model: Downtrend
Our weekly trend-following model classifies the current market price position as: Downtrend.
| COCOA Futures Statistics | SPECULATORS | COMMERCIALS | SMALL TRADERS |
| – Percent of Open Interest Longs: | 22.2 | 52.1 | 5.7 |
| – Percent of Open Interest Shorts: | 32.2 | 42.9 | 4.9 |
| – Net Position: | -19,423 | 17,820 | 1,603 |
| – Gross Longs: | 43,185 | 101,347 | 11,115 |
| – Gross Shorts: | 62,608 | 83,527 | 9,512 |
| – Long to Short Ratio: | 0.7 to 1 | 1.2 to 1 | 1.2 to 1 |
| NET POSITION TREND: | |||
| – Strength Index Score (3 Year Range Pct): | 2.9 | 96.2 | 42.5 |
| – Strength Index Reading (3 Year Range): | Bearish-Extreme | Bullish-Extreme | Bearish |
| NET POSITION MOVEMENT INDEX: | |||
| – 6-Week Change in Strength Index: | 1.3 | -1.1 | -1.9 |
WHEAT Futures:
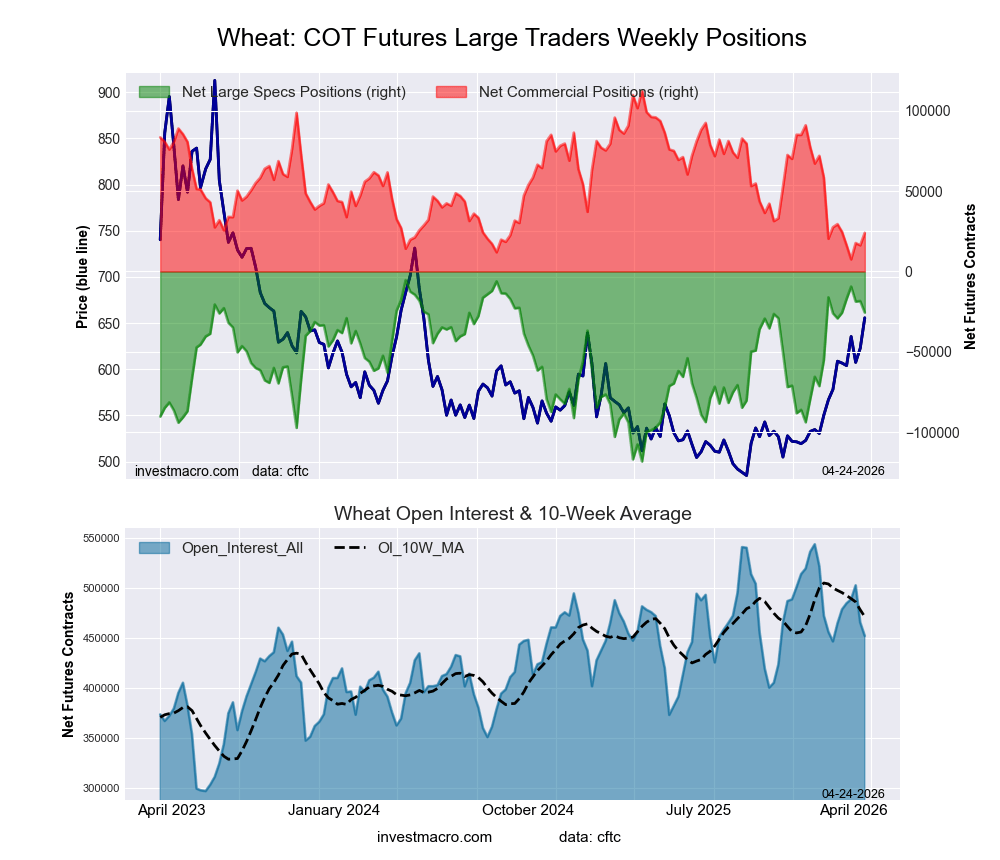 Positioning Notes:
- WHEAT large speculator standing this week was a net position of -25,537 contracts in the data reported through Tuesday.
- Weekly Speculator position decline of -7,171 contracts from the previous week which had a total of -18,366 net contracts.
- This week’s current strength score (range over the past 3 years, measured from 0 to 100) shows the speculators are currently Bullish-Extreme with a score of 82.1 percent.
- The Commercials are Bearish-Extreme with a score of 15.7 percent.
- The Small Traders (not shown in chart) are Bullish with a score of 65.6 percent.
Price Trend-Following Model: Strong Uptrend
Our weekly trend-following model classifies the current market price position as: Strong Uptrend.
| WHEAT Futures Statistics | SPECULATORS | COMMERCIALS | SMALL TRADERS |
| – Percent of Open Interest Longs: | 26.8 | 34.2 | 7.3 |
| – Percent of Open Interest Shorts: | 32.4 | 28.9 | 7.0 |
| – Net Position: | -25,537 | 23,985 | 1,552 |
| – Gross Longs: | 121,024 | 154,803 | 32,992 |
| – Gross Shorts: | 146,561 | 130,818 | 31,440 |
| – Long to Short Ratio: | 0.8 to 1 | 1.2 to 1 | 1.0 to 1 |
| NET POSITION TREND: | |||
| – Strength Index Score (3 Year Range Pct): | 82.1 | 15.7 | 65.6 |
| – Strength Index Reading (3 Year Range): | Bullish-Extreme | Bearish-Extreme | Bullish |
| NET POSITION MOVEMENT INDEX: | |||
| – 6-Week Change in Strength Index: | 3.2 | -5.2 | 11.0 |
Article By InvestMacro – Receive our weekly COT Newsletter
*COT Report: The COT data, released weekly to the public each Friday, is updated through the most recent Tuesday (data is 3 days old) and shows a quick view of how large speculators or non-commercials (for-profit traders) were positioned in the futures markets.
The CFTC categorizes trader positions according to commercial hedgers (traders who use futures contracts for hedging as part of the business), non-commercials (large traders who speculate to realize trading profits) and nonreportable traders (usually small traders/speculators) as well as their open interest (contracts open in the market at time of reporting). See CFTC criteria here.

- COT Metals Charts: Weekly Speculator Bets led by Copper & Steel Jul 18, 2026
- COT Bonds Charts: Weekly Speculator Bets led by 2-Year, SOFR 3M & 5-Year Bonds Jul 18, 2026
- COT Energy Charts: Weekly Speculator Bets led by Brent Oil & Heating Oil Jul 18, 2026
- COT Soft Commodities Charts: Weekly Speculator Bets led by Wheat, Corn & Soybean Meal Jul 18, 2026
- The Bank of Canada kept its interest rate unchanged. Platinum prices reached a three‑week high Jul 16, 2026
- Stock indices rose after the release of US inflation data. China’s GDP slowed sharply Jul 15, 2026
- GBP/USD Awaits Political News: What Will Happen Next Jul 15, 2026
- USD/JPY Holds at Highs: Pressure Lingers on Yen Jul 14, 2026
- Oil prices jumped 4% amid a new wave of escalation between the US and Iran Jul 13, 2026
- EUR/USD: US Inflation Will Determine Everything Jul 13, 2026