
By InvestMacro
Here are the latest charts and statistics for the Commitment of Traders (COT) data published by the Commodities Futures Trading Commission (CFTC).
The latest COT data is updated through Tuesday March 4th and shows a quick view of how large traders (for-profit speculators and commercial entities) were positioned in the futures markets.
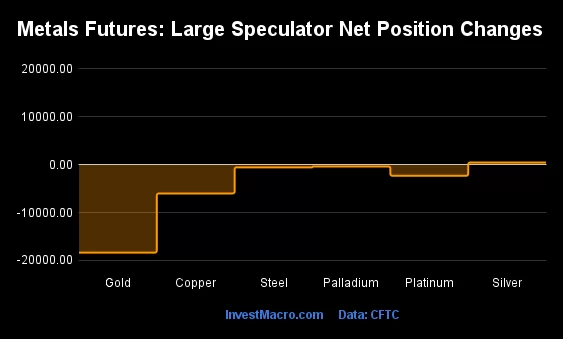
Weekly Speculator Changes led lower by Gold, Copper & Platinum
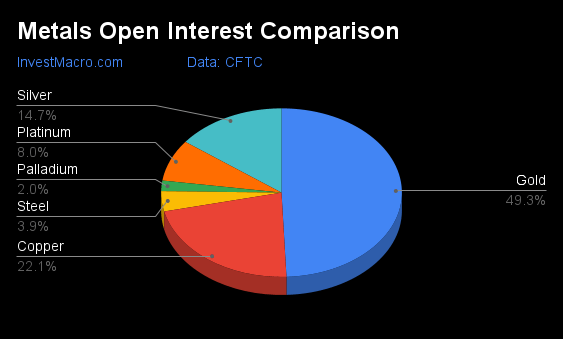
The COT metals markets speculator bets were overall lower this week as just one out of the six metals markets we cover had higher positioning while the other five markets had lower speculator contracts.
Free Reports:
 Download Our Metatrader 4 Indicators – Put Our Free MetaTrader 4 Custom Indicators on your charts when you join our Weekly Newsletter
 Get our Weekly Commitment of Traders Reports - See where the biggest traders (Hedge Funds and Commercial Hedgers) are positioned in the futures markets on a weekly basis.
Leading the gains for the metals category this week was Silver with a small gain of 454 contracts.
The markets with declines in speculator bets for the week were Gold (-18,364 contracts), Copper (-6,010 contracts), Platinum (-2,324 contracts), Steel (-557 contracts) and with Palladium (-385 contracts) also registering lower bets on the week.
Metals Net Speculators Leaderboard
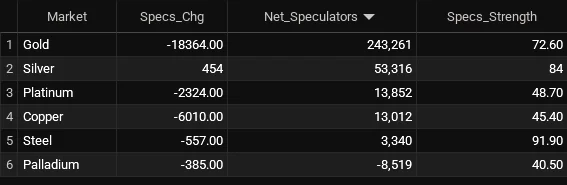
Legend: Weekly Speculators Change | Speculators Current Net Position | Speculators Strength Score compared to last 3-Years (0-100 range)
Strength Scores led by Steel & Silver
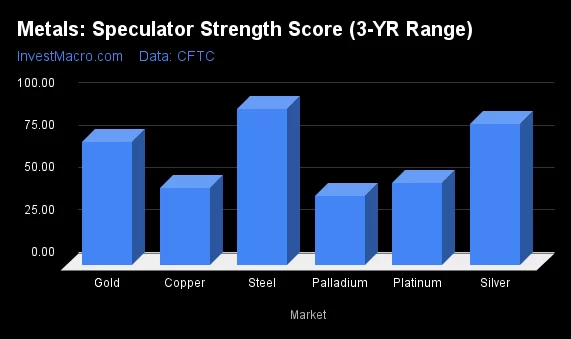
COT Strength Scores (a normalized measure of Speculator positions over a 3-Year range, from 0 to 100 where above 80 is Extreme-Bullish and below 20 is Extreme-Bearish) showed that Steel (92 percent) and Silver (84 percent) led the metals markets this week. Gold (73 percent) comes in as the next highest in the weekly strength scores.
On the downside, Palladium (41 percent) and Copper (45 percent) come in at the lowest strength levels currently.
Strength Statistics:
Gold (72.6 percent) vs Gold previous week (79.6 percent)
Silver (83.5 percent) vs Silver previous week (83.0 percent)
Copper (45.4 percent) vs Copper previous week (51.0 percent)
Platinum (48.7 percent) vs Platinum previous week (54.2 percent)
Palladium (40.5 percent) vs Palladium previous week (43.4 percent)
Steel (91.9 percent) vs Palladium previous week (94.5 percent)
Steel & Silver top the 6-Week Strength Trends
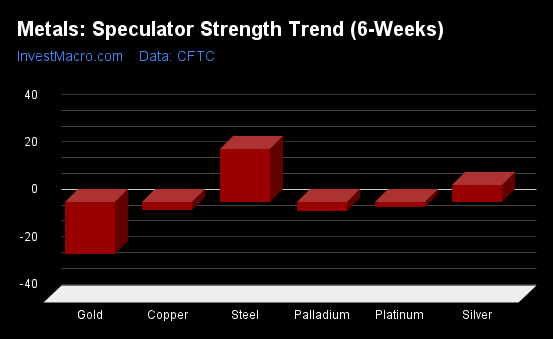
COT Strength Score Trends (or move index, calculates the 6-week changes in strength scores) showed that Steel (23 percent) and Silver (7 percent) lead the past six weeks trends for metals.
Gold (-22 percent) leads the downside trend scores currently with Palladium (-4 percent) and Copper (-3 percent) as the next market with lower trend scores.
Move Statistics:
Gold (-21.8 percent) vs Gold previous week (-6.7 percent)
Silver (7.4 percent) vs Silver previous week (8.6 percent)
Copper (-3.4 percent) vs Copper previous week (6.7 percent)
Platinum (-1.8 percent) vs Platinum previous week (1.5 percent)
Palladium (-3.6 percent) vs Palladium previous week (1.5 percent)
Steel (22.5 percent) vs Steel previous week (28.1 percent)
Individual Markets:
Gold Comex Futures:
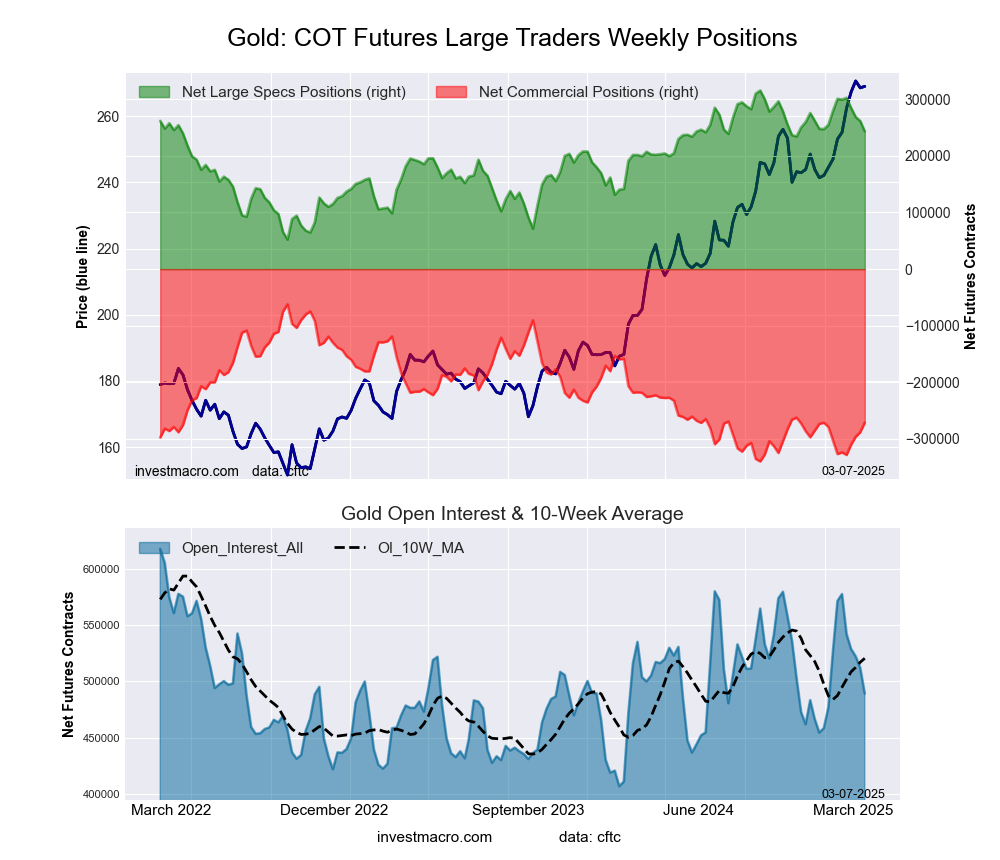 The Gold Comex Futures large speculator standing this week resulted in a net position of 243,261 contracts in the data reported through Tuesday. This was a weekly decrease of -18,364 contracts from the previous week which had a total of 261,625 net contracts.
This week’s current strength score (the trader positioning range over the past three years, measured from 0 to 100) shows the speculators are currently Bullish with a score of 72.6 percent. The commercials are Bearish with a score of 24.7 percent and the small traders (not shown in chart) are Bullish with a score of 71.5 percent.
Price Trend-Following Model: Strong Uptrend
Our weekly trend-following model classifies the current market price position as: Strong Uptrend.
| Gold Futures Statistics | SPECULATORS | COMMERCIALS | SMALL TRADERS |
| – Percent of Open Interest Longs: | 62.0 | 13.4 | 10.1 |
| – Percent of Open Interest Shorts: | 12.2 | 68.8 | 4.4 |
| – Net Position: | 243,261 | -271,115 | 27,854 |
| – Gross Longs: | 303,132 | 65,713 | 49,602 |
| – Gross Shorts: | 59,871 | 336,828 | 21,748 |
| – Long to Short Ratio: | 5.1 to 1 | 0.2 to 1 | 2.3 to 1 |
| NET POSITION TREND: | |||
| – Strength Index Score (3 Year Range Pct): | 72.6 | 24.7 | 71.5 |
| – Strength Index Reading (3 Year Range): | Bullish | Bearish | Bullish |
| NET POSITION MOVEMENT INDEX: | |||
| – 6-Week Change in Strength Index: | -21.8 | 20.0 | 7.3 |
Silver Comex Futures:
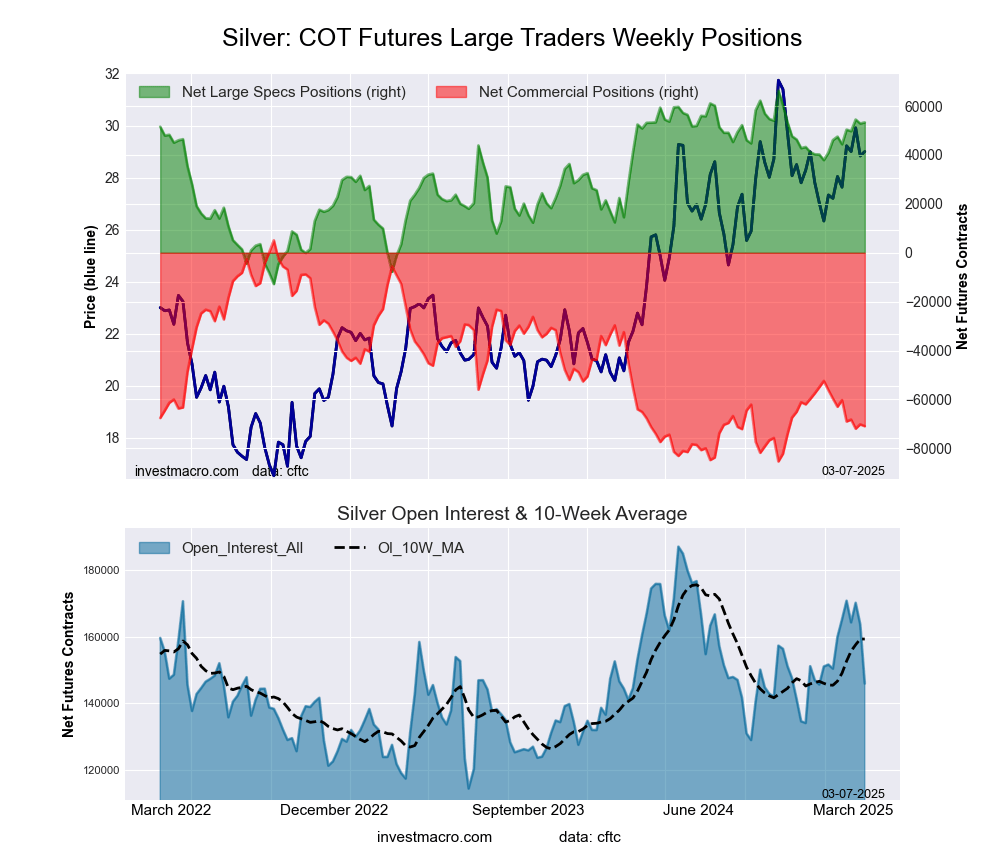 The Silver Comex Futures large speculator standing this week resulted in a net position of 53,316 contracts in the data reported through Tuesday. This was a weekly advance of 454 contracts from the previous week which had a total of 52,862 net contracts.
This week’s current strength score (the trader positioning range over the past three years, measured from 0 to 100) shows the speculators are currently Bullish-Extreme with a score of 83.5 percent. The commercials are Bearish-Extreme with a score of 15.9 percent and the small traders (not shown in chart) are Bullish with a score of 56.0 percent.
Price Trend-Following Model: Uptrend
Our weekly trend-following model classifies the current market price position as: Uptrend.
| Silver Futures Statistics | SPECULATORS | COMMERCIALS | SMALL TRADERS |
| – Percent of Open Interest Longs: | 50.2 | 21.2 | 19.3 |
| – Percent of Open Interest Shorts: | 13.7 | 69.8 | 7.2 |
| – Net Position: | 53,316 | -70,944 | 17,628 |
| – Gross Longs: | 73,315 | 30,890 | 28,190 |
| – Gross Shorts: | 19,999 | 101,834 | 10,562 |
| – Long to Short Ratio: | 3.7 to 1 | 0.3 to 1 | 2.7 to 1 |
| NET POSITION TREND: | |||
| – Strength Index Score (3 Year Range Pct): | 83.5 | 15.9 | 56.0 |
| – Strength Index Reading (3 Year Range): | Bullish-Extreme | Bearish-Extreme | Bullish |
| NET POSITION MOVEMENT INDEX: | |||
| – 6-Week Change in Strength Index: | 7.4 | -8.8 | 10.3 |
Copper Grade #1 Futures:
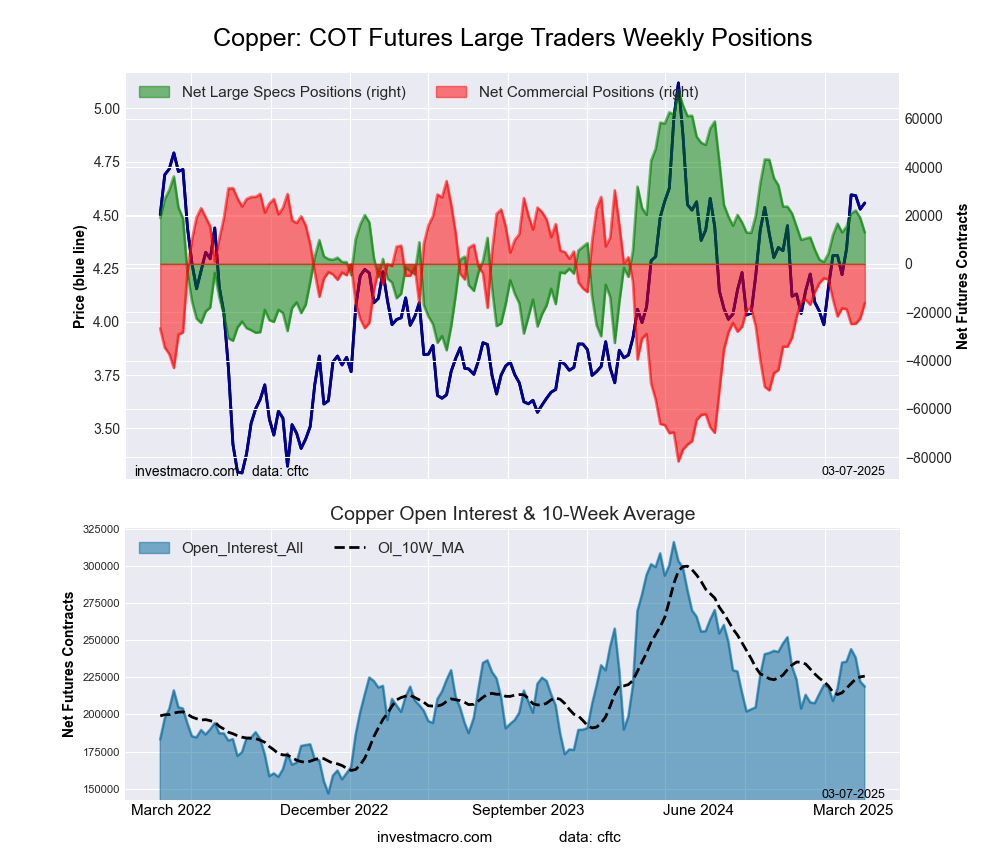 The Copper Grade #1 Futures large speculator standing this week resulted in a net position of 13,012 contracts in the data reported through Tuesday. This was a weekly decline of -6,010 contracts from the previous week which had a total of 19,022 net contracts.
This week’s current strength score (the trader positioning range over the past three years, measured from 0 to 100) shows the speculators are currently Bearish with a score of 45.4 percent. The commercials are Bullish with a score of 56.5 percent and the small traders (not shown in chart) are Bearish with a score of 37.0 percent.
Price Trend-Following Model: Strong Uptrend
Our weekly trend-following model classifies the current market price position as: Strong Uptrend.
| Copper Futures Statistics | SPECULATORS | COMMERCIALS | SMALL TRADERS |
| – Percent of Open Interest Longs: | 40.7 | 32.1 | 7.7 |
| – Percent of Open Interest Shorts: | 34.7 | 39.5 | 6.2 |
| – Net Position: | 13,012 | -16,189 | 3,177 |
| – Gross Longs: | 88,987 | 70,271 | 16,778 |
| – Gross Shorts: | 75,975 | 86,460 | 13,601 |
| – Long to Short Ratio: | 1.2 to 1 | 0.8 to 1 | 1.2 to 1 |
| NET POSITION TREND: | |||
| – Strength Index Score (3 Year Range Pct): | 45.4 | 56.5 | 37.0 |
| – Strength Index Reading (3 Year Range): | Bearish | Bullish | Bearish |
| NET POSITION MOVEMENT INDEX: | |||
| – 6-Week Change in Strength Index: | -3.4 | 4.8 | -11.4 |
Platinum Futures:
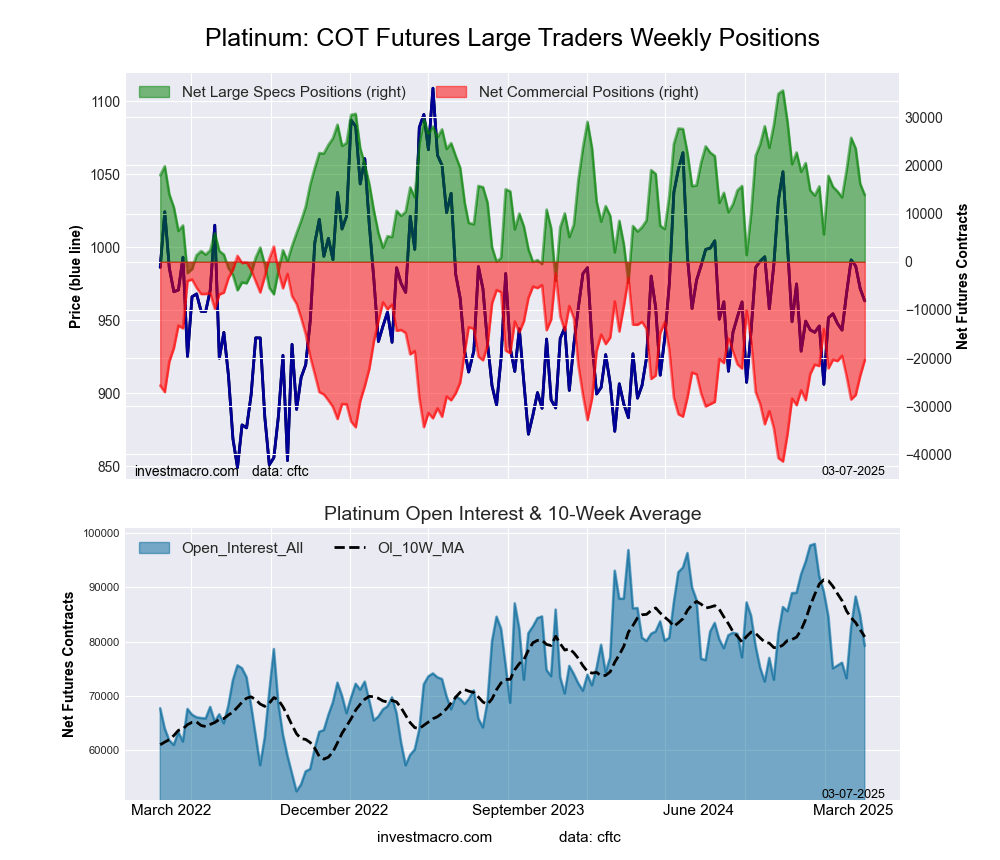 The Platinum Futures large speculator standing this week resulted in a net position of 13,852 contracts in the data reported through Tuesday. This was a weekly decrease of -2,324 contracts from the previous week which had a total of 16,176 net contracts.
This week’s current strength score (the trader positioning range over the past three years, measured from 0 to 100) shows the speculators are currently Bearish with a score of 48.7 percent. The commercials are Bearish with a score of 47.2 percent and the small traders (not shown in chart) are Bullish with a score of 65.5 percent.
Price Trend-Following Model: Weak Downtrend
Our weekly trend-following model classifies the current market price position as: Weak Downtrend.
| Platinum Futures Statistics | SPECULATORS | COMMERCIALS | SMALL TRADERS |
| – Percent of Open Interest Longs: | 60.8 | 20.9 | 12.9 |
| – Percent of Open Interest Shorts: | 43.3 | 46.6 | 4.6 |
| – Net Position: | 13,852 | -20,401 | 6,549 |
| – Gross Longs: | 48,163 | 16,532 | 10,229 |
| – Gross Shorts: | 34,311 | 36,933 | 3,680 |
| – Long to Short Ratio: | 1.4 to 1 | 0.4 to 1 | 2.8 to 1 |
| NET POSITION TREND: | |||
| – Strength Index Score (3 Year Range Pct): | 48.7 | 47.2 | 65.5 |
| – Strength Index Reading (3 Year Range): | Bearish | Bearish | Bullish |
| NET POSITION MOVEMENT INDEX: | |||
| – 6-Week Change in Strength Index: | -1.8 | 0.5 | 8.6 |
Palladium Futures:
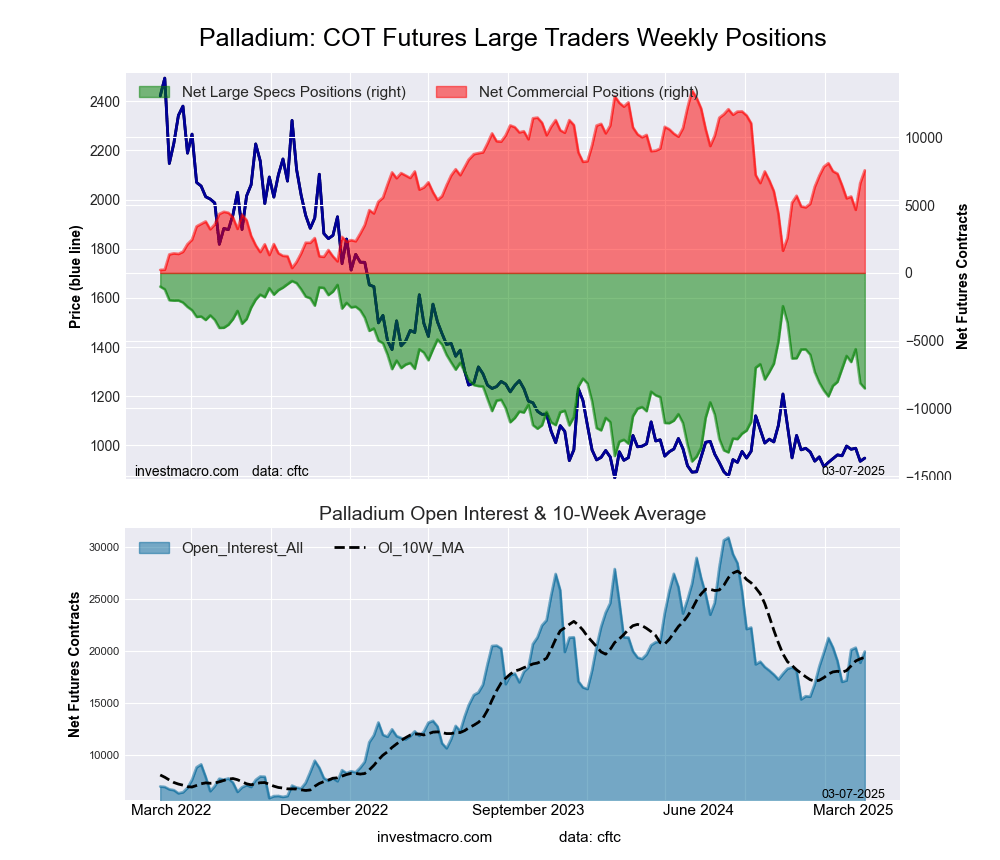 The Palladium Futures large speculator standing this week resulted in a net position of -8,519 contracts in the data reported through Tuesday. This was a weekly decline of -385 contracts from the previous week which had a total of -8,134 net contracts.
This week’s current strength score (the trader positioning range over the past three years, measured from 0 to 100) shows the speculators are currently Bearish with a score of 40.5 percent. The commercials are Bullish with a score of 55.5 percent and the small traders (not shown in chart) are Bullish with a score of 74.3 percent.
Price Trend-Following Model: Downtrend
Our weekly trend-following model classifies the current market price position as: Downtrend.
| Palladium Futures Statistics | SPECULATORS | COMMERCIALS | SMALL TRADERS |
| – Percent of Open Interest Longs: | 40.0 | 45.0 | 12.7 |
| – Percent of Open Interest Shorts: | 82.8 | 7.0 | 7.9 |
| – Net Position: | -8,519 | 7,573 | 946 |
| – Gross Longs: | 7,984 | 8,966 | 2,523 |
| – Gross Shorts: | 16,503 | 1,393 | 1,577 |
| – Long to Short Ratio: | 0.5 to 1 | 6.4 to 1 | 1.6 to 1 |
| NET POSITION TREND: | |||
| – Strength Index Score (3 Year Range Pct): | 40.5 | 55.5 | 74.3 |
| – Strength Index Reading (3 Year Range): | Bearish | Bullish | Bullish |
| NET POSITION MOVEMENT INDEX: | |||
| – 6-Week Change in Strength Index: | -3.6 | 1.9 | 10.7 |
Steel Futures Futures:
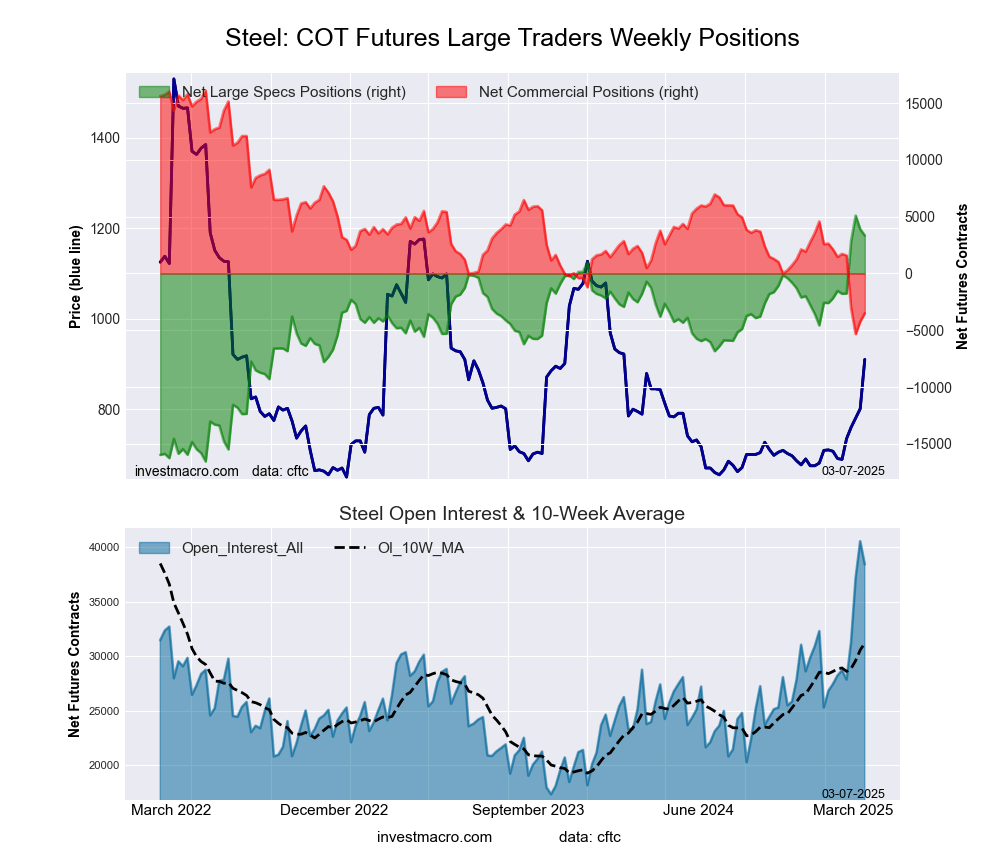 The Steel Futures large speculator standing this week resulted in a net position of 3,340 contracts in the data reported through Tuesday. This was a weekly reduction of -557 contracts from the previous week which had a total of 3,897 net contracts.
This week’s current strength score (the trader positioning range over the past three years, measured from 0 to 100) shows the speculators are currently Bullish-Extreme with a score of 91.9 percent. The commercials are Bearish-Extreme with a score of 8.6 percent and the small traders (not shown in chart) are Bearish with a score of 49.9 percent.
Price Trend-Following Model: Strong Uptrend
Our weekly trend-following model classifies the current market price position as: Strong Uptrend.
| Steel Futures Statistics | SPECULATORS | COMMERCIALS | SMALL TRADERS |
| – Percent of Open Interest Longs: | 33.9 | 58.0 | 1.0 |
| – Percent of Open Interest Shorts: | 25.2 | 67.1 | 0.6 |
| – Net Position: | 3,340 | -3,500 | 160 |
| – Gross Longs: | 13,014 | 22,292 | 380 |
| – Gross Shorts: | 9,674 | 25,792 | 220 |
| – Long to Short Ratio: | 1.3 to 1 | 0.9 to 1 | 1.7 to 1 |
| NET POSITION TREND: | |||
| – Strength Index Score (3 Year Range Pct): | 91.9 | 8.6 | 49.9 |
| – Strength Index Reading (3 Year Range): | Bullish-Extreme | Bearish-Extreme | Bearish |
| NET POSITION MOVEMENT INDEX: | |||
| – 6-Week Change in Strength Index: | 22.5 | -23.1 | 9.1 |
Article By InvestMacro – Receive our weekly COT Newsletter
*COT Report: The COT data, released weekly to the public each Friday, is updated through the most recent Tuesday (data is 3 days old) and shows a quick view of how large speculators or non-commercials (for-profit traders) were positioned in the futures markets.
The CFTC categorizes trader positions according to commercial hedgers (traders who use futures contracts for hedging as part of the business), non-commercials (large traders who speculate to realize trading profits) and nonreportable traders (usually small traders/speculators) as well as their open interest (contracts open in the market at time of reporting). See CFTC criteria here.

- Oil prices have fallen to pre‑war levels. AI companies continue to sell off Jul 3, 2026
- Gold Rises Sharply as Markets Reassess Fed Rate Outlook Jul 3, 2026
- The Eurozone has shown a significant slowdown in inflation. Australia has recorded its largest trade deficit since 2015 Jul 2, 2026
- Natural gas prices are rising amid increasing electricity consumption Jul 1, 2026
- USD/JPY at 40-Year High: Multiple Factors Weigh on the Yen Jul 1, 2026
- Gold Declines: Fed Policy and Geopolitics Weigh Jun 30, 2026
- Oil prices have once again risen above 70 dollars per barrel. The Australian dollar has updated a three‑month low Jun 30, 2026
- EUR/USD: The Advantage Remains with the Dollar Jun 29, 2026
- Escalation of the US–Iran conflict is once again supporting the rise in oil prices Jun 29, 2026
- Oil prices fall back to pre‑war levels. Silver drops to a 7‑month low Jun 25, 2026