
By InvestMacro
Here are the latest charts and statistics for the Commitment of Traders (COT) data published by the Commodities Futures Trading Commission (CFTC).
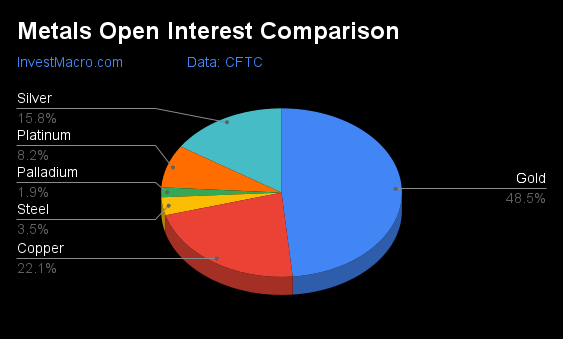
The latest COT data is updated through Tuesday February 18th and shows a quick view of how large traders (for-profit speculators and commercial entities) were positioned in the futures markets.
Weekly Speculator Changes led by Copper, Silver & Steel
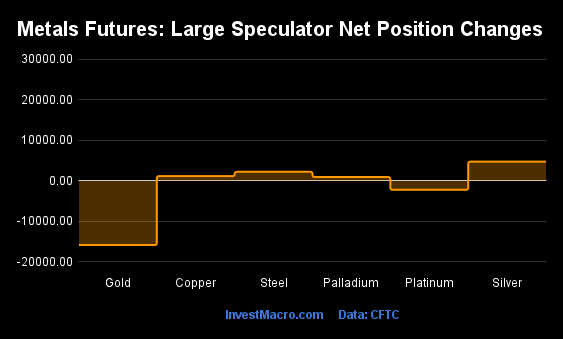
The COT metals markets speculator bets were higher this week as four out of the six metals markets we cover had higher positioning while the other two markets had lower speculator contracts.
Free Reports:
 Sign Up for Our Stock Market Newsletter – Get updated on News, Charts & Rankings of Public Companies when you join our Stocks Newsletter
 Get our Weekly Commitment of Traders Reports - See where the biggest traders (Hedge Funds and Commercial Hedgers) are positioned in the futures markets on a weekly basis.
Leading the gains for the metals was Copper (5,475 contracts) with Silver (4,744 contracts), Steel (4,618 contracts) and Palladium (943 contracts) also showing positive weeks.
The two markets with declines in speculator bets for the week were Gold (-15,830 contracts) and with Platinum (-2,193 contracts) also having lower bets on the week.
Metals Net Speculators Leaderboard
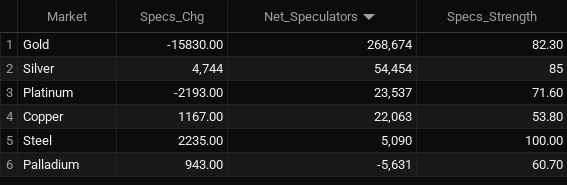
Legend: Weekly Speculators Change | Speculators Current Net Position | Speculators Strength Score compared to last 3-Years (0-100 range)
Strength Scores led by Steel & Silver
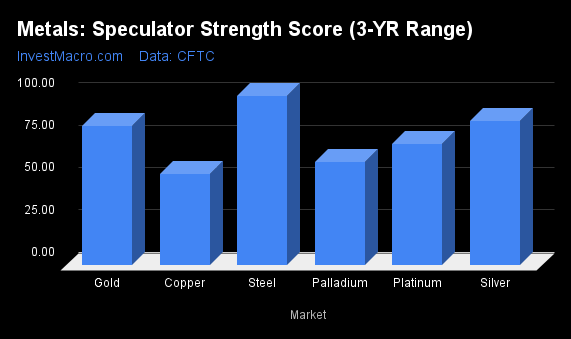
COT Strength Scores (a normalized measure of Speculator positions over a 3-Year range, from 0 to 100 where above 80 is Extreme-Bullish and below 20 is Extreme-Bearish) showed that Steel (90 percent) and Silver (85 percent) lead the metals markets this week. Gold (82 percent) comes in as the next highest in the weekly strength scores.
On the downside, Palladium (61 percent) comes in at the lowest strength level currently but is over the 50-percent or the midpoint level for the past 3-years.
Strength Statistics:
Gold (82.3 percent) vs Gold previous week (88.3 percent)
Silver (85.0 percent) vs Silver previous week (79.0 percent)
Copper (52.7 percent) vs Copper previous week (47.6 percent)
Platinum (71.6 percent) vs Platinum previous week (76.8 percent)
Palladium (60.7 percent) vs Palladium previous week (53.8 percent)
Steel (89.8 percent) vs Palladium previous week (68.7 percent)
Palladium & Steel top the 6-Week Strength Trends
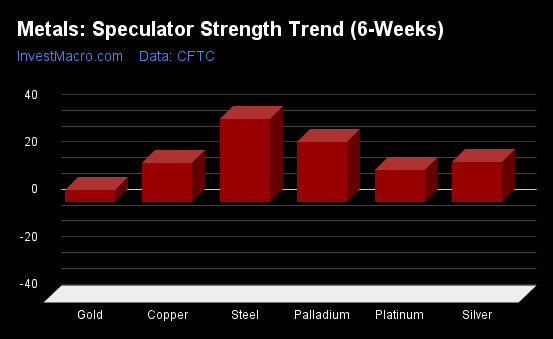
COT Strength Score Trends (or move index, calculates the 6-week changes in strength scores) showed that Palladium (26 percent) and Steel (25 percent) lead the past six weeks trends for metals.
There were no markets this week with negative trend scores.
Move Statistics:
Gold (5.2 percent) vs Gold previous week (14.1 percent)
Silver (17.1 percent) vs Silver previous week (14.9 percent)
Copper (18.8 percent) vs Copper previous week (12.7 percent)
Platinum (13.5 percent) vs Platinum previous week (47.5 percent)
Palladium (25.5 percent) vs Palladium previous week (15.4 percent)
Steel (24.8 percent) vs Steel previous week (12.8 percent)
Individual Markets:
Gold Comex Futures:
 The Gold Comex Futures large speculator standing this week totaled a net position of 268,674 contracts in the data reported through Tuesday. This was a weekly fall of -15,830 contracts from the previous week which had a total of 284,504 net contracts.
This week’s current strength score (the trader positioning range over the past three years, measured from 0 to 100) shows the speculators are currently Bullish-Extreme with a score of 82.3 percent. The commercials are Bearish-Extreme with a score of 15.7 percent and the small traders (not shown in chart) are Bullish with a score of 69.8 percent.
Price Trend-Following Model: Strong Uptrend
Our weekly trend-following model classifies the current market price position as: Strong Uptrend.
| Gold Futures Statistics | SPECULATORS | COMMERCIALS | SMALL TRADERS |
| – Percent of Open Interest Longs: | 64.0 | 13.9 | 9.7 |
| – Percent of Open Interest Shorts: | 12.5 | 70.5 | 4.5 |
| – Net Position: | 268,674 | -296,071 | 27,397 |
| – Gross Longs: | 334,043 | 72,393 | 50,882 |
| – Gross Shorts: | 65,369 | 368,464 | 23,485 |
| – Long to Short Ratio: | 5.1 to 1 | 0.2 to 1 | 2.2 to 1 |
| NET POSITION TREND: | |||
| – Strength Index Score (3 Year Range Pct): | 82.3 | 15.7 | 69.8 |
| – Strength Index Reading (3 Year Range): | Bullish-Extreme | Bearish-Extreme | Bullish |
| NET POSITION MOVEMENT INDEX: | |||
| – 6-Week Change in Strength Index: | 5.2 | -6.3 | 13.2 |
Silver Comex Futures:
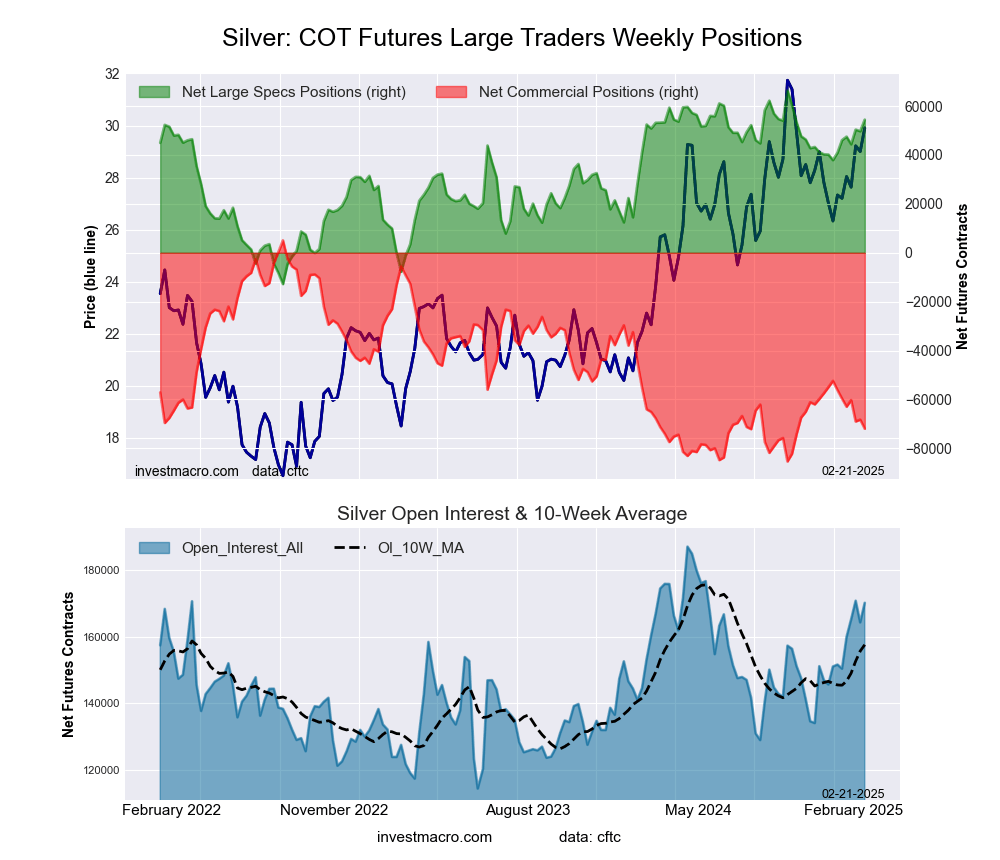 The Silver Comex Futures large speculator standing this week totaled a net position of 54,454 contracts in the data reported through Tuesday. This was a weekly boost of 4,744 contracts from the previous week which had a total of 49,710 net contracts.
This week’s current strength score (the trader positioning range over the past three years, measured from 0 to 100) shows the speculators are currently Bullish-Extreme with a score of 85.0 percent. The commercials are Bearish-Extreme with a score of 14.8 percent and the small traders (not shown in chart) are Bullish with a score of 55.4 percent.
Price Trend-Following Model: Uptrend
Our weekly trend-following model classifies the current market price position as: Uptrend.
| Silver Futures Statistics | SPECULATORS | COMMERCIALS | SMALL TRADERS |
| – Percent of Open Interest Longs: | 49.9 | 20.7 | 18.3 |
| – Percent of Open Interest Shorts: | 17.8 | 63.0 | 8.0 |
| – Net Position: | 54,454 | -71,960 | 17,506 |
| – Gross Longs: | 84,814 | 35,237 | 31,187 |
| – Gross Shorts: | 30,360 | 107,197 | 13,681 |
| – Long to Short Ratio: | 2.8 to 1 | 0.3 to 1 | 2.3 to 1 |
| NET POSITION TREND: | |||
| – Strength Index Score (3 Year Range Pct): | 85.0 | 14.8 | 55.4 |
| – Strength Index Reading (3 Year Range): | Bullish-Extreme | Bearish-Extreme | Bullish |
| NET POSITION MOVEMENT INDEX: | |||
| – 6-Week Change in Strength Index: | 17.1 | -17.5 | 11.1 |
Copper Grade #1 Futures:
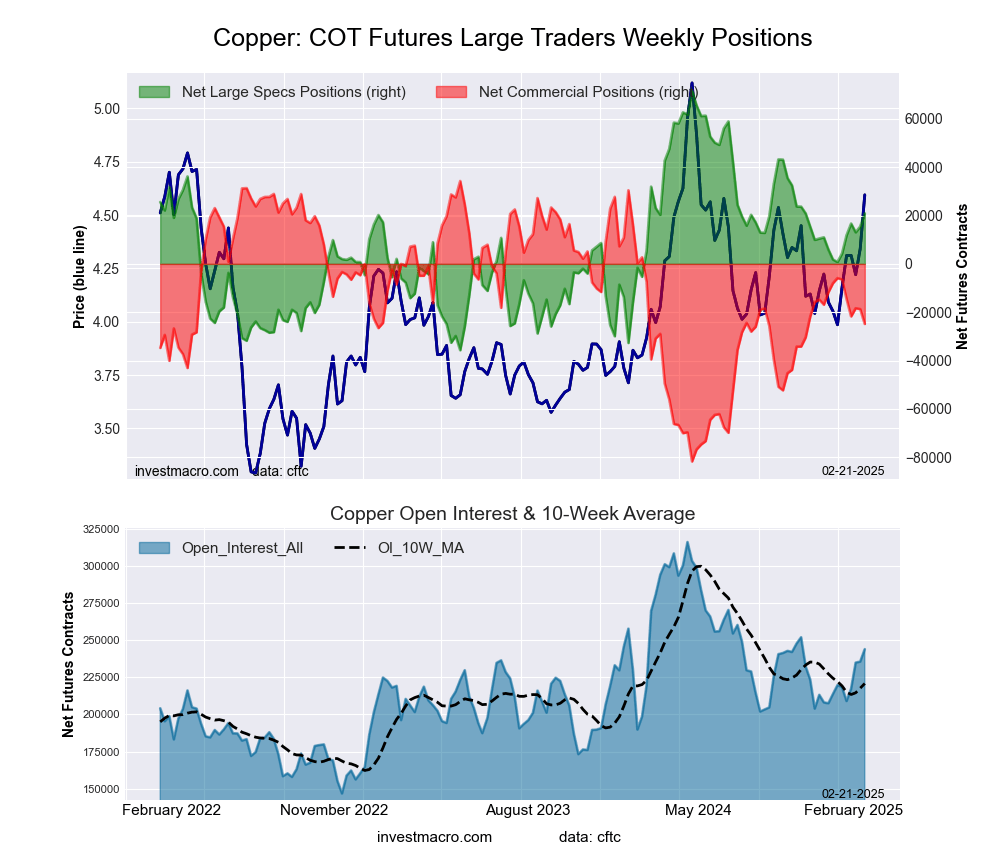 The Copper Grade #1 Futures large speculator standing this week totaled a net position of 20,896 contracts in the data reported through Tuesday. This was a weekly increase of 5,475 contracts from the previous week which had a total of 15,421 net contracts.
This week’s current strength score (the trader positioning range over the past three years, measured from 0 to 100) shows the speculators are currently Bullish with a score of 52.7 percent. The commercials are Bearish with a score of 49.0 percent and the small traders (not shown in chart) are Bearish with a score of 41.6 percent.
Price Trend-Following Model: Strong Uptrend
Our weekly trend-following model classifies the current market price position as: Strong Uptrend.
| Copper Futures Statistics | SPECULATORS | COMMERCIALS | SMALL TRADERS |
| – Percent of Open Interest Longs: | 42.6 | 30.8 | 7.3 |
| – Percent of Open Interest Shorts: | 34.1 | 41.0 | 5.7 |
| – Net Position: | 20,896 | -24,842 | 3,946 |
| – Gross Longs: | 104,032 | 75,169 | 17,858 |
| – Gross Shorts: | 83,136 | 100,011 | 13,912 |
| – Long to Short Ratio: | 1.3 to 1 | 0.8 to 1 | 1.3 to 1 |
| NET POSITION TREND: | |||
| – Strength Index Score (3 Year Range Pct): | 52.7 | 49.0 | 41.6 |
| – Strength Index Reading (3 Year Range): | Bullish | Bearish | Bearish |
| NET POSITION MOVEMENT INDEX: | |||
| – 6-Week Change in Strength Index: | 18.8 | -16.3 | -7.2 |
Platinum Futures:
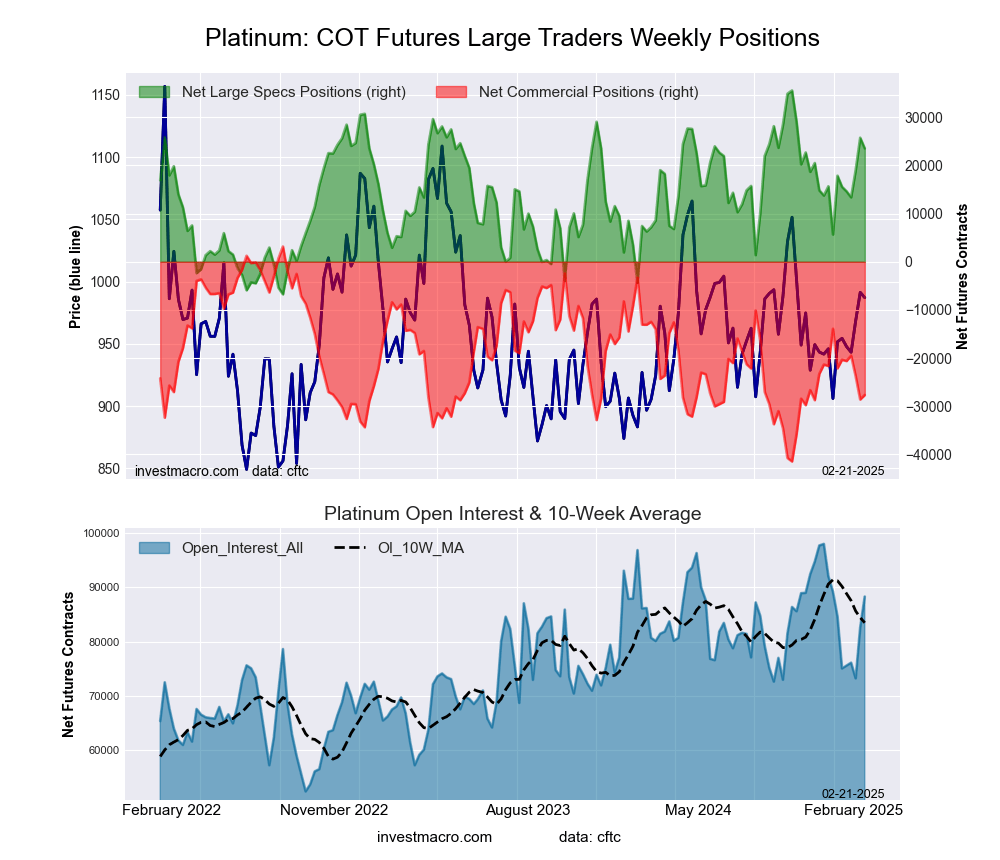 The Platinum Futures large speculator standing this week totaled a net position of 23,537 contracts in the data reported through Tuesday. This was a weekly reduction of -2,193 contracts from the previous week which had a total of 25,730 net contracts.
This week’s current strength score (the trader positioning range over the past three years, measured from 0 to 100) shows the speculators are currently Bullish with a score of 71.6 percent. The commercials are Bearish with a score of 30.9 percent and the small traders (not shown in chart) are Bearish with a score of 27.5 percent.
Price Trend-Following Model: Weak Downtrend
Our weekly trend-following model classifies the current market price position as: Weak Downtrend.
| Platinum Futures Statistics | SPECULATORS | COMMERCIALS | SMALL TRADERS |
| – Percent of Open Interest Longs: | 66.6 | 16.1 | 10.6 |
| – Percent of Open Interest Shorts: | 40.0 | 47.4 | 5.9 |
| – Net Position: | 23,537 | -27,658 | 4,121 |
| – Gross Longs: | 58,829 | 14,208 | 9,361 |
| – Gross Shorts: | 35,292 | 41,866 | 5,240 |
| – Long to Short Ratio: | 1.7 to 1 | 0.3 to 1 | 1.8 to 1 |
| NET POSITION TREND: | |||
| – Strength Index Score (3 Year Range Pct): | 71.6 | 30.9 | 27.5 |
| – Strength Index Reading (3 Year Range): | Bullish | Bearish | Bearish |
| NET POSITION MOVEMENT INDEX: | |||
| – 6-Week Change in Strength Index: | 13.5 | -12.4 | -2.4 |
Palladium Futures:
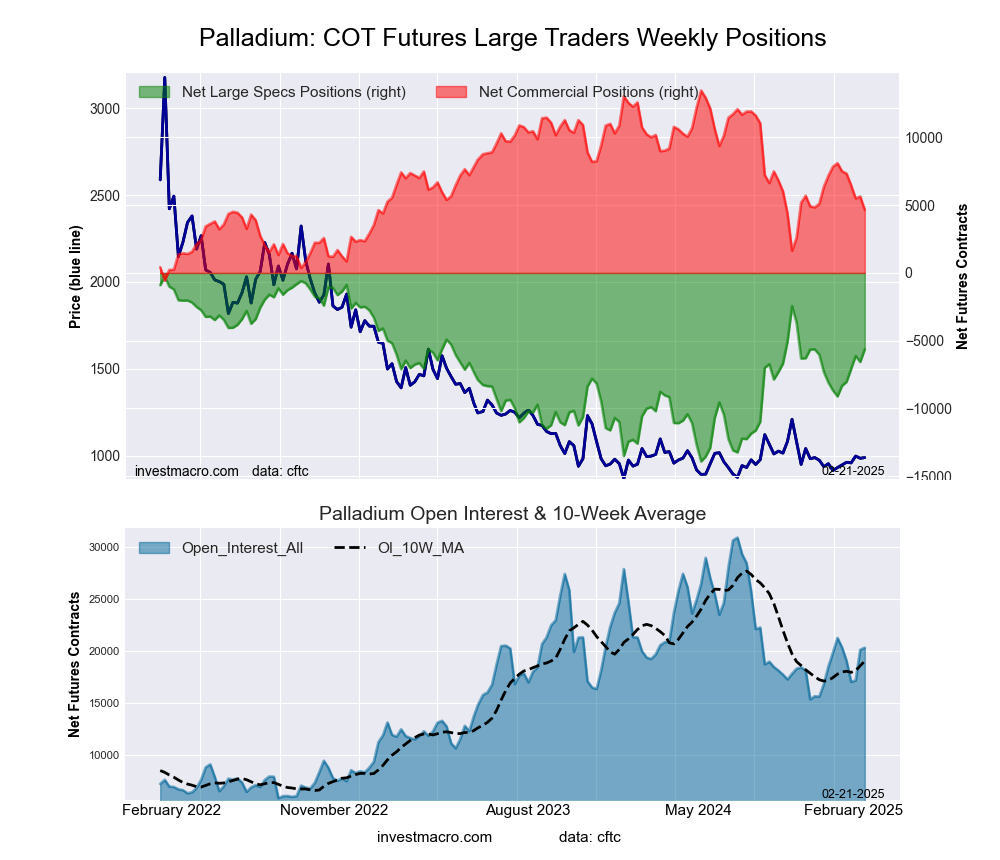 The Palladium Futures large speculator standing this week totaled a net position of -5,631 contracts in the data reported through Tuesday. This was a weekly advance of 943 contracts from the previous week which had a total of -6,574 net contracts.
This week’s current strength score (the trader positioning range over the past three years, measured from 0 to 100) shows the speculators are currently Bullish with a score of 60.7 percent. The commercials are Bearish with a score of 37.2 percent and the small traders (not shown in chart) are Bullish-Extreme with a score of 80.5 percent.
Price Trend-Following Model: Downtrend
Our weekly trend-following model classifies the current market price position as: Downtrend.
| Palladium Futures Statistics | SPECULATORS | COMMERCIALS | SMALL TRADERS |
| – Percent of Open Interest Longs: | 34.6 | 39.0 | 11.5 |
| – Percent of Open Interest Shorts: | 62.3 | 16.1 | 6.7 |
| – Net Position: | -5,631 | 4,658 | 973 |
| – Gross Longs: | 7,021 | 7,922 | 2,330 |
| – Gross Shorts: | 12,652 | 3,264 | 1,357 |
| – Long to Short Ratio: | 0.6 to 1 | 2.4 to 1 | 1.7 to 1 |
| NET POSITION TREND: | |||
| – Strength Index Score (3 Year Range Pct): | 60.7 | 37.2 | 80.5 |
| – Strength Index Reading (3 Year Range): | Bullish | Bearish | Bullish-Extreme |
| NET POSITION MOVEMENT INDEX: | |||
| – 6-Week Change in Strength Index: | 25.5 | -24.5 | -1.9 |
Steel Futures Futures:
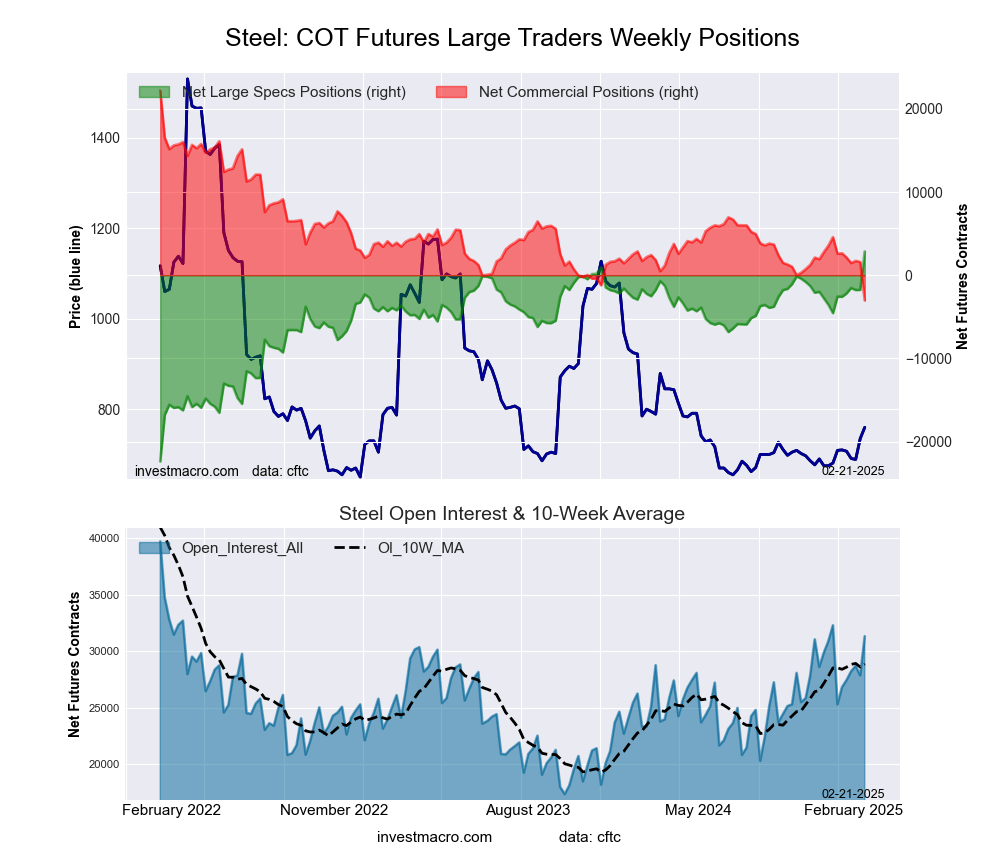 The Steel Futures large speculator standing this week totaled a net position of 2,855 contracts in the data reported through Tuesday. This was a weekly rise of 4,618 contracts from the previous week which had a total of -1,763 net contracts.
This week’s current strength score (the trader positioning range over the past three years, measured from 0 to 100) shows the speculators are currently Bullish-Extreme with a score of 89.8 percent. The commercials are Bearish-Extreme with a score of 10.5 percent and the small traders (not shown in chart) are Bullish with a score of 52.0 percent.
Price Trend-Following Model: Strong Uptrend
Our weekly trend-following model classifies the current market price position as: Strong Uptrend.
| Steel Futures Statistics | SPECULATORS | COMMERCIALS | SMALL TRADERS |
| – Percent of Open Interest Longs: | 30.7 | 58.7 | 1.1 |
| – Percent of Open Interest Shorts: | 21.6 | 68.3 | 0.5 |
| – Net Position: | 2,855 | -3,034 | 179 |
| – Gross Longs: | 9,630 | 18,379 | 348 |
| – Gross Shorts: | 6,775 | 21,413 | 169 |
| – Long to Short Ratio: | 1.4 to 1 | 0.9 to 1 | 2.1 to 1 |
| NET POSITION TREND: | |||
| – Strength Index Score (3 Year Range Pct): | 89.8 | 10.5 | 52.0 |
| – Strength Index Reading (3 Year Range): | Bullish-Extreme | Bearish-Extreme | Bullish |
| NET POSITION MOVEMENT INDEX: | |||
| – 6-Week Change in Strength Index: | 24.8 | -25.7 | 19.9 |
Article By InvestMacro – Receive our weekly COT Newsletter
*COT Report: The COT data, released weekly to the public each Friday, is updated through the most recent Tuesday (data is 3 days old) and shows a quick view of how large speculators or non-commercials (for-profit traders) were positioned in the futures markets.
The CFTC categorizes trader positions according to commercial hedgers (traders who use futures contracts for hedging as part of the business), non-commercials (large traders who speculate to realize trading profits) and nonreportable traders (usually small traders/speculators) as well as their open interest (contracts open in the market at time of reporting). See CFTC criteria here.

- Gold Falls for the Third Consecutive Week: Is There Still Upside Potential? Jun 22, 2026
- Bank Indonesia raised its interest rate. Norges Bank and the SNB left rates unchanged Jun 19, 2026
- EUR/USD Loses Ground as Market Sentiment Favours the US Dollar Jun 19, 2026
- GBPUSD Awaits Bank of England Meeting Near April Lows Jun 18, 2026
- Markets disliked the results of the FOMC meeting. HKMA followed the Fed and kept its rate unchanged. Jun 18, 2026
- Gold Surges 2% Since Week Opening Amid Geopolitical Shifts and Fed Expectations Jun 17, 2026
- Your Bourse and FXPRIMUS Bring 24/7 Synthetic Indices to the Global Broker Market Jun 16, 2026
- Institutional investors continue to reduce their presence in metals Jun 16, 2026
- USDJPY Driven by Emotions: Bank of Japan Raises Rate to Highest Level Since 1995 Jun 16, 2026
- The United States and Iran have signed a peace agreement – oil has fallen to 80 dollars per barrel. Jun 15, 2026