
By InvestMacro | COT | Data Tables | COT Leaders | Downloads | COT Newsletter
Here are the latest charts and statistics for the Commitment of Traders (COT) data published by the Commodities Futures Trading Commission (CFTC).
The latest COT data is updated through Tuesday May 10th and shows a quick view of how large traders (for-profit speculators and commercial entities) were positioned in the futures markets.
Soft commodities speculator bets cooled off this week with nine out of the eleven markets we cover showing a decrease in their positioning. Soft commodities markets have been red hot this year with the war in Ukraine causing food disruptions, general production problems, food protectionism and, of course, with inflation rising throughout the world.
Overall, the soft commodities that saw higher bets this week were just Soybean Oil (3,305 contracts) and Wheat (1,674 contracts).
Meanwhile, the soft commodities that saw lower speculator bets on the week were Corn (-30,957 contracts), Sugar (-14,407 contracts), Coffee (-8,142 contracts), Soybeans (-15,794 contracts), Soybean Meal (-15,429 contracts), Live Cattle (-7,233 contracts), Lean Hogs (-5,671 contracts), Cotton (-1,674 contracts) and Cocoa (-15,513 contracts).
Free Reports:
 Sign Up for Our Stock Market Newsletter – Get updated on News, Charts & Rankings of Public Companies when you join our Stocks Newsletter
 Get our Weekly Commitment of Traders Reports - See where the biggest traders (Hedge Funds and Commercial Hedgers) are positioned in the futures markets on a weekly basis.
| May-10-2022 | OI | OI-Index | Spec-Net | Spec-Index | Com-Net | COM-Index | Smalls-Net | Smalls-Index |
|---|---|---|---|---|---|---|---|---|
| WTI Crude | 1,736,594 | 0 | 310,803 | 2 | -354,479 | 98 | 43,676 | 77 |
| Gold | 571,447 | 34 | 193,315 | 40 | -227,756 | 57 | 34,441 | 57 |
| Silver | 142,752 | 9 | 19,082 | 41 | -30,519 | 69 | 11,437 | 9 |
| Copper | 184,502 | 15 | -22,626 | 26 | 19,249 | 73 | 3,377 | 45 |
| Palladium | 8,832 | 11 | -3,245 | 3 | 3,434 | 96 | -189 | 33 |
| Platinum | 66,064 | 32 | 1,363 | 5 | -5,373 | 98 | 4,010 | 18 |
| Natural Gas | 1,108,451 | 6 | -112,529 | 45 | 64,006 | 51 | 48,523 | 100 |
| Brent | 173,911 | 19 | -31,215 | 59 | 30,562 | 44 | 653 | 18 |
| Heating Oil | 349,618 | 31 | 6,455 | 52 | -32,434 | 37 | 25,979 | 88 |
| Soybeans | 694,454 | 20 | 174,608 | 72 | -147,698 | 33 | -26,910 | 26 |
| Corn | 1,510,783 | 23 | 470,908 | 90 | -415,345 | 13 | -55,563 | 11 |
| Coffee | 212,659 | 5 | 32,555 | 69 | -33,559 | 37 | 1,004 | 0 |
| Sugar | 797,453 | 0 | 187,185 | 75 | -220,611 | 26 | 33,426 | 49 |
| Wheat | 308,326 | 0 | 21,686 | 48 | -17,779 | 34 | -3,907 | 92 |
CORN Futures:
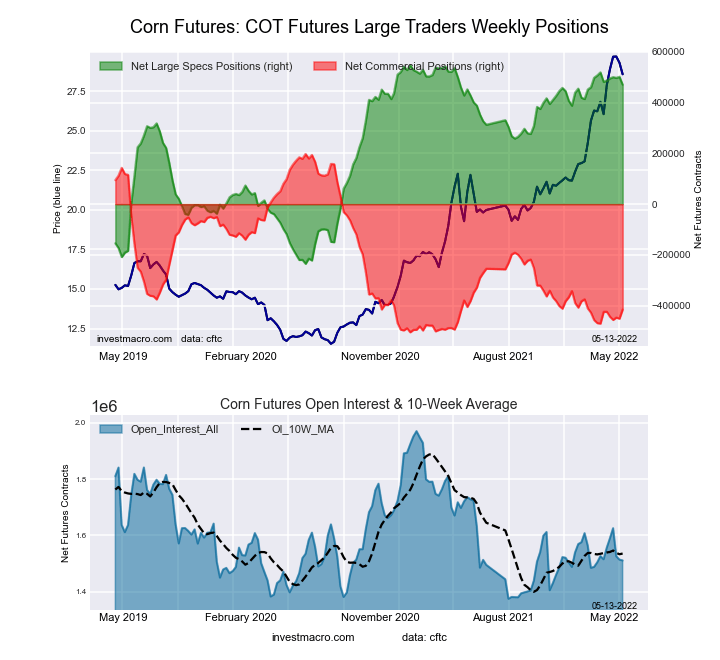 The CORN large speculator standing this week totaled a net position of 470,908 contracts in the data reported through Tuesday. This was a weekly reduction of -30,957 contracts from the previous week which had a total of 501,865 net contracts.
This week’s current strength score (the trader positioning range over the past three years, measured from 0 to 100) shows the speculators are currently Bullish-Extreme with a score of 90.2 percent. The commercials are Bearish-Extreme with a score of 12.8 percent and the small traders (not shown in chart) are Bearish-Extreme with a score of 11.1 percent.
| CORN Futures Statistics | SPECULATORS | COMMERCIALS | SMALL TRADERS |
| – Percent of Open Interest Longs: | 37.9 | 42.7 | 8.9 |
| – Percent of Open Interest Shorts: | 6.8 | 70.2 | 12.6 |
| – Net Position: | 470,908 | -415,345 | -55,563 |
| – Gross Longs: | 573,327 | 644,830 | 134,903 |
| – Gross Shorts: | 102,419 | 1,060,175 | 190,466 |
| – Long to Short Ratio: | 5.6 to 1 | 0.6 to 1 | 0.7 to 1 |
| NET POSITION TREND: | |||
| – Strength Index Score (3 Year Range Pct): | 90.2 | 12.8 | 11.1 |
| – Strength Index Reading (3 Year Range): | Bullish-Extreme | Bearish-Extreme | Bearish-Extreme |
| NET POSITION MOVEMENT INDEX: | |||
| – 6-Week Change in Strength Index: | -1.4 | 1.3 | 1.1 |
SUGAR Futures:
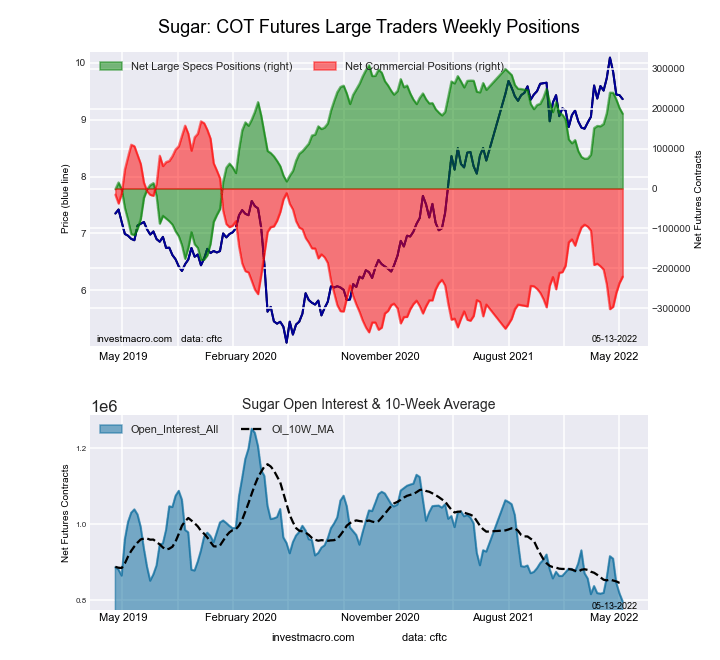 The SUGAR large speculator standing this week totaled a net position of 187,185 contracts in the data reported through Tuesday. This was a weekly lowering of -14,407 contracts from the previous week which had a total of 201,592 net contracts.
This week’s current strength score (the trader positioning range over the past three years, measured from 0 to 100) shows the speculators are currently Bullish with a score of 75.1 percent. The commercials are Bearish with a score of 26.3 percent and the small traders (not shown in chart) are Bearish with a score of 49.2 percent.
| SUGAR Futures Statistics | SPECULATORS | COMMERCIALS | SMALL TRADERS |
| – Percent of Open Interest Longs: | 31.5 | 45.8 | 10.8 |
| – Percent of Open Interest Shorts: | 8.0 | 73.5 | 6.6 |
| – Net Position: | 187,185 | -220,611 | 33,426 |
| – Gross Longs: | 251,330 | 365,263 | 86,129 |
| – Gross Shorts: | 64,145 | 585,874 | 52,703 |
| – Long to Short Ratio: | 3.9 to 1 | 0.6 to 1 | 1.6 to 1 |
| NET POSITION TREND: | |||
| – Strength Index Score (3 Year Range Pct): | 75.1 | 26.3 | 49.2 |
| – Strength Index Reading (3 Year Range): | Bullish | Bearish | Bearish |
| NET POSITION MOVEMENT INDEX: | |||
| – 6-Week Change in Strength Index: | 5.3 | -3.4 | -9.6 |
COFFEE Futures:
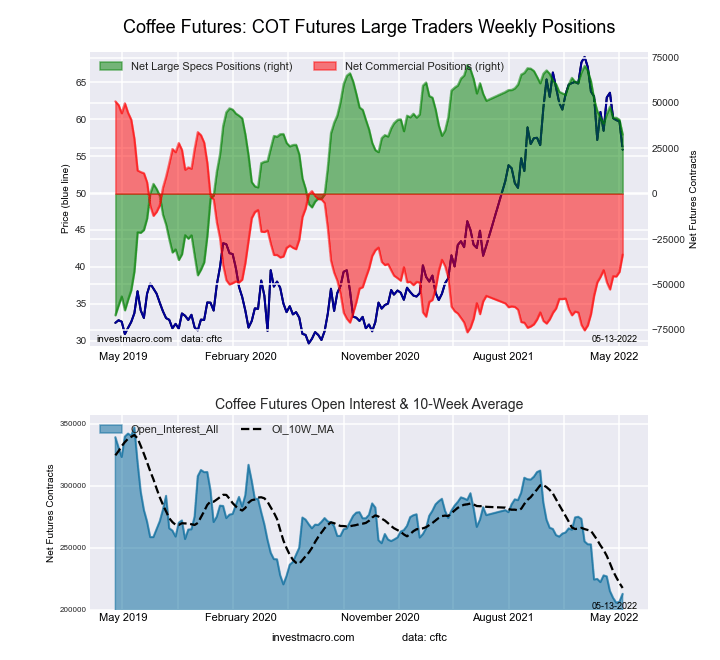 The COFFEE large speculator standing this week totaled a net position of 32,555 contracts in the data reported through Tuesday. This was a weekly decrease of -8,142 contracts from the previous week which had a total of 40,697 net contracts.
This week’s current strength score (the trader positioning range over the past three years, measured from 0 to 100) shows the speculators are currently Bullish with a score of 69.2 percent. The commercials are Bearish with a score of 36.5 percent and the small traders (not shown in chart) are Bearish-Extreme with a score of 0.0 percent.
| COFFEE Futures Statistics | SPECULATORS | COMMERCIALS | SMALL TRADERS |
| – Percent of Open Interest Longs: | 23.8 | 56.1 | 3.6 |
| – Percent of Open Interest Shorts: | 8.5 | 71.9 | 3.1 |
| – Net Position: | 32,555 | -33,559 | 1,004 |
| – Gross Longs: | 50,564 | 119,399 | 7,690 |
| – Gross Shorts: | 18,009 | 152,958 | 6,686 |
| – Long to Short Ratio: | 2.8 to 1 | 0.8 to 1 | 1.2 to 1 |
| NET POSITION TREND: | |||
| – Strength Index Score (3 Year Range Pct): | 69.2 | 36.5 | 0.0 |
| – Strength Index Reading (3 Year Range): | Bullish | Bearish | Bearish-Extreme |
| NET POSITION MOVEMENT INDEX: | |||
| – 6-Week Change in Strength Index: | -4.9 | 7.3 | -20.9 |
SOYBEANS Futures:
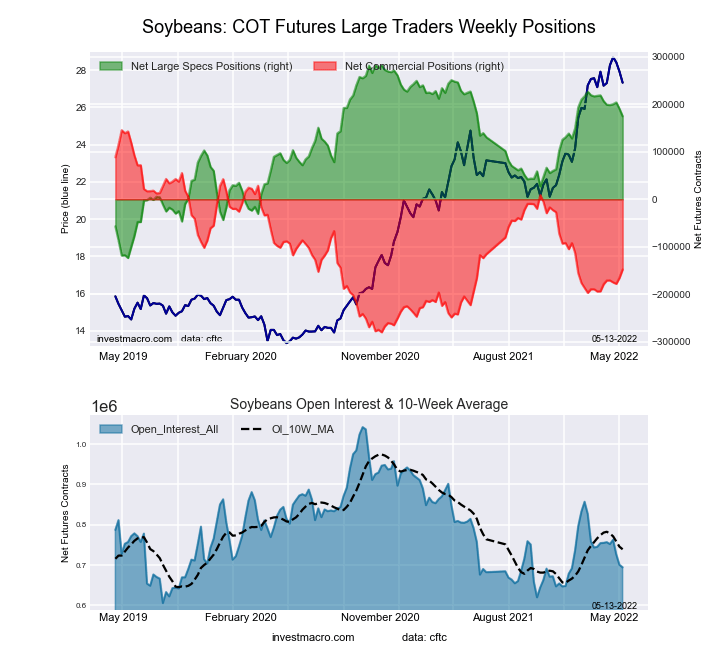 The SOYBEANS large speculator standing this week totaled a net position of 174,608 contracts in the data reported through Tuesday. This was a weekly fall of -15,794 contracts from the previous week which had a total of 190,402 net contracts.
This week’s current strength score (the trader positioning range over the past three years, measured from 0 to 100) shows the speculators are currently Bullish with a score of 71.9 percent. The commercials are Bearish with a score of 33.1 percent and the small traders (not shown in chart) are Bearish with a score of 25.6 percent.
| SOYBEANS Futures Statistics | SPECULATORS | COMMERCIALS | SMALL TRADERS |
| – Percent of Open Interest Longs: | 32.4 | 48.2 | 7.1 |
| – Percent of Open Interest Shorts: | 7.3 | 69.5 | 11.0 |
| – Net Position: | 174,608 | -147,698 | -26,910 |
| – Gross Longs: | 225,260 | 334,792 | 49,376 |
| – Gross Shorts: | 50,652 | 482,490 | 76,286 |
| – Long to Short Ratio: | 4.4 to 1 | 0.7 to 1 | 0.6 to 1 |
| NET POSITION TREND: | |||
| – Strength Index Score (3 Year Range Pct): | 71.9 | 33.1 | 25.6 |
| – Strength Index Reading (3 Year Range): | Bullish | Bearish | Bearish |
| NET POSITION MOVEMENT INDEX: | |||
| – 6-Week Change in Strength Index: | -8.3 | 7.8 | 1.3 |
SOYBEAN OIL Futures:
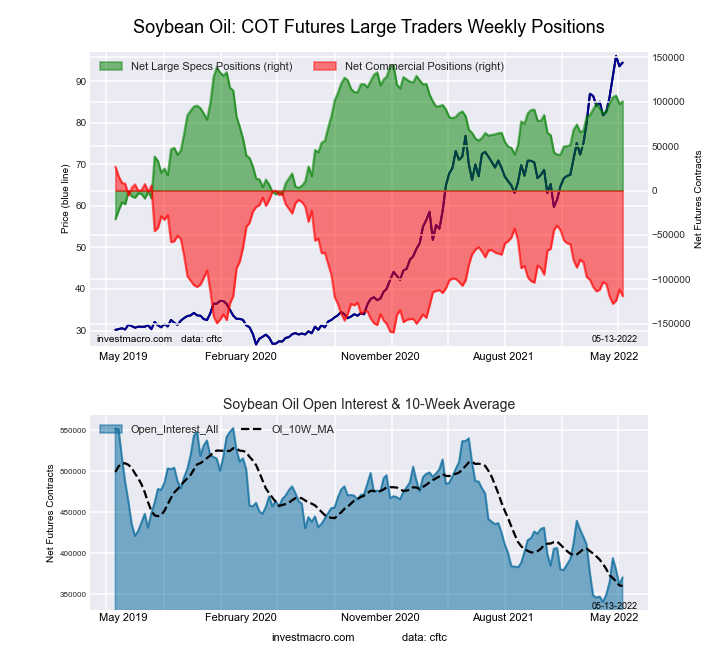 The SOYBEAN OIL large speculator standing this week totaled a net position of 100,596 contracts in the data reported through Tuesday. This was a weekly lift of 3,305 contracts from the previous week which had a total of 97,291 net contracts.
This week’s current strength score (the trader positioning range over the past three years, measured from 0 to 100) shows the speculators are currently Bullish with a score of 76.6 percent. The commercials are Bearish with a score of 21.8 percent and the small traders (not shown in chart) are Bullish-Extreme with a score of 81.5 percent.
| SOYBEAN OIL Futures Statistics | SPECULATORS | COMMERCIALS | SMALL TRADERS |
| – Percent of Open Interest Longs: | 32.0 | 45.8 | 9.9 |
| – Percent of Open Interest Shorts: | 4.8 | 77.9 | 5.0 |
| – Net Position: | 100,596 | -118,831 | 18,235 |
| – Gross Longs: | 118,463 | 169,761 | 36,820 |
| – Gross Shorts: | 17,867 | 288,592 | 18,585 |
| – Long to Short Ratio: | 6.6 to 1 | 0.6 to 1 | 2.0 to 1 |
| NET POSITION TREND: | |||
| – Strength Index Score (3 Year Range Pct): | 76.6 | 21.8 | 81.5 |
| – Strength Index Reading (3 Year Range): | Bullish | Bearish | Bullish-Extreme |
| NET POSITION MOVEMENT INDEX: | |||
| – 6-Week Change in Strength Index: | 7.7 | -8.6 | 10.0 |
SOYBEAN MEAL Futures:
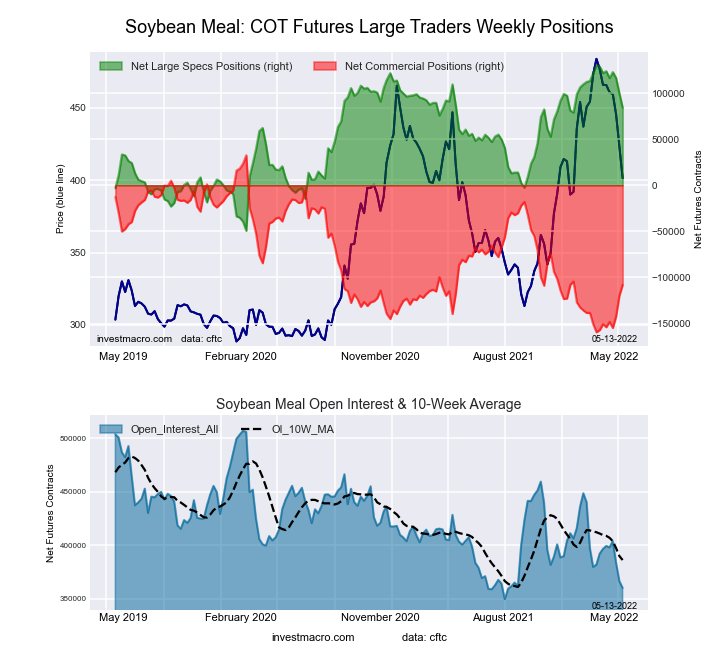 The SOYBEAN MEAL large speculator standing this week totaled a net position of 84,132 contracts in the data reported through Tuesday. This was a weekly reduction of -15,429 contracts from the previous week which had a total of 99,561 net contracts.
This week’s current strength score (the trader positioning range over the past three years, measured from 0 to 100) shows the speculators are currently Bullish with a score of 74.3 percent. The commercials are Bearish with a score of 26.8 percent and the small traders (not shown in chart) are Bullish with a score of 57.5 percent.
| SOYBEAN MEAL Futures Statistics | SPECULATORS | COMMERCIALS | SMALL TRADERS |
| – Percent of Open Interest Longs: | 30.7 | 47.1 | 12.5 |
| – Percent of Open Interest Shorts: | 7.4 | 77.1 | 5.9 |
| – Net Position: | 84,132 | -108,059 | 23,927 |
| – Gross Longs: | 110,648 | 169,583 | 45,065 |
| – Gross Shorts: | 26,516 | 277,642 | 21,138 |
| – Long to Short Ratio: | 4.2 to 1 | 0.6 to 1 | 2.1 to 1 |
| NET POSITION TREND: | |||
| – Strength Index Score (3 Year Range Pct): | 74.3 | 26.8 | 57.5 |
| – Strength Index Reading (3 Year Range): | Bullish | Bearish | Bullish |
| NET POSITION MOVEMENT INDEX: | |||
| – 6-Week Change in Strength Index: | -21.0 | 22.2 | -25.5 |
LIVE CATTLE Futures:

The LIVE CATTLE large speculator standing this week totaled a net position of 39,803 contracts in the data reported through Tuesday. This was a weekly fall of -7,233 contracts from the previous week which had a total of 47,036 net contracts.
This week’s current strength score (the trader positioning range over the past three years, measured from 0 to 100) shows the speculators are currently Bearish with a score of 26.5 percent. The commercials are Bullish with a score of 66.7 percent and the small traders (not shown in chart) are Bullish with a score of 67.9 percent.
| LIVE CATTLE Futures Statistics | SPECULATORS | COMMERCIALS | SMALL TRADERS |
| – Percent of Open Interest Longs: | 36.0 | 38.1 | 10.8 |
| – Percent of Open Interest Shorts: | 23.1 | 49.7 | 12.1 |
| – Net Position: | 39,803 | -35,783 | -4,020 |
| – Gross Longs: | 111,188 | 117,509 | 33,291 |
| – Gross Shorts: | 71,385 | 153,292 | 37,311 |
| – Long to Short Ratio: | 1.6 to 1 | 0.8 to 1 | 0.9 to 1 |
| NET POSITION TREND: | |||
| – Strength Index Score (3 Year Range Pct): | 26.5 | 66.7 | 67.9 |
| – Strength Index Reading (3 Year Range): | Bearish | Bullish | Bullish |
| NET POSITION MOVEMENT INDEX: | |||
| – 6-Week Change in Strength Index: | -14.7 | 8.4 | 22.1 |
LEAN HOGS Futures:
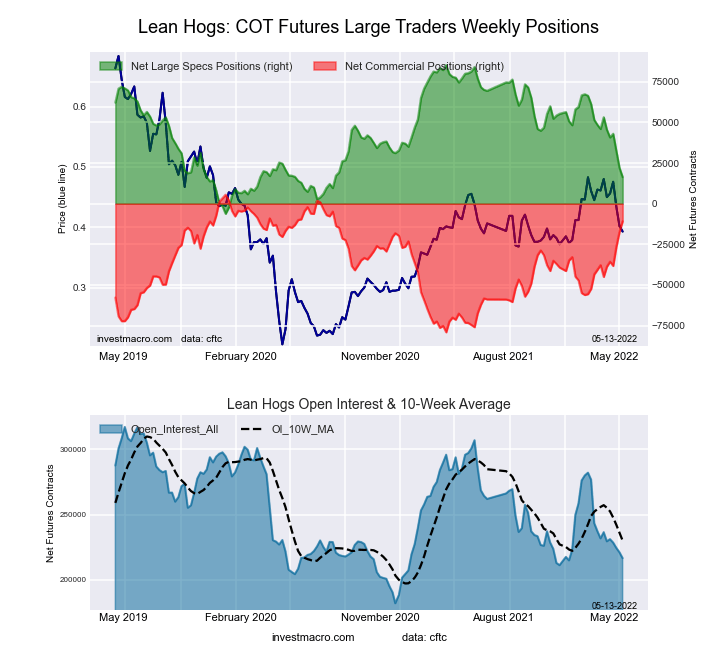 The LEAN HOGS large speculator standing this week totaled a net position of 16,360 contracts in the data reported through Tuesday. This was a weekly reduction of -5,671 contracts from the previous week which had a total of 22,031 net contracts.
This week’s current strength score (the trader positioning range over the past three years, measured from 0 to 100) shows the speculators are currently Bearish with a score of 24.6 percent. The commercials are Bullish-Extreme with a score of 80.7 percent and the small traders (not shown in chart) are Bullish with a score of 67.8 percent.
| LEAN HOGS Futures Statistics | SPECULATORS | COMMERCIALS | SMALL TRADERS |
| – Percent of Open Interest Longs: | 30.7 | 38.0 | 10.2 |
| – Percent of Open Interest Shorts: | 23.1 | 43.0 | 12.8 |
| – Net Position: | 16,360 | -10,817 | -5,543 |
| – Gross Longs: | 66,483 | 82,353 | 22,102 |
| – Gross Shorts: | 50,123 | 93,170 | 27,645 |
| – Long to Short Ratio: | 1.3 to 1 | 0.9 to 1 | 0.8 to 1 |
| NET POSITION TREND: | |||
| – Strength Index Score (3 Year Range Pct): | 24.6 | 80.7 | 67.8 |
| – Strength Index Reading (3 Year Range): | Bearish | Bullish-Extreme | Bullish |
| NET POSITION MOVEMENT INDEX: | |||
| – 6-Week Change in Strength Index: | -40.1 | 40.4 | 13.7 |
COTTON Futures:
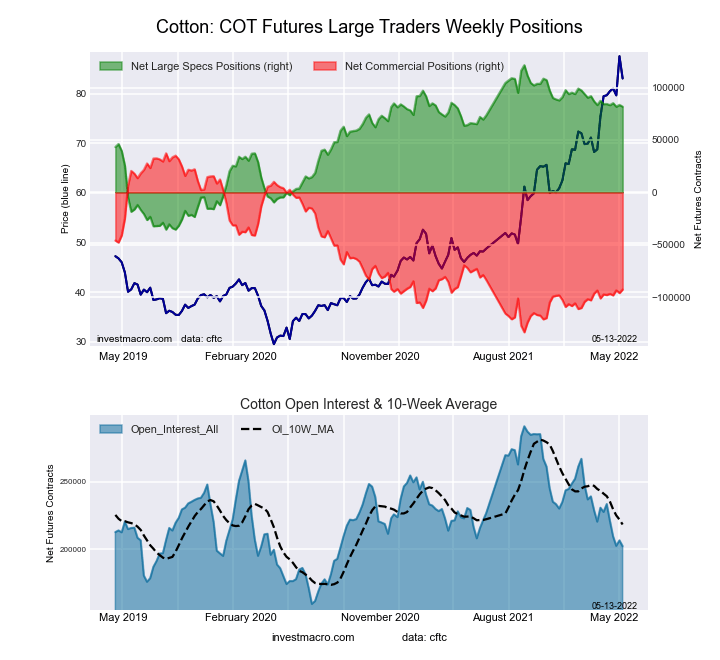 The COTTON large speculator standing this week totaled a net position of 81,759 contracts in the data reported through Tuesday. This was a weekly decline of -1,674 contracts from the previous week which had a total of 83,433 net contracts.
This week’s current strength score (the trader positioning range over the past three years, measured from 0 to 100) shows the speculators are currently Bullish with a score of 74.8 percent. The commercials are Bearish with a score of 23.9 percent and the small traders (not shown in chart) are Bullish-Extreme with a score of 81.2 percent.
| COTTON Futures Statistics | SPECULATORS | COMMERCIALS | SMALL TRADERS |
| – Percent of Open Interest Longs: | 46.8 | 33.8 | 8.5 |
| – Percent of Open Interest Shorts: | 6.3 | 79.6 | 3.1 |
| – Net Position: | 81,759 | -92,603 | 10,844 |
| – Gross Longs: | 94,579 | 68,251 | 17,191 |
| – Gross Shorts: | 12,820 | 160,854 | 6,347 |
| – Long to Short Ratio: | 7.4 to 1 | 0.4 to 1 | 2.7 to 1 |
| NET POSITION TREND: | |||
| – Strength Index Score (3 Year Range Pct): | 74.8 | 23.9 | 81.2 |
| – Strength Index Reading (3 Year Range): | Bullish | Bearish | Bullish-Extreme |
| NET POSITION MOVEMENT INDEX: | |||
| – 6-Week Change in Strength Index: | -1.5 | 2.7 | -14.1 |
COCOA Futures:
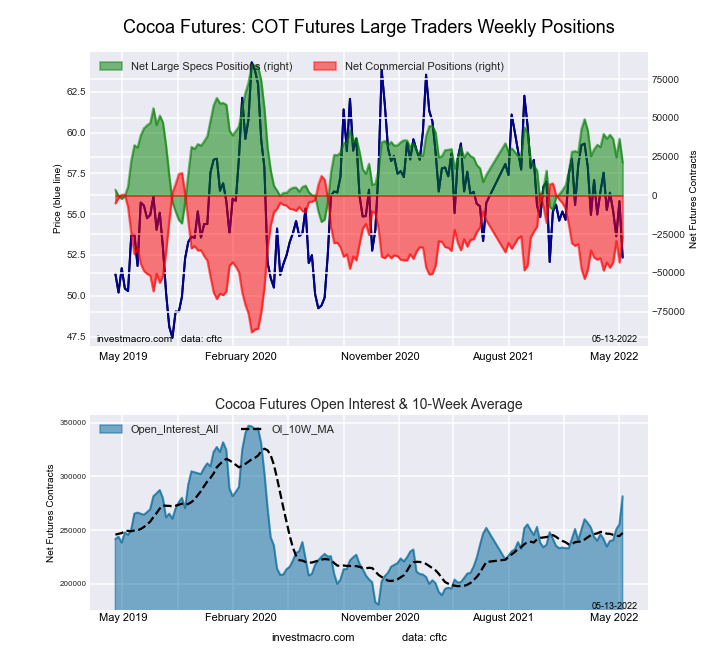 The COCOA large speculator standing this week totaled a net position of 21,046 contracts in the data reported through Tuesday. This was a weekly decline of -15,513 contracts from the previous week which had a total of 36,559 net contracts.
This week’s current strength score (the trader positioning range over the past three years, measured from 0 to 100) shows the speculators are currently Bearish with a score of 38.3 percent. The commercials are Bullish with a score of 59.9 percent and the small traders (not shown in chart) are Bullish with a score of 53.8 percent.
| COCOA Futures Statistics | SPECULATORS | COMMERCIALS | SMALL TRADERS |
| – Percent of Open Interest Longs: | 31.0 | 44.1 | 6.1 |
| – Percent of Open Interest Shorts: | 23.5 | 53.6 | 4.0 |
| – Net Position: | 21,046 | -26,770 | 5,724 |
| – Gross Longs: | 87,140 | 124,216 | 17,042 |
| – Gross Shorts: | 66,094 | 150,986 | 11,318 |
| – Long to Short Ratio: | 1.3 to 1 | 0.8 to 1 | 1.5 to 1 |
| NET POSITION TREND: | |||
| – Strength Index Score (3 Year Range Pct): | 38.3 | 59.9 | 53.8 |
| – Strength Index Reading (3 Year Range): | Bearish | Bullish | Bullish |
| NET POSITION MOVEMENT INDEX: | |||
| – 6-Week Change in Strength Index: | -18.3 | 21.1 | -30.6 |
WHEAT Futures:

The WHEAT large speculator standing this week totaled a net position of 21,686 contracts in the data reported through Tuesday. This was a weekly gain of 1,674 contracts from the previous week which had a total of 20,012 net contracts.
This week’s current strength score (the trader positioning range over the past three years, measured from 0 to 100) shows the speculators are currently Bearish with a score of 48.3 percent. The commercials are Bearish with a score of 34.4 percent and the small traders (not shown in chart) are Bullish-Extreme with a score of 92.3 percent.
| WHEAT Futures Statistics | SPECULATORS | COMMERCIALS | SMALL TRADERS |
| – Percent of Open Interest Longs: | 36.2 | 39.1 | 9.7 |
| – Percent of Open Interest Shorts: | 29.1 | 44.9 | 10.9 |
| – Net Position: | 21,686 | -17,779 | -3,907 |
| – Gross Longs: | 111,546 | 120,631 | 29,835 |
| – Gross Shorts: | 89,860 | 138,410 | 33,742 |
| – Long to Short Ratio: | 1.2 to 1 | 0.9 to 1 | 0.9 to 1 |
| NET POSITION TREND: | |||
| – Strength Index Score (3 Year Range Pct): | 48.3 | 34.4 | 92.3 |
| – Strength Index Reading (3 Year Range): | Bearish | Bearish | Bullish-Extreme |
| NET POSITION MOVEMENT INDEX: | |||
| – 6-Week Change in Strength Index: | 10.4 | -11.9 | 1.2 |
Article By InvestMacro – Receive our weekly COT Reports by Email
*COT Report: The COT data, released weekly to the public each Friday, is updated through the most recent Tuesday (data is 3 days old) and shows a quick view of how large speculators or non-commercials (for-profit traders) were positioned in the futures markets.
The CFTC categorizes trader positions according to commercial hedgers (traders who use futures contracts for hedging as part of the business), non-commercials (large traders who speculate to realize trading profits) and nonreportable traders (usually small traders/speculators) as well as their open interest (contracts open in the market at time of reporting).See CFTC criteria here.

- EUR/USD: The Advantage Remains with the Dollar Jun 29, 2026
- Escalation of the US–Iran conflict is once again supporting the rise in oil prices Jun 29, 2026
- Oil prices fall back to pre‑war levels. Silver drops to a 7‑month low Jun 25, 2026
- Gold Falls to an Eight-Month Low: This May Not Be the Bottom Jun 25, 2026
- Stock indices came under heavy selling pressure amid growing skepticism about AI investments Jun 24, 2026
- The Pound Is Pressured Not by Politics, but by a Strong US Dollar Jun 24, 2026
- Global crude oil prices continued to decline. The AUD/USD exchange rate hit an 11‑week low Jun 23, 2026
- EUR/USD Remains Under Sellers’ Control as the Dollar Stays Strong Jun 23, 2026
- Gold Falls for the Third Consecutive Week: Is There Still Upside Potential? Jun 22, 2026
- Bank Indonesia raised its interest rate. Norges Bank and the SNB left rates unchanged Jun 19, 2026