
By RoboForex Analytical Department
NZD/USD has dropped to its lowest level since October 2022, trading around 0.5620. The currency pair is under pressure from two major factors: the strengthening US dollar and New Zealand’s weak domestic economic data.
The primary driver of the decline in NZD/USD is the robust performance of the US dollar. Following the Federal Reserve’s December meeting, the greenback gained considerable strength due to expectations of subdued rate cuts in 2025. Throughout Wednesday, the NZD dropped by 2.3% against the US dollar, underscoring the impact of a hawkish Fed outlook.
The second factor contributing to NZD’s weakness is poor domestic economic performance. New Zealand’s GDP data has reinforced concerns that the economy is in recession. In Q3 2024, GDP contracted by 1.0% quarter-on-quarter, following a revised 1.1% decline in Q2. On an annualised basis, the economy shrank by 1.5%, a sharp deterioration from the 0.5% contraction recorded in the previous quarter.
The GDP figures were worse than anticipated, heightening fears of a deeper recession and increasing the likelihood of further aggressive monetary easing by the Reserve Bank of New Zealand (RBNZ). Even before this latest data, the RBNZ had been more proactive than several other central banks in cutting interest rates, and the recent developments are likely to reinforce its dovish stance for 2025.
Technical analysis of NZD/USD
Free Reports:
 Get our Weekly Commitment of Traders Reports - See where the biggest traders (Hedge Funds and Commercial Hedgers) are positioned in the futures markets on a weekly basis.
 Sign Up for Our Stock Market Newsletter – Get updated on News, Charts & Rankings of Public Companies when you join our Stocks Newsletter
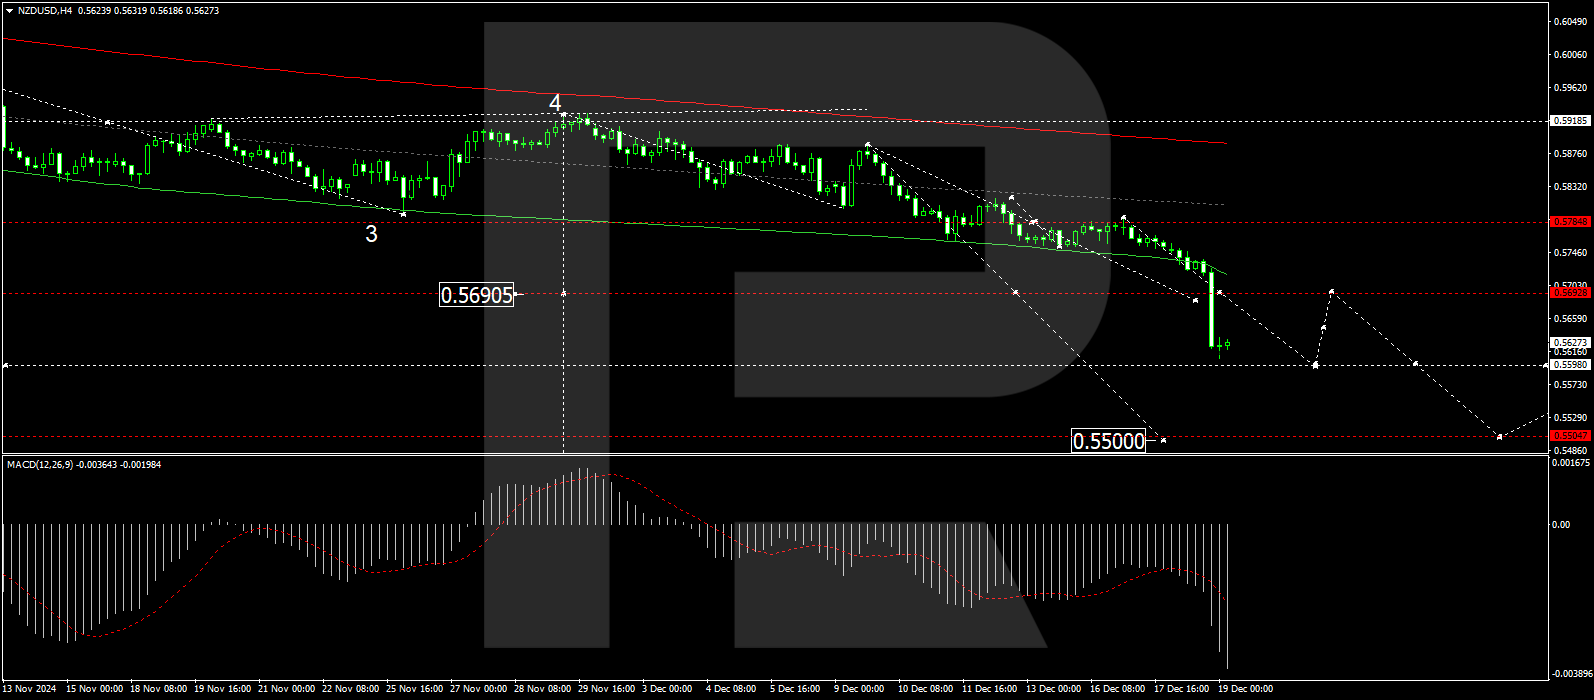
On the H4 chart, NZD/USD experienced a downward pullback from the 0.5785 level and broke through the 0.5690 support level. The current market structure indicates the formation of a downward wave targeting 0.5598. After reaching this level, a corrective move back to test 0.5690 from below is possible. Notably, the breakdown below 0.5690 has paved the way for further declines towards 0.5500, with the main target projected at 0.5454. This bearish scenario is supported by the MACD indicator, with its signal line positioned below the zero mark and trending sharply downward.
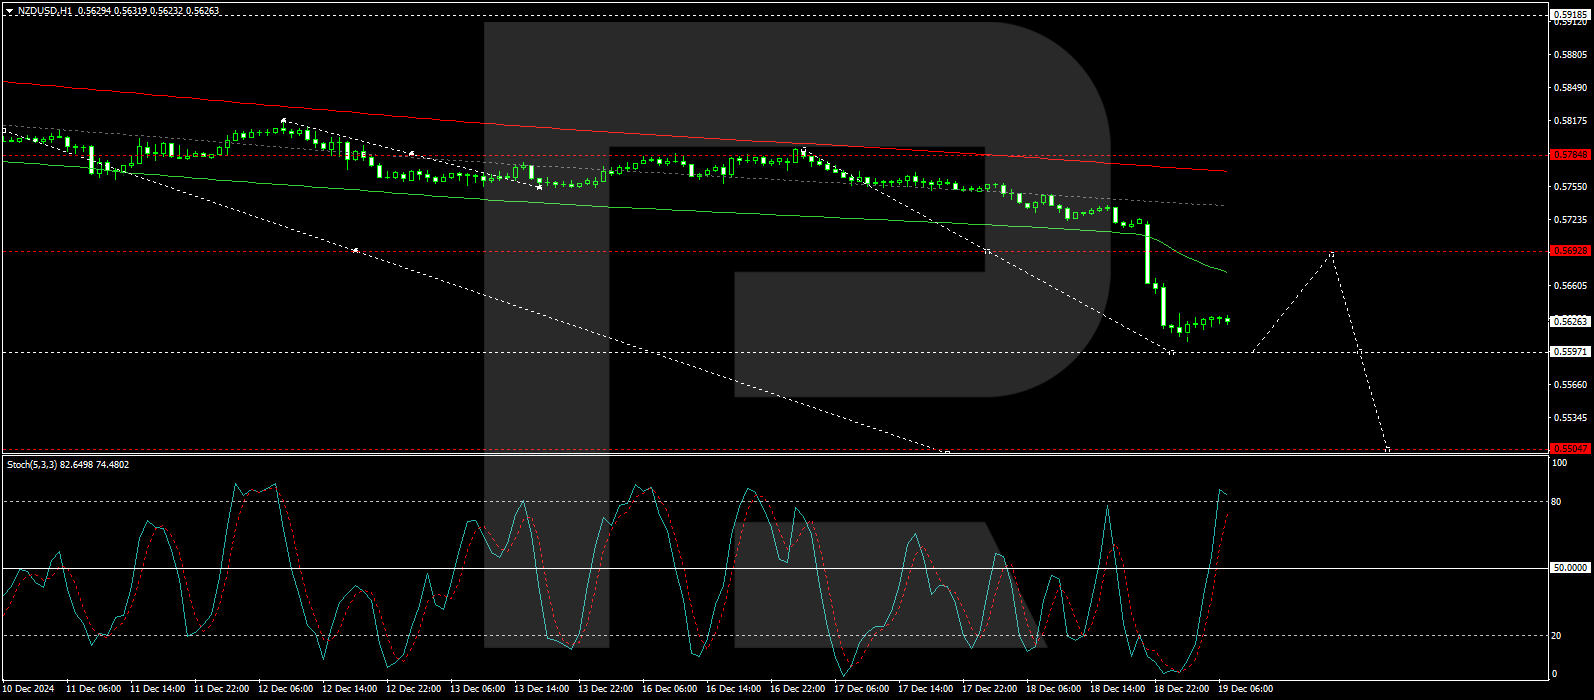
On the H1 chart, NZD/USD is shaping a downward wave towards 0.5597. Before the decline resumes, a short-term correction to 0.5690 could occur. The next target would be 0.5500. This outlook is confirmed by the Stochastic oscillator, where the signal line is near the 80 mark and preparing to drop towards the 20 mark, indicating continued bearish momentum.
Disclaimer
Any forecasts contained herein are based on the author’s particular opinion. This analysis may not be treated as trading advice. RoboForex bears no responsibility for trading results based on trading recommendations and reviews contained herein.

- GBP/USD at Month’s Lows: The Outlook Remains Weak Jul 29, 2026
- Crude oil falls below $80 per barrel. Australia sees inflation slowdown Jul 29, 2026
- The US Tech sector hit by sell‑off. Oil prices decline on renewed negotiations Jul 28, 2026
- Gold Declines, Focus on Fed and Falling Oil Prices Jul 28, 2026
- This week will be one of the most crowded for central‑bank meetings Jul 27, 2026
- EUR/USD Ahead of a Key Week: Holding Near Lows Jul 27, 2026
- COT Metals Charts: Weekly Speculator Changes led by Copper Jul 26, 2026
- COT Bonds Charts: Speculator Bets led by SOFR 3-Months & 5-Year Bonds Jul 26, 2026
- COT Energy Charts: Weekly Speculator Bets led by WTI Crude & Natural Gas Jul 26, 2026
- COT Soft Commodities Charts: Weekly Speculator Bets led by Corn & Soybeans Jul 26, 2026
