
By InvestMacro
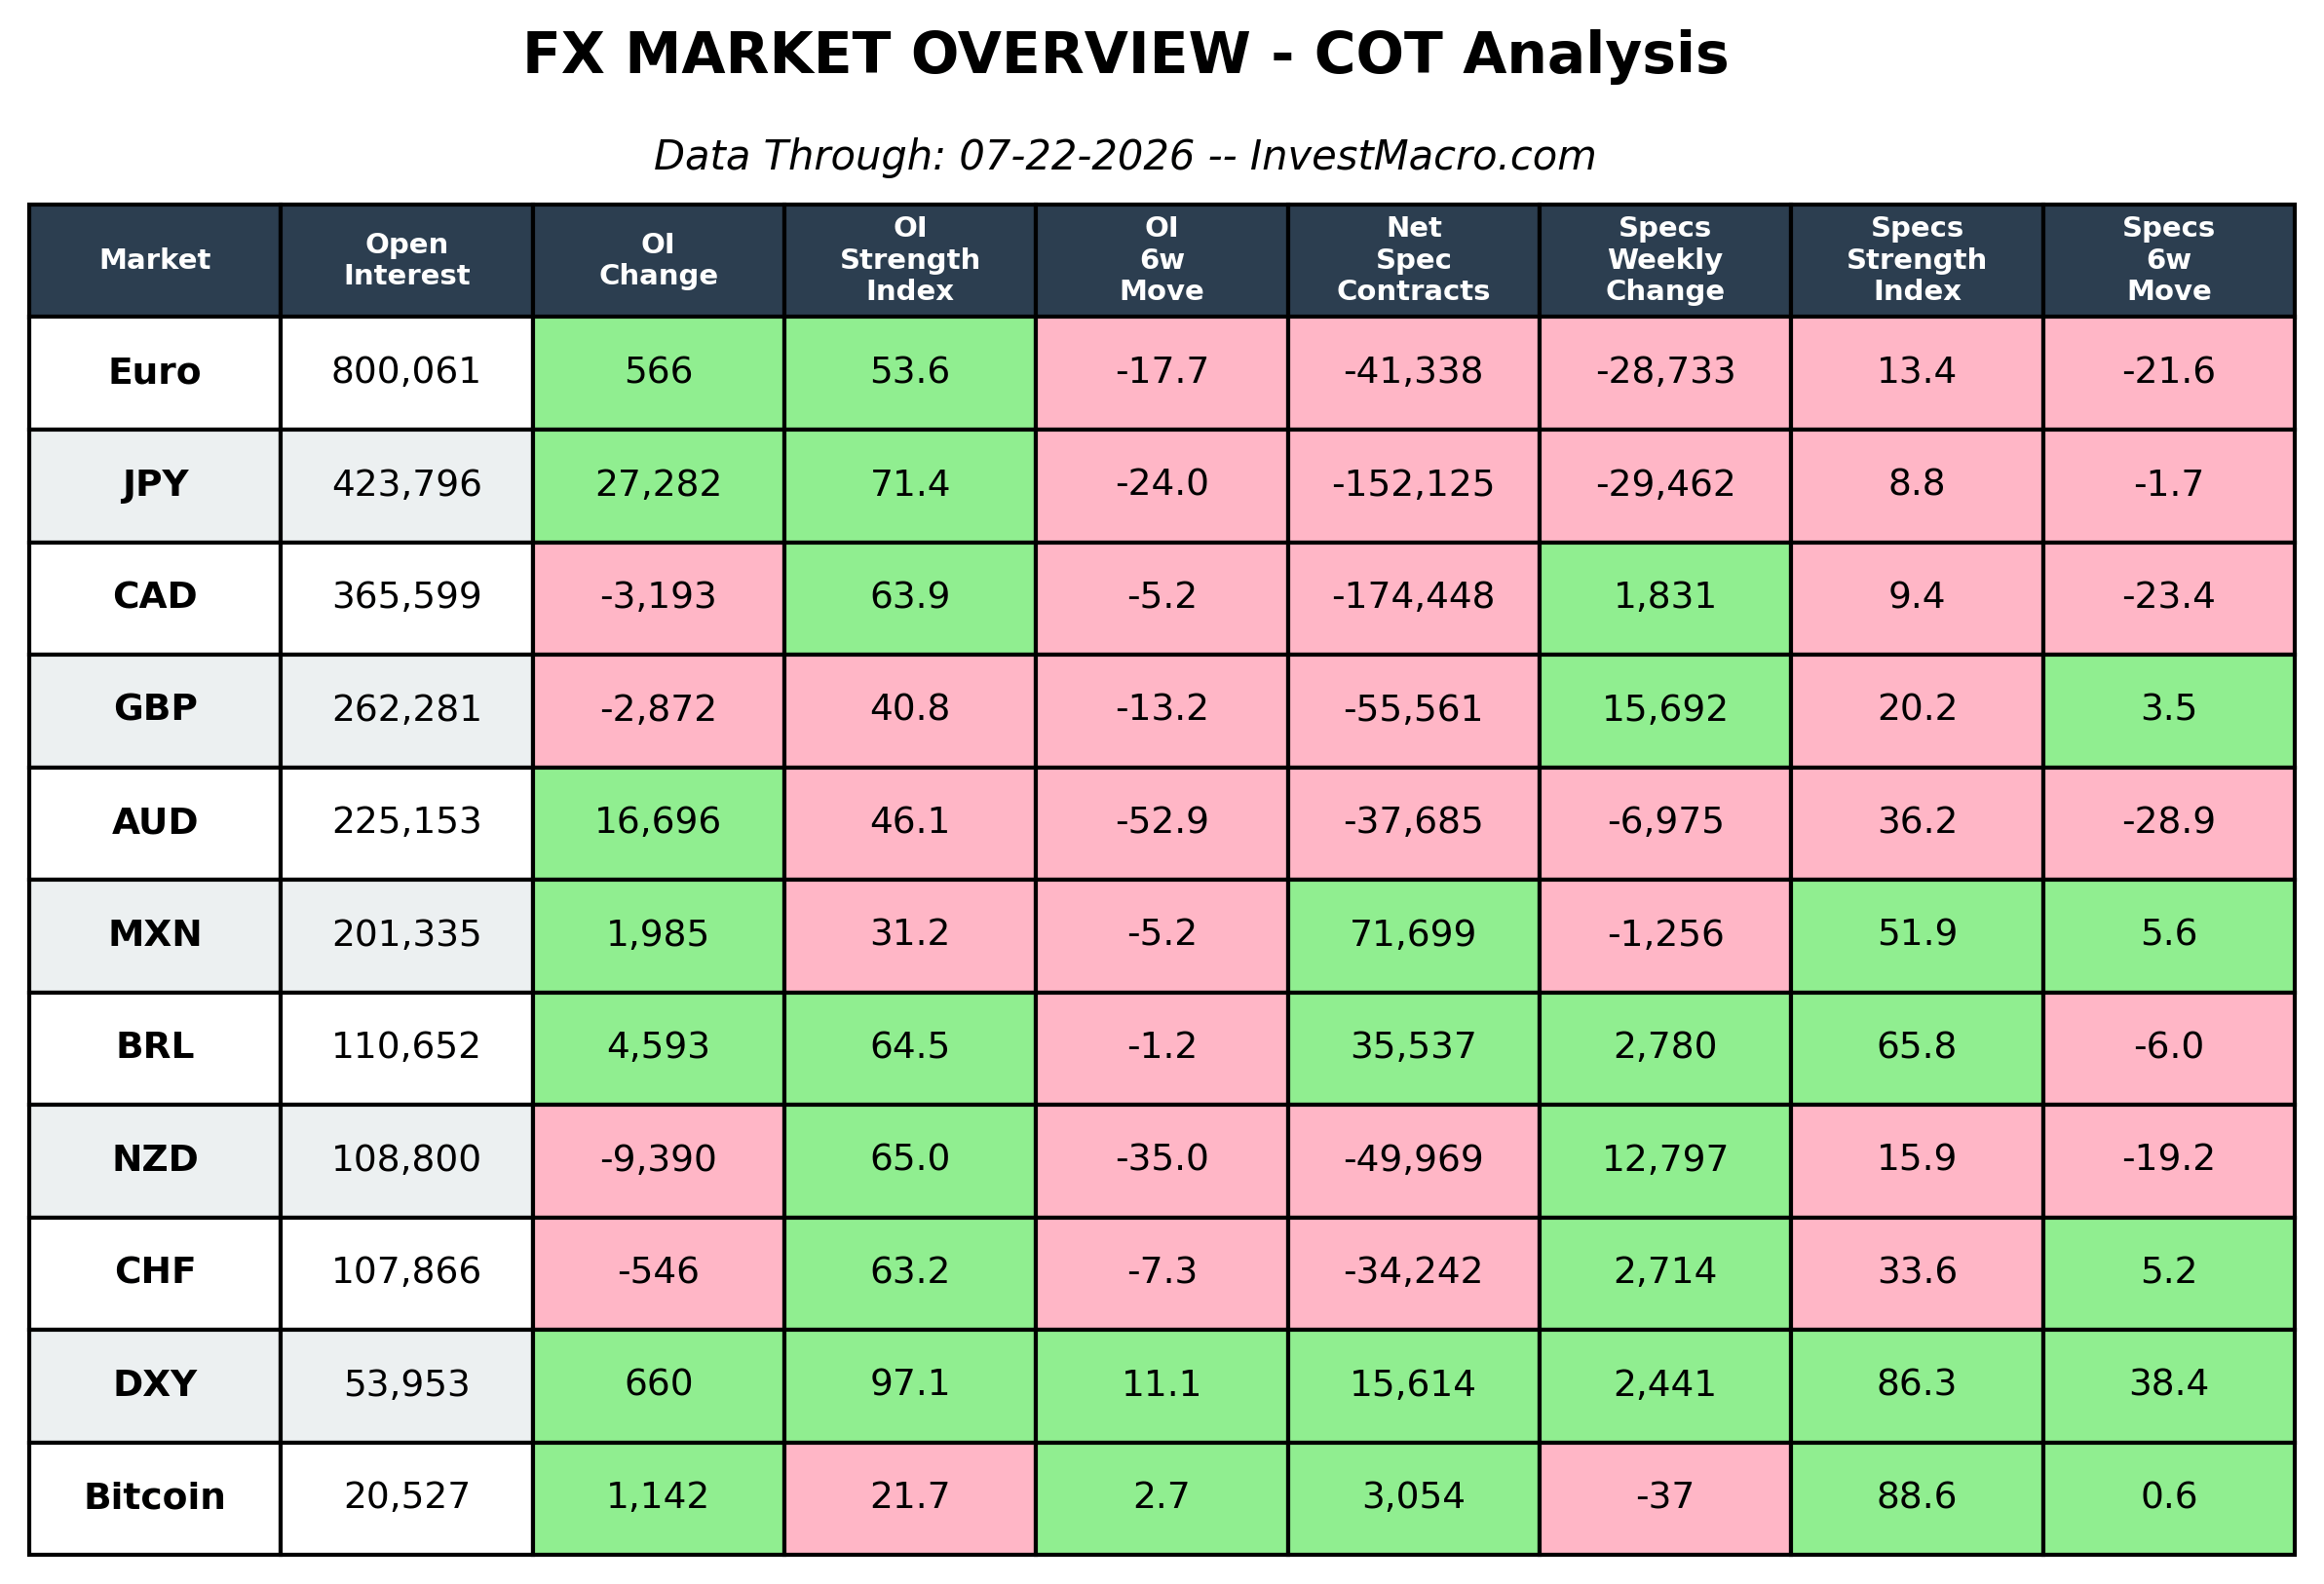
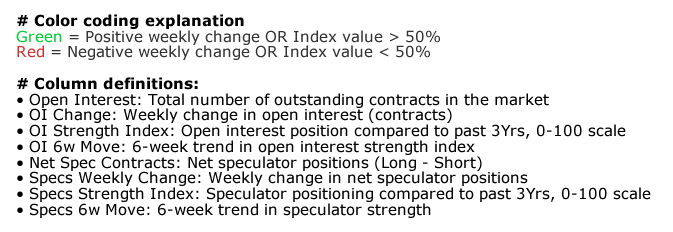
Here are the latest charts and statistics for the Commitment of Traders (COT) data published by the Commodities Futures Trading Commission (CFTC).
The latest COT data is updated through Tuesday July 21st and shows a quick view of how large market participants (for-profit speculators and commercial traders) were positioned in the futures markets. All currency positions are in direct relation to the US dollar where, for example, a bet for the euro is a bet that the euro will rise versus the dollar while a bet against the euro will be a bet that the euro will decline versus the dollar.
Weekly Speculator Changes led by British Pound & New Zealand Dollar
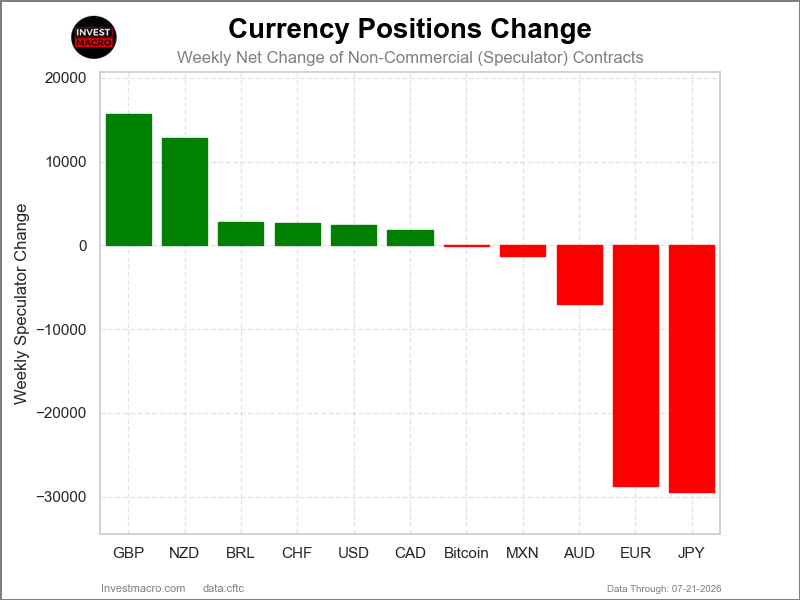
The COT currency market speculator bets were overall higher this week as six out of the eleven currency markets we cover had higher positioning while the other five markets had lower speculator contracts.
Leading the gains for the currency markets was the British Pound (15,692 contracts) with the New Zealand Dollar (12,797 contracts), the Brazilian Real (2,780 contracts), the Swiss Franc (2,714 contracts), the US Dollar Index (2,441 contracts) and the Canadian Dollar (1,831 contracts) also having positive weeks.
Free Reports:
 Download Our Metatrader 4 Indicators – Put Our Free MetaTrader 4 Custom Indicators on your charts when you join our Weekly Newsletter
 Get our Weekly Commitment of Traders Reports - See where the biggest traders (Hedge Funds and Commercial Hedgers) are positioned in the futures markets on a weekly basis.
The currencies seeing declines in speculator bets on the week were the Japanese Yen (-29,462 contracts), the EuroFX (-28,733 contracts), the Australian Dollar (-6,975 contracts), the Mexican Peso (-1,256 contracts) and with Bitcoin (-37 contracts) recording lower bets on the week.
US Dollar Index speculators push bets to over a year high
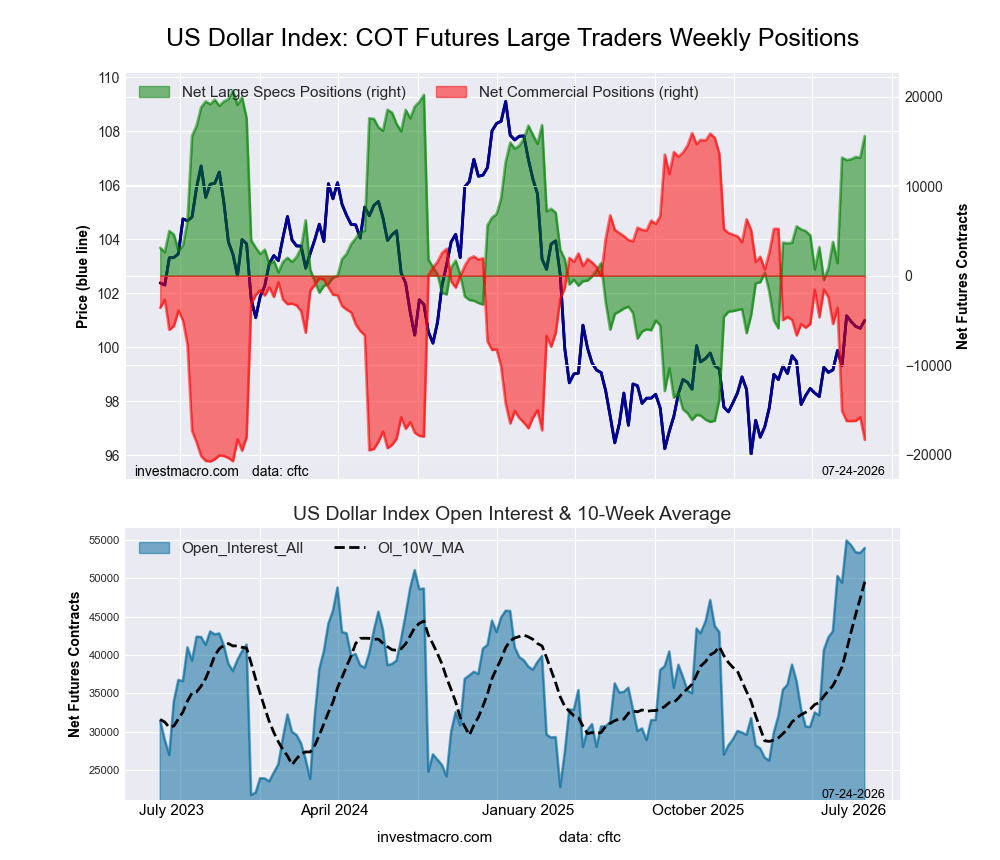
Highlighting the major currency market speculator positioning this week was the US Dollar Index, which continues to see positive sentiment in the futures market. The US Dollar Index weekly speculator positions rose for the third time in the past four weeks, as well as the sixth time out of the past nine weeks. The Dollar Index bets have now gone from a small negative position on May 19th to a total position this week of +15,614 net contracts. This is the most bullish net contract position of the past 73 weeks, dating back to February 25th of 2025. In the foreign exchange markets, the US Dollar Index this week closed above the 101.30 exchange rate, which is the highest close since March of 2025 and marks the sixth consecutive week that has seen higher closes than the 100.00 significant price level. Previously, the Dollar Index had been trading in a sideways trading range for over a year, but now the US Dollar Index has broken out of that level with the 102.00 level next in sight.
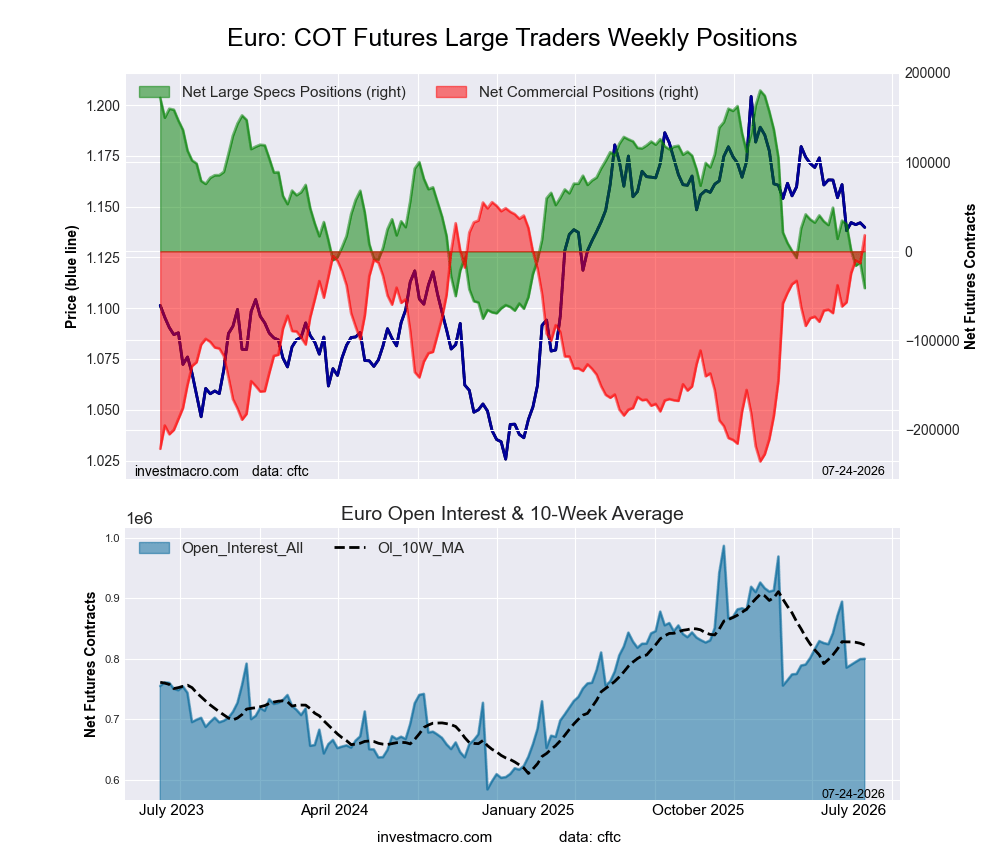
Next up, the Euro currency is seeing the reverse fortunes (of the US Dollar Index) with this week’s sharp decline in speculator bets. The Euro position fell by over -28,500 contracts this week and has now fallen in four out of the past five weeks, for a total decline over the past five weeks of -75,691 net contracts. This has taken the overall net position from a +34,353 contracts on June 16th to this week’s -41,338 net contracts standing. This is the most bearish level for the Euro speculators since February 18th of 2025, when the net contract position was over -50,000 net contracts. In the Foreign Exchange markets, the Euro has now entered a short-term downtrend and has been below the 1.1500 level for five consecutive weeks, with this week’s close at 1.1394, which marks the lowest close since June of 2025. The Euro has overhead resistance at the 1.1500 level, and further declines will bring in the 1.1300 support.
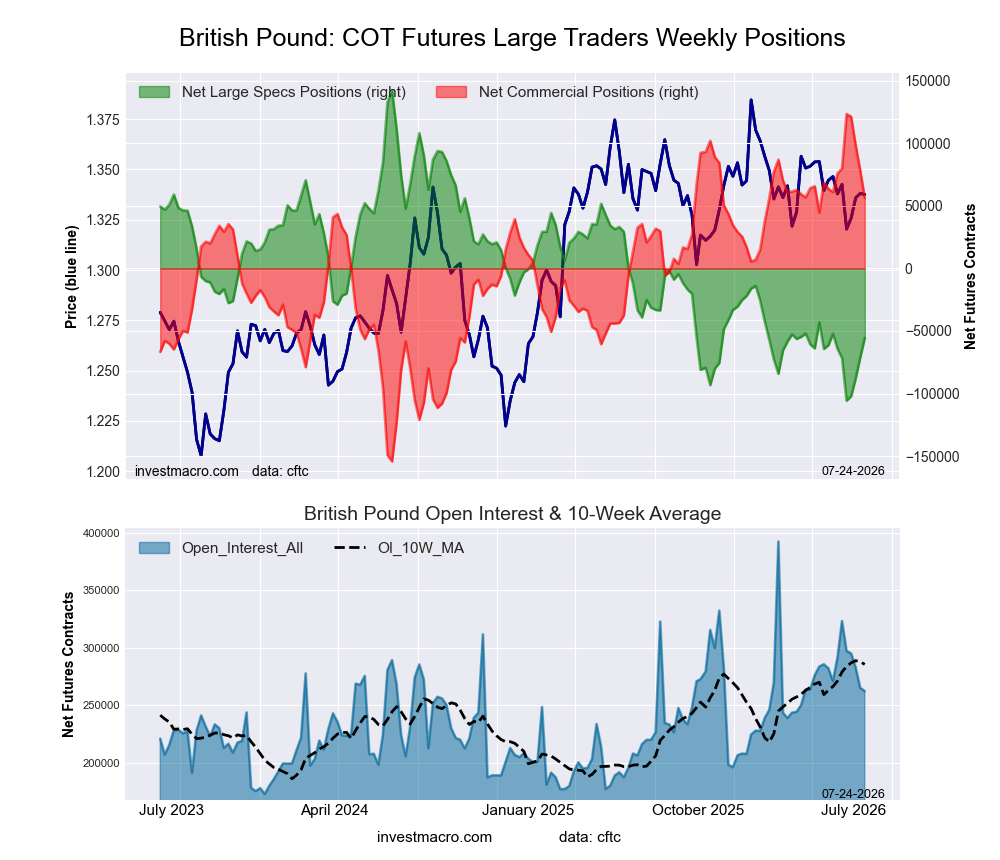
Next up, the British Pound Sterling‘s bearish bets improved once again this week and have now been better for four consecutive weeks. After the British Pound Sterling bets had fallen on June 23rd to one of the most bearish levels on record at -105,719 net contracts, the bearish bets have cooled off. GBP bets have improved for four consecutive weeks with a four-week gain by +50,158 speculator contracts and has trimmed the bearish position to this week’s total of -55,561 net contracts. Overall, the GBP speculator positioning has continued to be in a bearish level for the 52nd consecutive week, dating back to July of 2025. In the Foreign Exchange markets, the British Pound Sterling continues to trade in a sideways trading band that has a bottom of roughly 1.3150 and a top side of 1.3750. This week’s close at 1.3325 is close to down the middle of this trading band, and this week’s GBP decline breaks a three-week streak of gains that had seen the GBP trade as high as 1.3558.
The US Dollar Index leads the major Currency market price performances
Leading the major Currencies this week, the US Dollar Index shone the brightest with a 0.77% rise. The Brazilian Real came in second with a 0.62% gain over the past five days, while the Mexican Peso rounded out the gainers with a 0.14% increase.
On the downside, the Australian Dollar saw a minuscule decline of -0.20% and was followed by the Euro, which dipped by -0.64%. The Canadian Dollar also fell by -0.68%, while Bitcoin was lower by -0.82%. The Japanese Yen almost fell by -1% with a -0.91% decrease, and the British Pound Sterling was lower by -1.04%.
The New Zealand Dollar fell by -1.21%, while the Swiss Franc was the biggest decliner on the week with a drop by -1.35%.
Currencies Data:
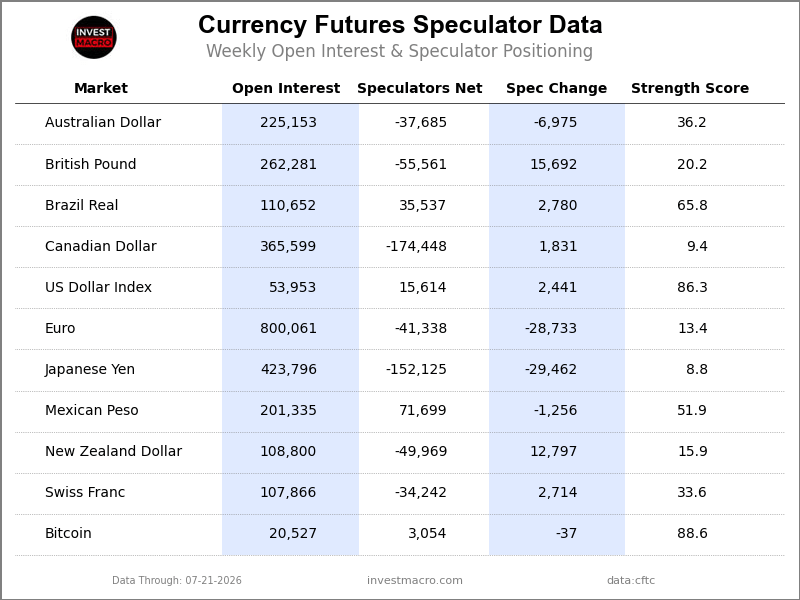
Legend: Open Interest | Speculators Current Net Position | Weekly Specs Change | Specs Strength Score compared to last 3-Years (0-100 range)
Strength Scores led by Bitcoin & US Dollar Index
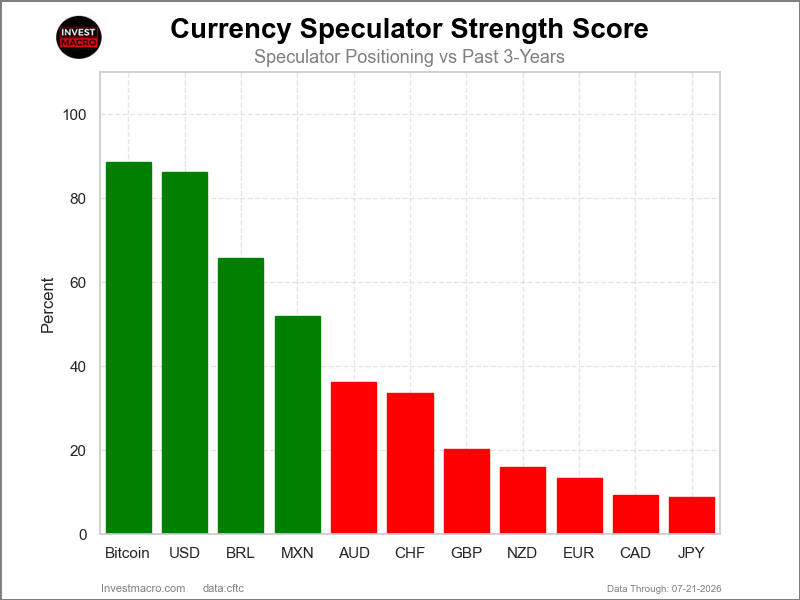
COT Strength Scores (a normalized measure of Speculator positions over a 3-Year range, from 0 to 100 where above 80 is Extreme-Bullish and below 20 is Extreme-Bearish) showed that Bitcoin (89 percent) and the US Dollar Index (86 percent) lead the currency markets this week. The Brazilian Real (66 percent) and the Mexican Peso (52 percent) come in as the next highest in the weekly strength scores.
On the downside, the Canadian Dollar (9 percent), the Japanese Yen (9 percent), the EuroFX (13 percent) and the New Zealand Dollar (16 percent) come in at the lowest strength levels currently and are in Extreme-Bearish territory (below 20 percent).
3-Year Strength Statistics:
US Dollar Index (86.3 percent) vs US Dollar Index previous week (79.7 percent)
EuroFX (13.4 percent) vs EuroFX previous week (24.6 percent)
British Pound Sterling (20.2 percent) vs British Pound Sterling previous week (13.9 percent)
Japanese Yen (8.8 percent) vs Japanese Yen previous week (16.9 percent)
Swiss Franc (33.6 percent) vs Swiss Franc previous week (27.7 percent)
Canadian Dollar (9.4 percent) vs Canadian Dollar previous week (8.6 percent)
Australian Dollar (36.2 percent) vs Australian Dollar previous week (39.8 percent)
New Zealand Dollar (15.9 percent) vs New Zealand Dollar previous week (2.5 percent)
Mexican Peso (51.9 percent) vs Mexican Peso previous week (52.7 percent)
Brazilian Real (65.8 percent) vs Brazilian Real previous week (63.8 percent)
Bitcoin (88.6 percent) vs Bitcoin previous week (89.1 percent)
US Dollar Index & Mexican Peso top the 6-Week Strength Trends
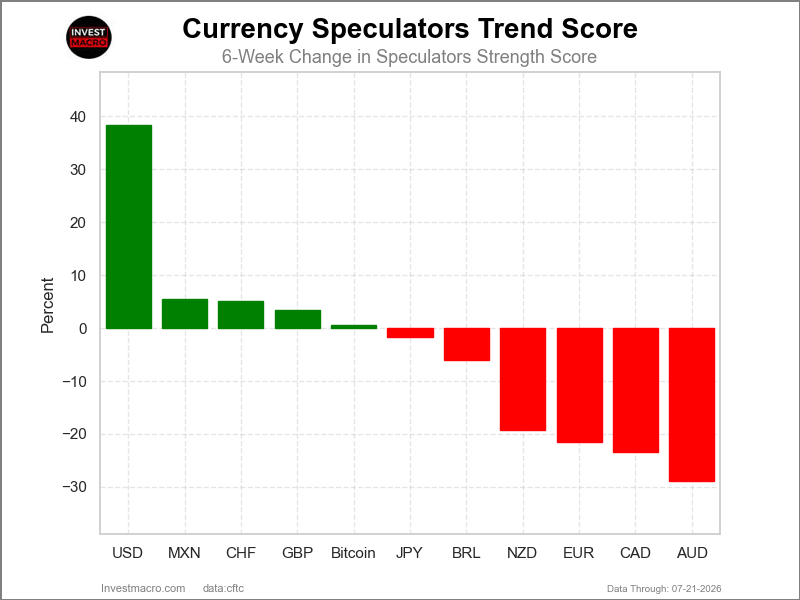
COT Strength Score Trends (or move index, calculates the 6-week changes in strength scores) showed that the US Dollar Index (38 percent) and the Mexican Peso (6 percent) lead the past six weeks trends for the currencies. The Swiss Franc (5 percent), the British Pound (3 percent) and Bitcoin (1 percent) are the next highest positive movers in the 3-Year trends data.
The Australian Dollar (-29 percent) leads the downside trend scores currently with the Canadian Dollar (-23 percent), EuroFX (-22 percent) and the New Zealand Dollar (-19 percent) following next with lower trend scores.
3-Year Strength Trends:
US Dollar Index (38.4 percent) vs US Dollar Index previous week (25.4 percent)
EuroFX (-21.6 percent) vs EuroFX previous week (-24.0 percent)
British Pound Sterling (3.5 percent) vs British Pound Sterling previous week (-7.7 percent)
Japanese Yen (-1.7 percent) vs Japanese Yen previous week (1.9 percent)
Swiss Franc (5.2 percent) vs Swiss Franc previous week (-8.7 percent)
Canadian Dollar (-23.4 percent) vs Canadian Dollar previous week (-35.4 percent)
Australian Dollar (-28.9 percent) vs Australian Dollar previous week (-37.5 percent)
New Zealand Dollar (-19.2 percent) vs New Zealand Dollar previous week (-36.0 percent)
Mexican Peso (5.6 percent) vs Mexican Peso previous week (13.0 percent)
Brazilian Real (-6.0 percent) vs Brazilian Real previous week (-10.3 percent)
Bitcoin (0.6 percent) vs Bitcoin previous week (10.1 percent)
Individual COT Forex Markets:
US Dollar Index Futures:
 Positioning Notes:
- US Dollar Index large speculator standing this week was a net position of 15,614 contracts in the data reported through Tuesday.
- Weekly Speculator position advance of 2,441 contracts from the previous week which had a total of 13,173 net contracts.
- This week’s current strength score (range over the past 3 years, measured from 0 to 100) shows the speculators are currently Bullish-Extreme with a score of 86.3 percent.
- The Commercials are Bearish-Extreme with a score of 6.6 percent.
- The Small Traders (not shown in chart) are Bullish-Extreme with a score of 89.5 percent.
Price Trend-Following Model: Strong Uptrend
Our weekly trend-following model classifies the current market price position as: Strong Uptrend.
| US DOLLAR INDEX Statistics | SPECULATORS | COMMERCIALS | SMALL TRADERS |
| – Percent of Open Interest Longs: | 61.7 | 27.4 | 7.9 |
| – Percent of Open Interest Shorts: | 32.7 | 61.4 | 2.8 |
| – Net Position: | 15,614 | -18,347 | 2,733 |
| – Gross Longs: | 33,270 | 14,764 | 4,258 |
| – Gross Shorts: | 17,656 | 33,111 | 1,525 |
| – Long to Short Ratio: | 1.9 to 1 | 0.4 to 1 | 2.8 to 1 |
| NET POSITION TREND: | |||
| – Strength Index Score (3 Year Range Pct): | 86.3 | 6.6 | 89.5 |
| – Strength Index Reading (3 Year Range): | Bullish-Extreme | Bearish-Extreme | Bullish-Extreme |
| NET POSITION MOVEMENT INDEX: | |||
| – 6-Week Change in Strength Index: | 38.4 | -40.2 | 9.3 |
Euro Currency Futures:
 Positioning Notes:
- Euro Currency large speculator standing this week was a net position of -41,338 contracts in the data reported through Tuesday.
- Weekly Speculator position lowering of -28,733 contracts from the previous week which had a total of -12,605 net contracts.
- This week’s current strength score (range over the past 3 years, measured from 0 to 100) shows the speculators are currently Bearish-Extreme with a score of 13.4 percent.
- The Commercials are Bullish-Extreme with a score of 87.2 percent.
- The Small Traders (not shown in chart) are Bearish with a score of 23.8 percent.
Price Trend-Following Model: Strong Downtrend
Our weekly trend-following model classifies the current market price position as: Strong Downtrend.
| EURO Currency Statistics | SPECULATORS | COMMERCIALS | SMALL TRADERS |
| – Percent of Open Interest Longs: | 27.6 | 58.5 | 10.1 |
| – Percent of Open Interest Shorts: | 32.7 | 56.3 | 7.1 |
| – Net Position: | -41,338 | 17,975 | 23,363 |
| – Gross Longs: | 220,465 | 468,045 | 80,473 |
| – Gross Shorts: | 261,803 | 450,070 | 57,110 |
| – Long to Short Ratio: | 0.8 to 1 | 1.0 to 1 | 1.4 to 1 |
| NET POSITION TREND: | |||
| – Strength Index Score (3 Year Range Pct): | 13.4 | 87.2 | 23.8 |
| – Strength Index Reading (3 Year Range): | Bearish-Extreme | Bullish-Extreme | Bearish |
| NET POSITION MOVEMENT INDEX: | |||
| – 6-Week Change in Strength Index: | -21.6 | 19.3 | -1.7 |
British Pound Sterling Futures:
 Positioning Notes:
- British Pound Sterling large speculator standing this week was a net position of -55,561 contracts in the data reported through Tuesday.
- Weekly Speculator position gain of 15,692 contracts from the previous week which had a total of -71,253 net contracts.
- This week’s current strength score (range over the past 3 years, measured from 0 to 100) shows the speculators are currently Bearish with a score of 20.2 percent.
- The Commercials are Bullish with a score of 75.8 percent.
- The Small Traders (not shown in chart) are Bullish with a score of 51.8 percent.
Price Trend-Following Model: Weak Uptrend
Our weekly trend-following model classifies the current market price position as: Weak Uptrend.
| BRITISH POUND Statistics | SPECULATORS | COMMERCIALS | SMALL TRADERS |
| – Percent of Open Interest Longs: | 24.5 | 62.2 | 11.2 |
| – Percent of Open Interest Shorts: | 45.7 | 40.8 | 11.5 |
| – Net Position: | -55,561 | 56,299 | -738 |
| – Gross Longs: | 64,282 | 163,251 | 29,437 |
| – Gross Shorts: | 119,843 | 106,952 | 30,175 |
| – Long to Short Ratio: | 0.5 to 1 | 1.5 to 1 | 1.0 to 1 |
| NET POSITION TREND: | |||
| – Strength Index Score (3 Year Range Pct): | 20.2 | 75.8 | 51.8 |
| – Strength Index Reading (3 Year Range): | Bearish | Bullish | Bullish |
| NET POSITION MOVEMENT INDEX: | |||
| – 6-Week Change in Strength Index: | 3.5 | -7.0 | 28.6 |
Japanese Yen Futures:
 Positioning Notes:
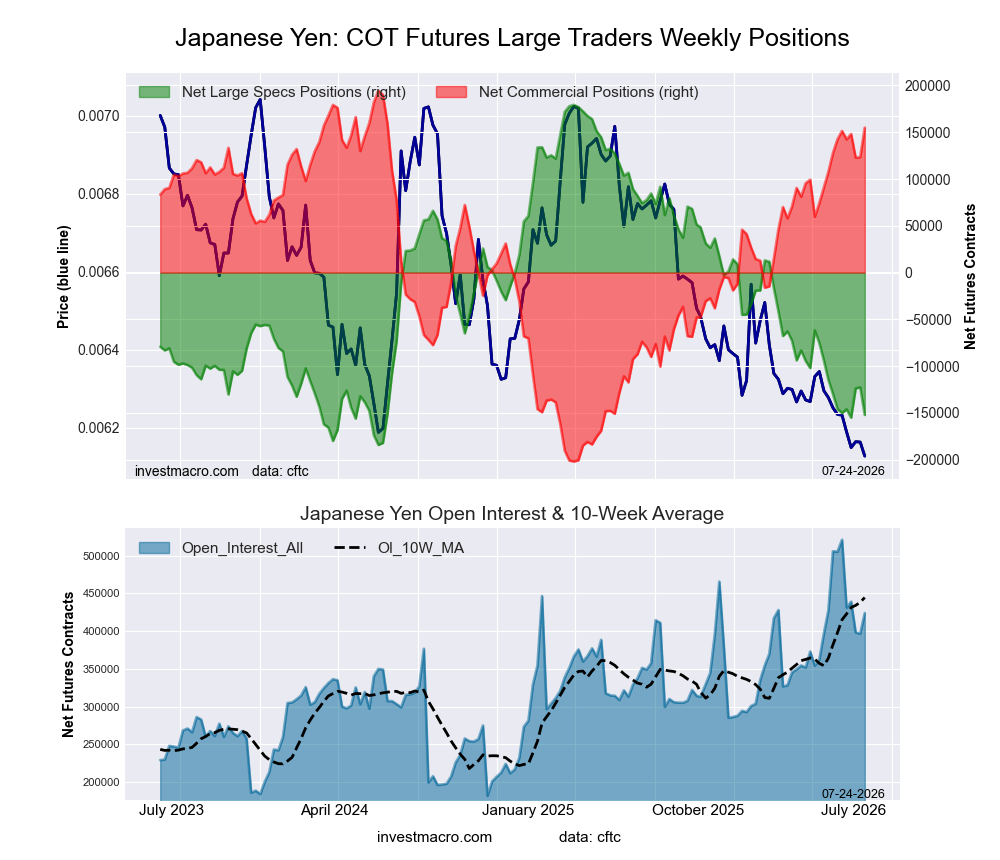
- Japanese Yen large speculator standing this week was a net position of -152,125 contracts in the data reported through Tuesday.
- Weekly Speculator position decline of -29,462 contracts from the previous week which had a total of -122,663 net contracts.
- This week’s current strength score (range over the past 3 years, measured from 0 to 100) shows the speculators are currently Bearish-Extreme with a score of 8.8 percent.
- The Commercials are Bullish-Extreme with a score of 90.0 percent.
- The Small Traders (not shown in chart) are Bearish with a score of 25.3 percent.
Price Trend-Following Model: Strong Downtrend
Our weekly trend-following model classifies the current market price position as: Strong Downtrend.
| JAPANESE YEN Statistics | SPECULATORS | COMMERCIALS | SMALL TRADERS |
| – Percent of Open Interest Longs: | 25.4 | 60.0 | 10.4 |
| – Percent of Open Interest Shorts: | 61.3 | 23.4 | 11.1 |
| – Net Position: | -152,125 | 154,898 | -2,773 |
| – Gross Longs: | 107,590 | 254,110 | 44,065 |
| – Gross Shorts: | 259,715 | 99,212 | 46,838 |
| – Long to Short Ratio: | 0.4 to 1 | 2.6 to 1 | 0.9 to 1 |
| NET POSITION TREND: | |||
| – Strength Index Score (3 Year Range Pct): | 8.8 | 90.0 | 25.3 |
| – Strength Index Reading (3 Year Range): | Bearish-Extreme | Bullish-Extreme | Bearish |
| NET POSITION MOVEMENT INDEX: | |||
| – 6-Week Change in Strength Index: | -1.7 | 3.2 | -17.0 |
Swiss Franc Futures:
 Positioning Notes:
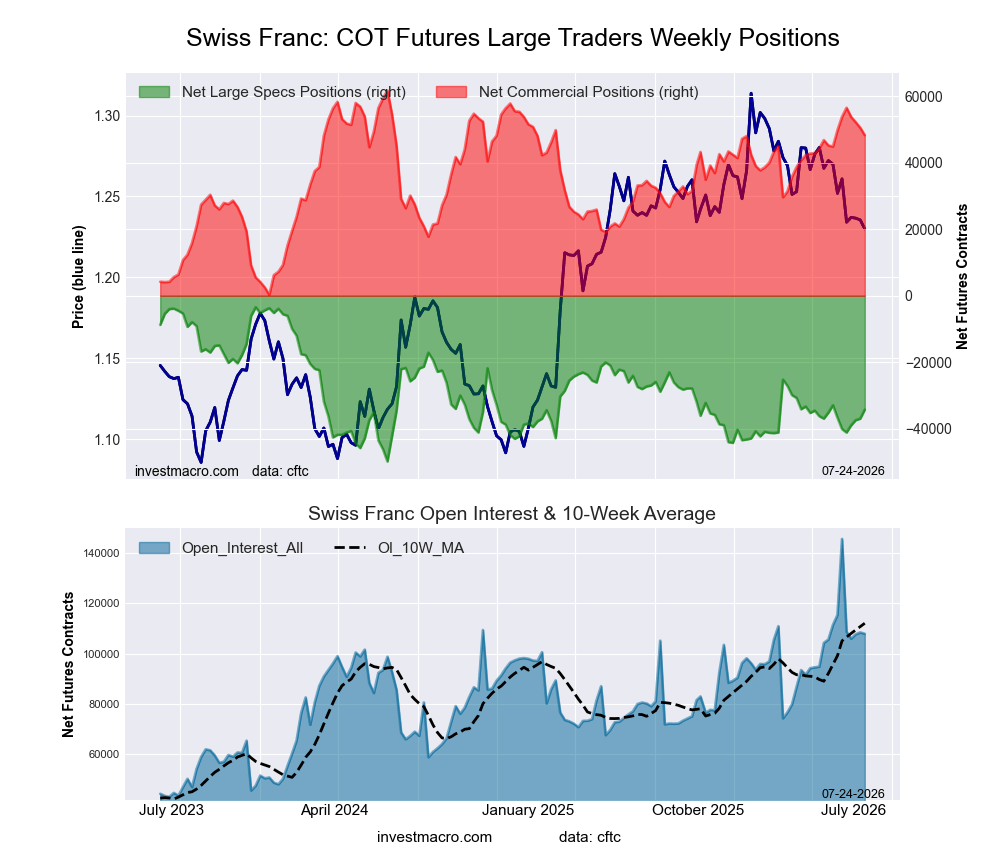
- Swiss Franc large speculator standing this week was a net position of -34,242 contracts in the data reported through Tuesday.
- Weekly Speculator position rise of 2,714 contracts from the previous week which had a total of -36,956 net contracts.
- This week’s current strength score (range over the past 3 years, measured from 0 to 100) shows the speculators are currently Bearish with a score of 33.6 percent.
- The Commercials are Bullish with a score of 78.2 percent.
- The Small Traders (not shown in chart) are Bearish-Extreme with a score of 19.7 percent.
Price Trend-Following Model: Strong Downtrend
Our weekly trend-following model classifies the current market price position as: Strong Downtrend.
| SWISS FRANC Statistics | SPECULATORS | COMMERCIALS | SMALL TRADERS |
| – Percent of Open Interest Longs: | 9.1 | 76.3 | 9.6 |
| – Percent of Open Interest Shorts: | 40.8 | 31.6 | 22.6 |
| – Net Position: | -34,242 | 48,269 | -14,027 |
| – Gross Longs: | 9,817 | 82,333 | 10,383 |
| – Gross Shorts: | 44,059 | 34,064 | 24,410 |
| – Long to Short Ratio: | 0.2 to 1 | 2.4 to 1 | 0.4 to 1 |
| NET POSITION TREND: | |||
| – Strength Index Score (3 Year Range Pct): | 33.6 | 78.2 | 19.7 |
| – Strength Index Reading (3 Year Range): | Bearish | Bullish | Bearish-Extreme |
| NET POSITION MOVEMENT INDEX: | |||
| – 6-Week Change in Strength Index: | 5.2 | -2.4 | -4.1 |
Canadian Dollar Futures:
 Positioning Notes:
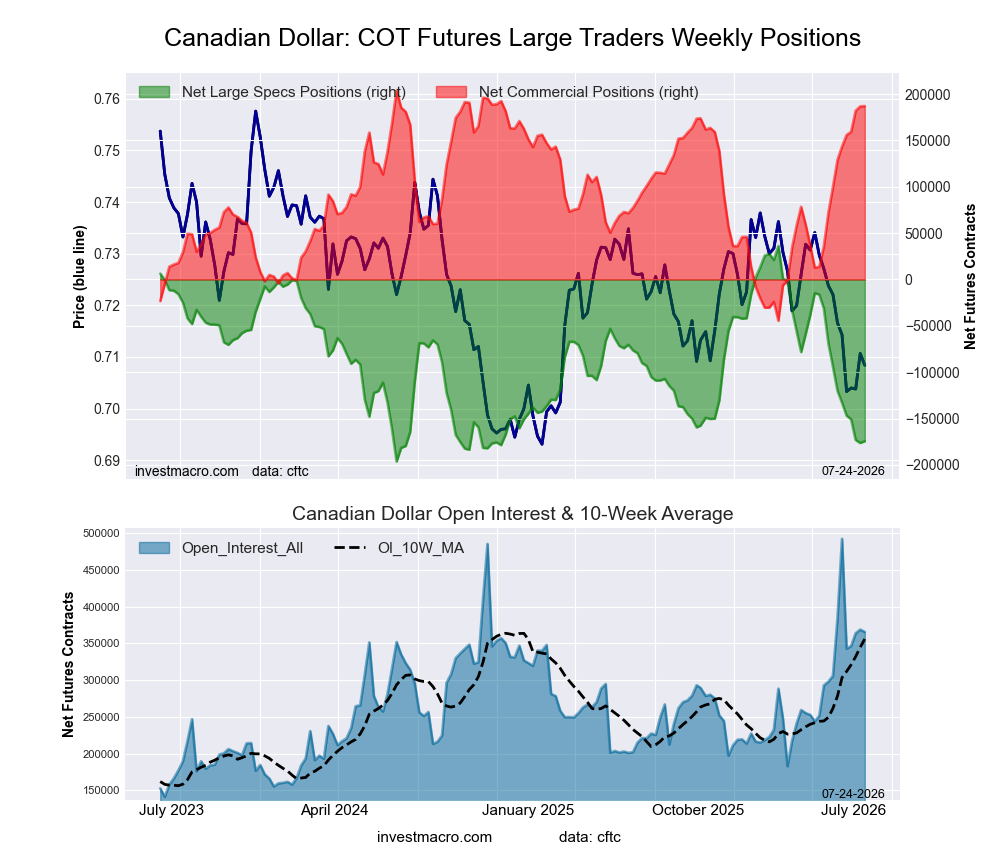
- Canadian Dollar large speculator standing this week was a net position of -174,448 contracts in the data reported through Tuesday.
- Weekly Speculator position gain of 1,831 contracts from the previous week which had a total of -176,279 net contracts.
- This week’s current strength score (range over the past 3 years, measured from 0 to 100) shows the speculators are currently Bearish-Extreme with a score of 9.4 percent.
- The Commercials are Bullish-Extreme with a score of 93.2 percent.
- The Small Traders (not shown in chart) are Bearish-Extreme with a score of 11.1 percent.
Price Trend-Following Model: Downtrend
Our weekly trend-following model classifies the current market price position as: Downtrend.
| CANADIAN DOLLAR Statistics | SPECULATORS | COMMERCIALS | SMALL TRADERS |
| – Percent of Open Interest Longs: | 7.4 | 82.5 | 7.8 |
| – Percent of Open Interest Shorts: | 55.1 | 31.4 | 11.3 |
| – Net Position: | -174,448 | 187,001 | -12,553 |
| – Gross Longs: | 27,007 | 301,799 | 28,617 |
| – Gross Shorts: | 201,455 | 114,798 | 41,170 |
| – Long to Short Ratio: | 0.1 to 1 | 2.6 to 1 | 0.7 to 1 |
| NET POSITION TREND: | |||
| – Strength Index Score (3 Year Range Pct): | 9.4 | 93.2 | 11.1 |
| – Strength Index Reading (3 Year Range): | Bearish-Extreme | Bullish-Extreme | Bearish-Extreme |
| NET POSITION MOVEMENT INDEX: | |||
| – 6-Week Change in Strength Index: | -23.4 | 23.4 | -11.3 |
Australian Dollar Futures:
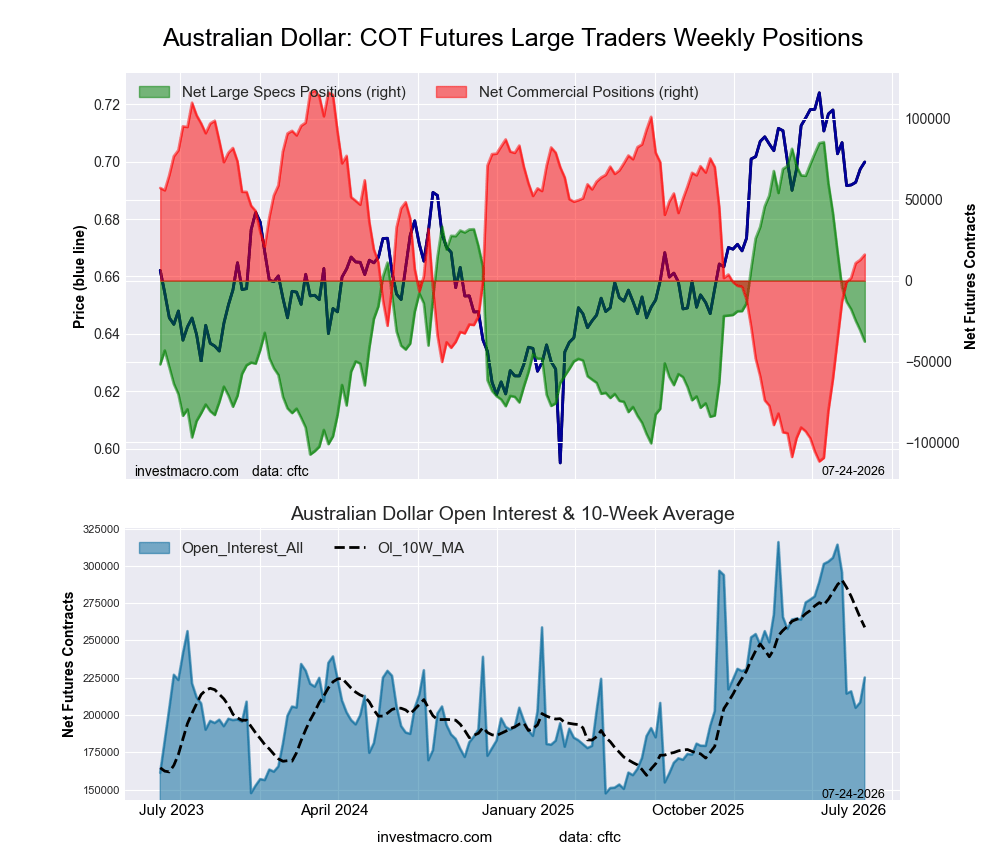 Positioning Notes:
- Australian Dollar large speculator standing this week was a net position of -37,685 contracts in the data reported through Tuesday.
- Weekly Speculator position decline of -6,975 contracts from the previous week which had a total of -30,710 net contracts.
- This week’s current strength score (range over the past 3 years, measured from 0 to 100) shows the speculators are currently Bearish with a score of 36.2 percent.
- The Commercials are Bullish with a score of 55.8 percent.
- The Small Traders (not shown in chart) are Bullish-Extreme with a score of 85.6 percent.
Price Trend-Following Model: Strong Downtrend
Our weekly trend-following model classifies the current market price position as: Strong Downtrend.
| AUSTRALIAN DOLLAR Statistics | SPECULATORS | COMMERCIALS | SMALL TRADERS |
| – Percent of Open Interest Longs: | 29.4 | 51.4 | 16.3 |
| – Percent of Open Interest Shorts: | 46.1 | 44.3 | 6.7 |
| – Net Position: | -37,685 | 16,087 | 21,598 |
| – Gross Longs: | 66,184 | 115,741 | 36,775 |
| – Gross Shorts: | 103,869 | 99,654 | 15,177 |
| – Long to Short Ratio: | 0.6 to 1 | 1.2 to 1 | 2.4 to 1 |
| NET POSITION TREND: | |||
| – Strength Index Score (3 Year Range Pct): | 36.2 | 55.8 | 85.6 |
| – Strength Index Reading (3 Year Range): | Bearish | Bullish | Bullish-Extreme |
| NET POSITION MOVEMENT INDEX: | |||
| – 6-Week Change in Strength Index: | -28.9 | 23.0 | 6.6 |
New Zealand Dollar Futures:
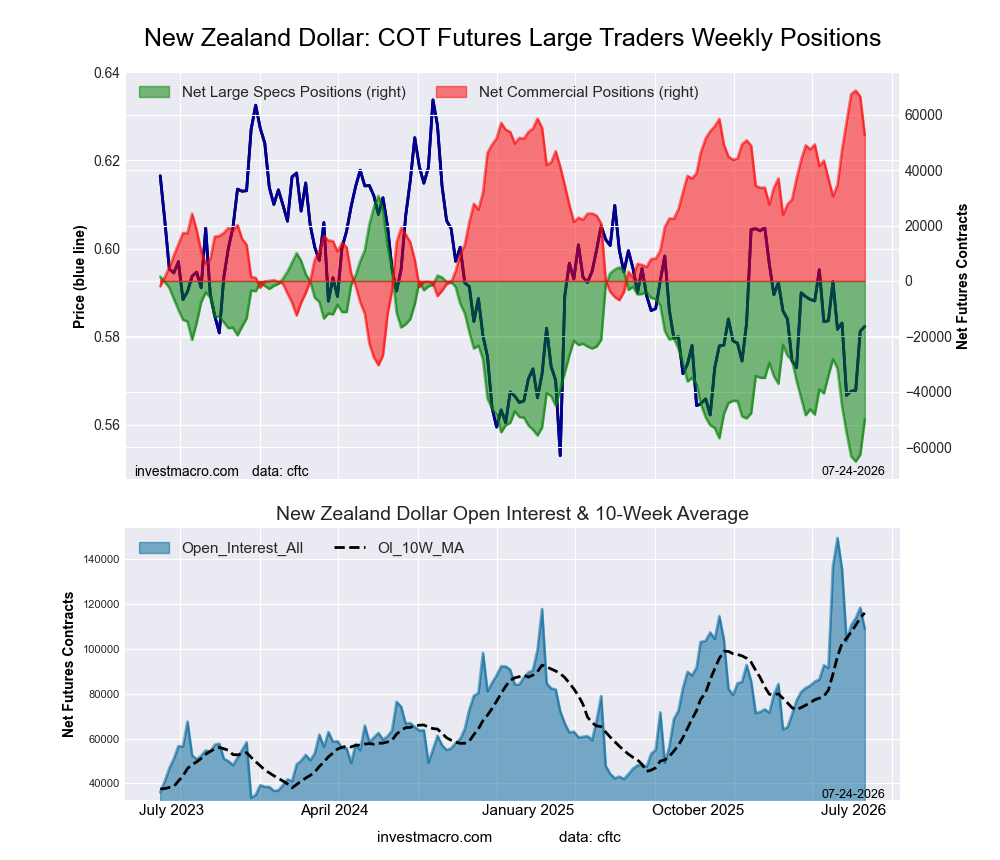 Positioning Notes:
- New Zealand Dollar large speculator standing this week was a net position of -49,969 contracts in the data reported through Tuesday.
- Weekly Speculator position advance of 12,797 contracts from the previous week which had a total of -62,766 net contracts.
- This week’s current strength score (range over the past 3 years, measured from 0 to 100) shows the speculators are currently Bearish-Extreme with a score of 15.9 percent.
- The Commercials are Bullish-Extreme with a score of 83.7 percent.
- The Small Traders (not shown in chart) are Bearish-Extreme with a score of 19.3 percent.
Price Trend-Following Model: Downtrend
Our weekly trend-following model classifies the current market price position as: Downtrend.
| NEW ZEALAND DOLLAR Statistics | SPECULATORS | COMMERCIALS | SMALL TRADERS |
| – Percent of Open Interest Longs: | 7.8 | 88.3 | 2.7 |
| – Percent of Open Interest Shorts: | 53.7 | 39.9 | 5.2 |
| – Net Position: | -49,969 | 52,623 | -2,654 |
| – Gross Longs: | 8,489 | 96,063 | 2,951 |
| – Gross Shorts: | 58,458 | 43,440 | 5,605 |
| – Long to Short Ratio: | 0.1 to 1 | 2.2 to 1 | 0.5 to 1 |
| NET POSITION TREND: | |||
| – Strength Index Score (3 Year Range Pct): | 15.9 | 83.7 | 19.3 |
| – Strength Index Reading (3 Year Range): | Bearish-Extreme | Bullish-Extreme | Bearish-Extreme |
| NET POSITION MOVEMENT INDEX: | |||
| – 6-Week Change in Strength Index: | -19.2 | 18.1 | 6.1 |
Mexican Peso Futures:
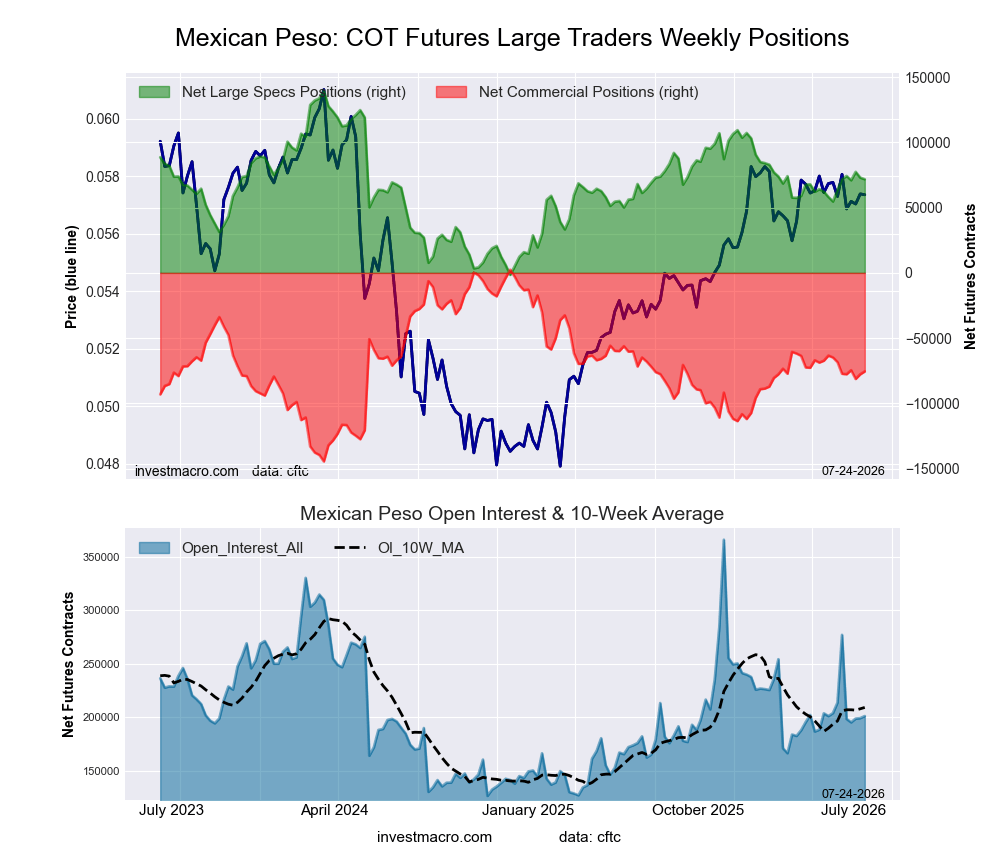 Positioning Notes:
- Mexican Peso large speculator standing this week was a net position of 71,699 contracts in the data reported through Tuesday.
- Weekly Speculator position reduction of -1,256 contracts from the previous week which had a total of 72,955 net contracts.
- This week’s current strength score (range over the past 3 years, measured from 0 to 100) shows the speculators are currently Bullish with a score of 51.9 percent.
- The Commercials are Bearish with a score of 47.0 percent.
- The Small Traders (not shown in chart) are Bullish with a score of 55.3 percent.
Price Trend-Following Model: Uptrend
Our weekly trend-following model classifies the current market price position as: Uptrend.
| MEXICAN PESO Statistics | SPECULATORS | COMMERCIALS | SMALL TRADERS |
| – Percent of Open Interest Longs: | 52.9 | 42.7 | 3.4 |
| – Percent of Open Interest Shorts: | 17.3 | 80.2 | 1.5 |
| – Net Position: | 71,699 | -75,494 | 3,795 |
| – Gross Longs: | 106,600 | 85,999 | 6,900 |
| – Gross Shorts: | 34,901 | 161,493 | 3,105 |
| – Long to Short Ratio: | 3.1 to 1 | 0.5 to 1 | 2.2 to 1 |
| NET POSITION TREND: | |||
| – Strength Index Score (3 Year Range Pct): | 51.9 | 47.0 | 55.3 |
| – Strength Index Reading (3 Year Range): | Bullish | Bearish | Bullish |
| NET POSITION MOVEMENT INDEX: | |||
| – 6-Week Change in Strength Index: | 5.6 | -4.9 | -5.3 |
Brazilian Real Futures:
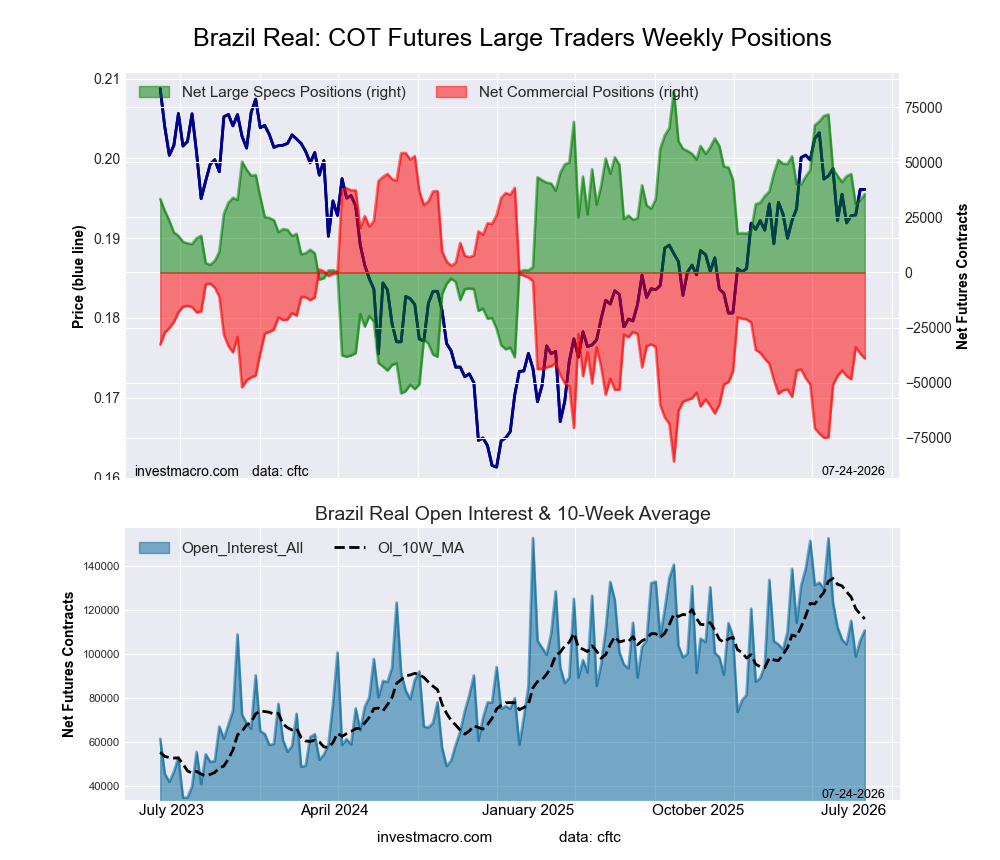 Positioning Notes:
- Brazilian Real large speculator standing this week was a net position of 35,537 contracts in the data reported through Tuesday.
- Weekly Speculator position advance of 2,780 contracts from the previous week which had a total of 32,757 net contracts.
- This week’s current strength score (range over the past 3 years, measured from 0 to 100) shows the speculators are currently Bullish with a score of 65.8 percent.
- The Commercials are Bearish with a score of 33.4 percent.
- The Small Traders (not shown in chart) are Bearish with a score of 40.4 percent.
Price Trend-Following Model: Uptrend
Our weekly trend-following model classifies the current market price position as: Uptrend.
| BRAZIL REAL Statistics | SPECULATORS | COMMERCIALS | SMALL TRADERS |
| – Percent of Open Interest Longs: | 72.7 | 21.7 | 4.3 |
| – Percent of Open Interest Shorts: | 40.6 | 56.9 | 1.1 |
| – Net Position: | 35,537 | -39,038 | 3,501 |
| – Gross Longs: | 80,430 | 23,978 | 4,746 |
| – Gross Shorts: | 44,893 | 63,016 | 1,245 |
| – Long to Short Ratio: | 1.8 to 1 | 0.4 to 1 | 3.8 to 1 |
| NET POSITION TREND: | |||
| – Strength Index Score (3 Year Range Pct): | 65.8 | 33.4 | 40.4 |
| – Strength Index Reading (3 Year Range): | Bullish | Bearish | Bearish |
| NET POSITION MOVEMENT INDEX: | |||
| – 6-Week Change in Strength Index: | -6.0 | 5.6 | 2.3 |
Bitcoin Futures:
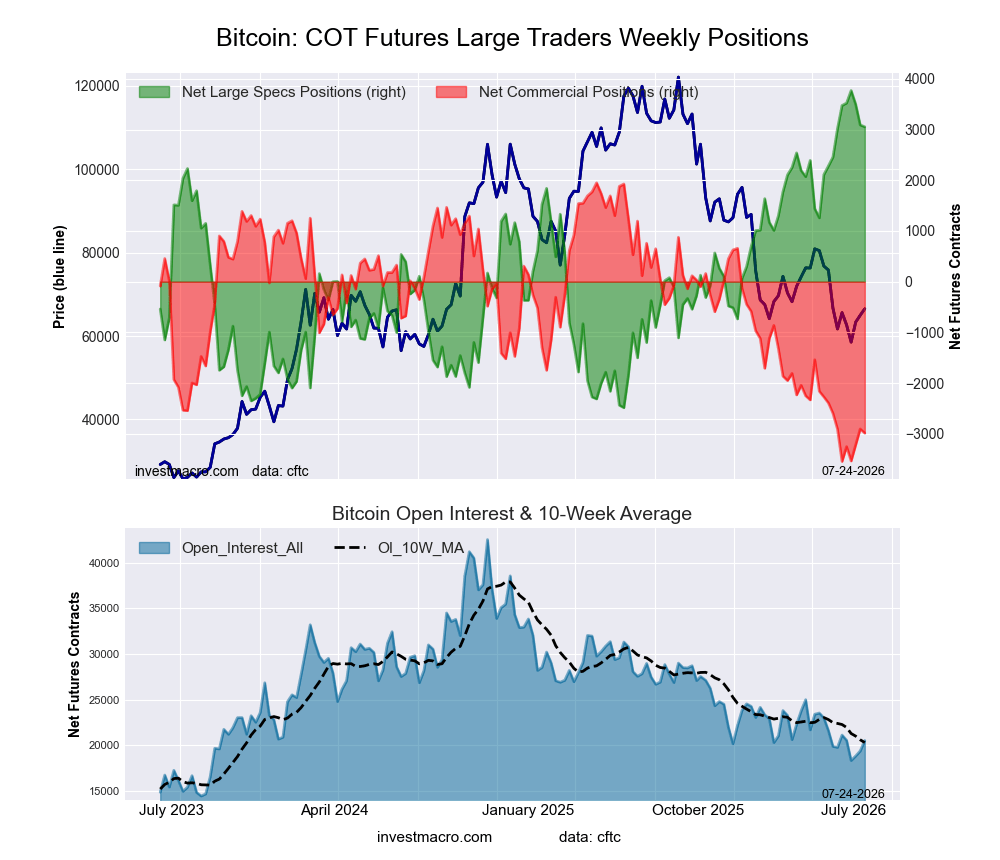 Positioning Notes:
- Bitcoin large speculator standing this week was a net position of 3,054 contracts in the data reported through Tuesday.
- Weekly Speculator position decline of -37 contracts from the previous week which had a total of 3,091 net contracts.
- This week’s current strength score (range over the past 3 years, measured from 0 to 100) shows the speculators are currently Bullish-Extreme with a score of 88.6 percent.
- The Commercials are Bearish-Extreme with a score of 10.2 percent.
- The Small Traders (not shown in chart) are Bearish with a score of 33.8 percent.
Price Trend-Following Model: Strong Downtrend
Our weekly trend-following model classifies the current market price position as: Strong Downtrend.
| BITCOIN Statistics | SPECULATORS | COMMERCIALS | SMALL TRADERS |
| – Percent of Open Interest Longs: | 79.9 | 0.5 | 3.9 |
| – Percent of Open Interest Shorts: | 65.0 | 15.0 | 4.2 |
| – Net Position: | 3,054 | -2,986 | -68 |
| – Gross Longs: | 16,402 | 97 | 793 |
| – Gross Shorts: | 13,348 | 3,083 | 861 |
| – Long to Short Ratio: | 1.2 to 1 | 0.0 to 1 | 0.9 to 1 |
| NET POSITION TREND: | |||
| – Strength Index Score (3 Year Range Pct): | 88.6 | 10.2 | 33.8 |
| – Strength Index Reading (3 Year Range): | Bullish-Extreme | Bearish-Extreme | Bearish |
| NET POSITION MOVEMENT INDEX: | |||
| – 6-Week Change in Strength Index: | 0.6 | -1.5 | 2.3 |
Article By InvestMacro – Receive our weekly COT Reports by Email
*COT Report: The COT data, released weekly to the public each Friday, is updated through the most recent Tuesday (data is 3 days old) and shows a quick view of how large speculators or non-commercials (for-profit traders) were positioned in the futures markets.
The CFTC categorizes trader positions according to commercial hedgers (traders who use futures contracts for hedging as part of the business), non-commercials (large traders who speculate to realize trading profits) and nonreportable traders (usually small traders/speculators) as well as their open interest (contracts open in the market at time of reporting).See CFTC criteria here.
All information and opinions on this website and contained in this article are for general informational purposes only and do not constitute investment advice.

- COT Metals Charts: Weekly Speculator Changes led by Copper Jul 26, 2026
- COT Bonds Charts: Speculator Bets led by SOFR 3-Months & 5-Year Bonds Jul 26, 2026
- COT Energy Charts: Weekly Speculator Bets led by WTI Crude & Natural Gas Jul 26, 2026
- COT Soft Commodities Charts: Weekly Speculator Bets led by Corn & Soybeans Jul 26, 2026
- The US introduces new import tariffs for 60 countries. Brent crude surpasses $100 per barrel Jul 24, 2026
- USD/JPY Breaks Records: Nothing Slows the Yen’s Decline Jul 24, 2026
- Oil prices reached a 6‑week high. The AUD strengthened on the back of a strong labor‑market report Jul 23, 2026
- EUR/USD Recovers as Dollar Weakens Jul 23, 2026
- Bitcoin rose to $66,000. The New Zealand dollar continues to strengthen Jul 22, 2026
- Inflationary pressure is easing in Canada. In New Zealand, on the contrary, inflation is rising Jul 21, 2026
