
By InvestMacro
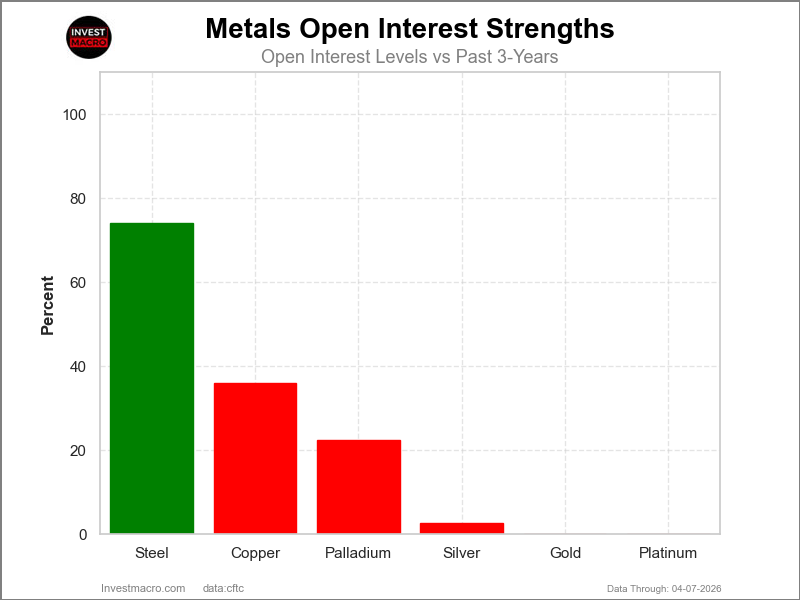
Open Interest (OI) is the amount of contracts that are currently live in the marketplace. OI Strength shows the current strength compared to the past 3-years.
Here are the latest charts and statistics for the Commitment of Traders (COT) data published by the Commodities Futures Trading Commission (CFTC).
The latest COT data is updated through Tuesday April 7thand shows a quick view of how large traders (for-profit speculators and commercial entities) were positioned in the futures markets.
Weekly Speculator Changes led by Platinum & Steel
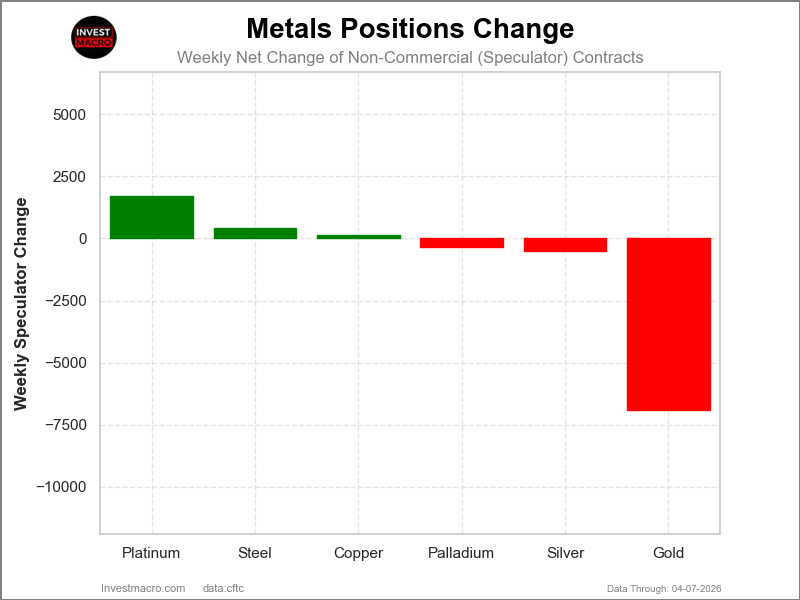
The COT metals markets speculator bets were mixed this week as three out of the six metals markets we cover had higher positioning while the other three markets had lower speculator contracts.
Leading the gains for the metals was Platinum (1,701 contracts) with Steel (420 contracts) and Copper (123 contracts) also showing positive weeks.
Free Reports:
 Download Our Metatrader 4 Indicators – Put Our Free MetaTrader 4 Custom Indicators on your charts when you join our Weekly Newsletter
 Get our Weekly Commitment of Traders Reports - See where the biggest traders (Hedge Funds and Commercial Hedgers) are positioned in the futures markets on a weekly basis.
The markets with declines in speculator bets for the week were Gold (-6,897 contracts), Silver (-487 contracts) and with Palladium (-343 contracts) also seeing lower bets on the week.
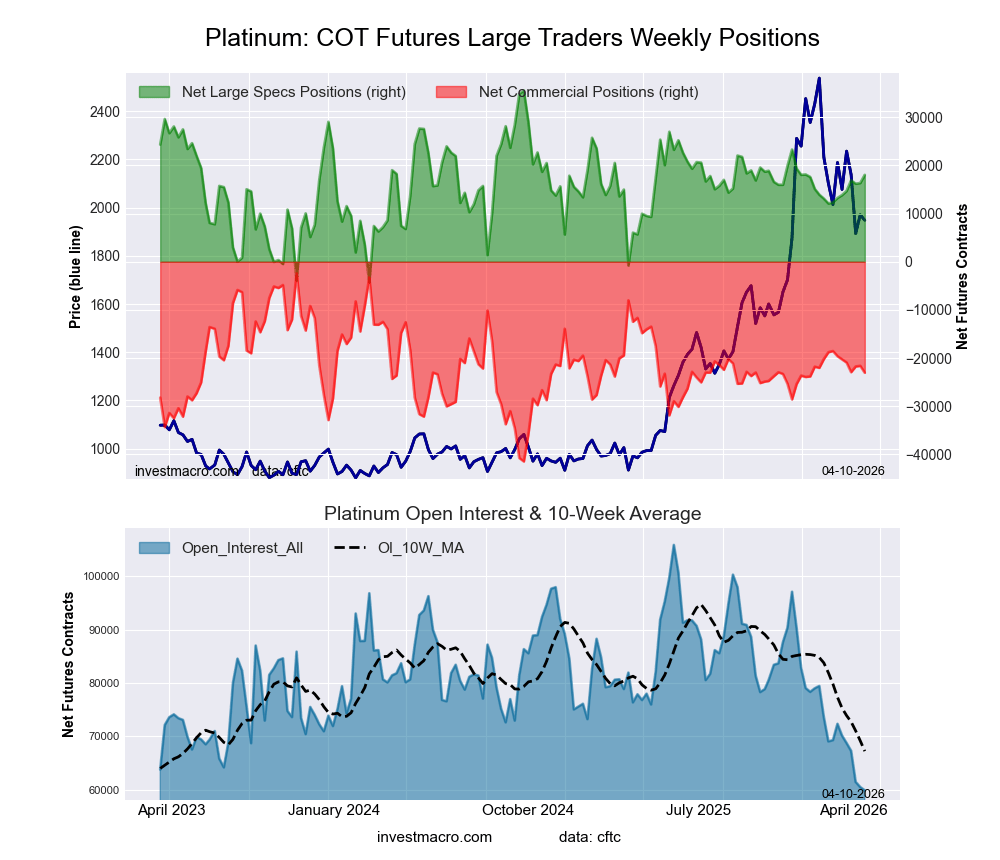
Platinum Bets rise for 7th out of last 8 weeks
Highlighting the Metals market speculative positions this week was Platinum, which saw speculator bets rise higher for a second straight week as well as the seventh time out of the past eight weeks. Platinum bets have now risen to a net standing of over +18,000 contracts, and this week’s level marks the most bullish position of the past 13 weeks dating back to January 6th. The Platinum positioning has now been above +10,000 net contracts for 47 consecutive weeks, dating back to May 13th of 2025.
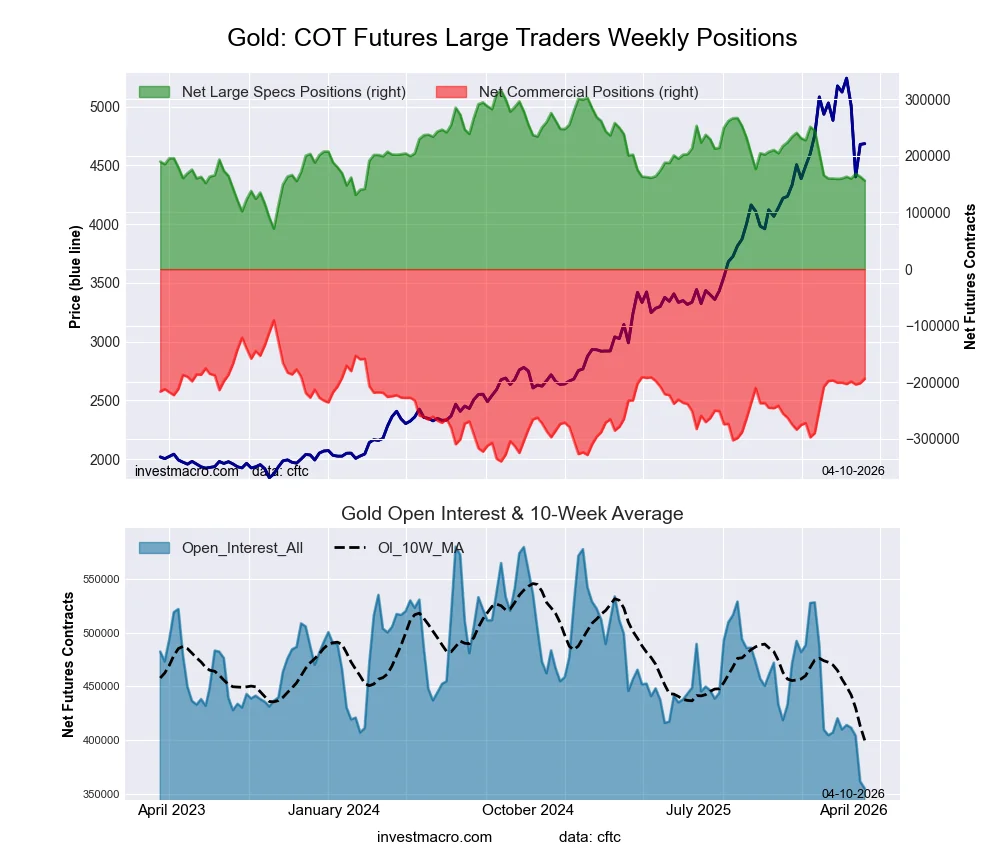
Gold positions fell this week for the second consecutive week and for the third time out of the last four weeks. Gold speculator positioning has cooled off significantly since January, when the net position was a total of 251,238 contracts on January 13th to this week’s standing of 156,305 contracts, a difference of -94,933 contracts being subtracted from the overall net bullish position. The Gold position has now had less than +200,000 contracts for 10 straight weeks, and this week marked the lowest level of bullish net contracts since February 2024.
The Metals Markets’ price performance was higher across the board.
In the metals markets, prices were higher across the board as a ceasefire in the Iran war seemed to give relief to the metals’ recent price slides. Silver was the biggest winner on the week with a 6.17% gain while Copper came in second with a 4.65% rise for the week. Platinum was a close third with a 4.24% gain. Gold was higher by 2.65%, followed by Steel, which got a boost of 2.34%, and then Palladium rounded out the gainers with a 2.12% increase for the week.
Metals Data:
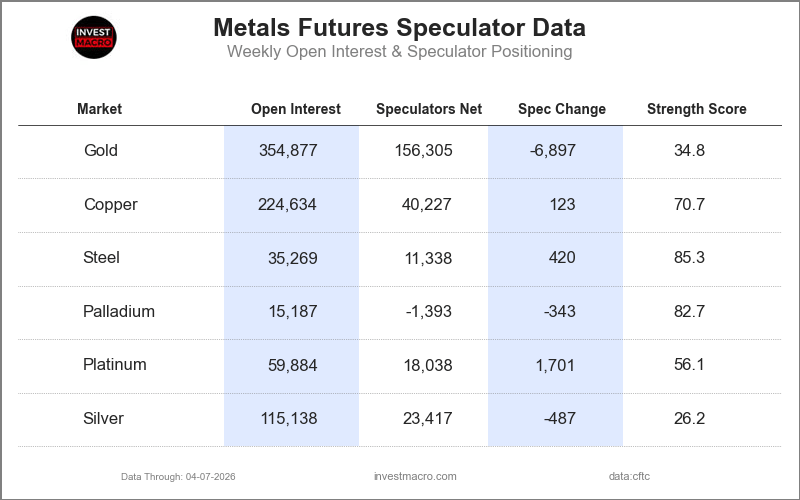
Legend: Weekly Speculators Change | Speculators Current Net Position | Speculators Strength Score compared to last 3-Years (0-100 range)
Strength Scores led by Steel & Palladium
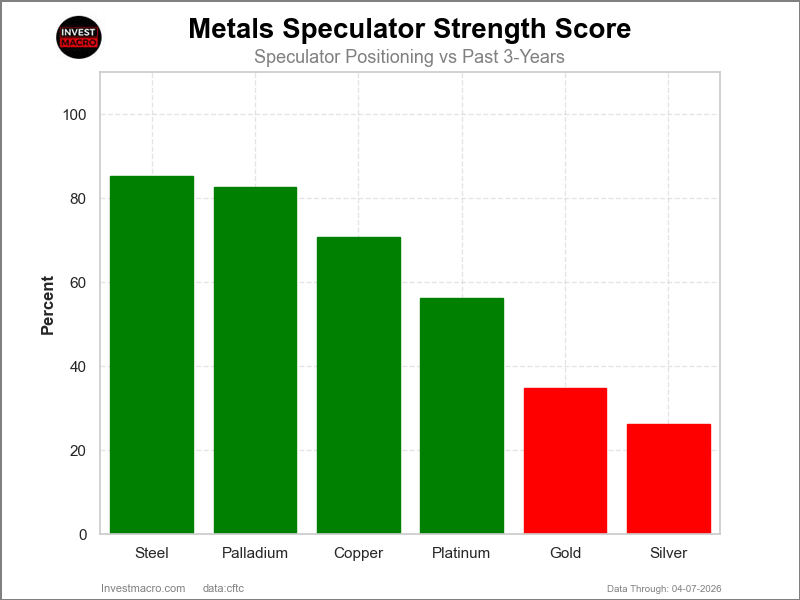
COT Strength Scores (a normalized measure of Speculator positions over a 3-Year range, from 0 to 100 where above 80 is Extreme-Bullish and below 20 is Extreme-Bearish) showed that Steel (85 percent) and Palladium (83 percent) lead the metals markets this week. Copper (71 percent) comes in as the next highest in the weekly strength scores.
On the downside, Silver (26 percent) and Gold (35 percent) come in at the lowest strength level currently.
Strength Statistics:
Gold (34.8 percent) vs Gold previous week (37.6 percent)
Silver (26.2 percent) vs Silver previous week (27.0 percent)
Copper (70.7 percent) vs Copper previous week (70.6 percent)
Platinum (56.1 percent) vs Platinum previous week (51.9 percent)
Palladium (82.7 percent) vs Palladium previous week (85.0 percent)
Steel (85.3 percent) vs Steel previous week (83.4 percent)
Platinum & Silver top the 6-Week Strength Trends
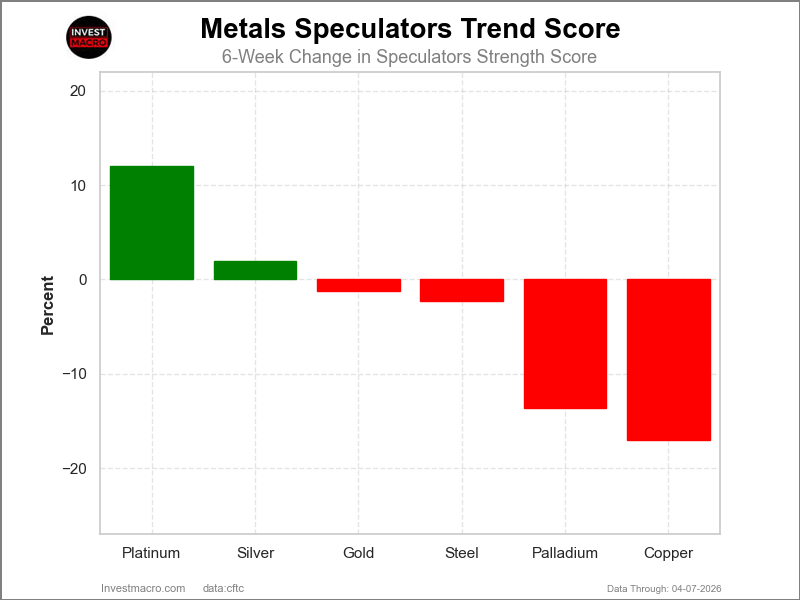
COT Strength Score Trends (or move index, calculates the 6-week changes in strength scores) showed that Platinum (12 percent) and Silver (2 percent) lead the past six weeks trends for metals.
Copper (-17 percent) leads the downside trend scores currently with Palladium (-14 percent) as the next market with lower trend scores.
Move Statistics:
Gold (-1.2 percent) vs Gold previous week (1.3 percent)
Silver (2.0 percent) vs Silver previous week (-0.2 percent)
Copper (-17.0 percent) vs Copper previous week (-17.9 percent)
Platinum (12.0 percent) vs Platinum previous week (10.0 percent)
Palladium (-13.6 percent) vs Palladium previous week (-10.2 percent)
Steel (-2.3 percent) vs Steel previous week (-3.8 percent)
Individual Markets:
Gold Comex Futures Futures:
 Positioning Notes:
- Gold Comex Futures large speculator standing this week was a net position of 156,305 contracts in the data reported through Tuesday.
- Weekly Speculator position fall of -6,897 contracts from the previous week which had a total of 163,202 net contracts.
- This week’s current strength score (range over the past 3 years, measured from 0 to 100) shows the speculators are currently Bearish with a score of 34.8 percent.
- The Commercials are Bullish with a score of 58.6 percent.
- The Small Traders (not shown in chart) are Bullish with a score of 75.4 percent.
Price Trend-Following Model: Uptrend
Our weekly trend-following model classifies the current market price position as: Uptrend.
| Gold Futures Statistics | SPECULATORS | COMMERCIALS | SMALL TRADERS |
| – Percent of Open Interest Longs: | 57.9 | 16.3 | 13.8 |
| – Percent of Open Interest Shorts: | 13.8 | 70.9 | 3.3 |
| – Net Position: | 156,305 | -193,751 | 37,446 |
| – Gross Longs: | 205,368 | 57,729 | 49,117 |
| – Gross Shorts: | 49,063 | 251,480 | 11,671 |
| – Long to Short Ratio: | 4.2 to 1 | 0.2 to 1 | 4.2 to 1 |
| NET POSITION TREND: | |||
| – Strength Index Score (3 Year Range Pct): | 34.8 | 58.6 | 75.4 |
| – Strength Index Reading (3 Year Range): | Bearish | Bullish | Bullish |
| NET POSITION MOVEMENT INDEX: | |||
| – 6-Week Change in Strength Index: | -1.2 | 2.8 | -12.2 |
Silver Comex Futures Futures:
 Positioning Notes:
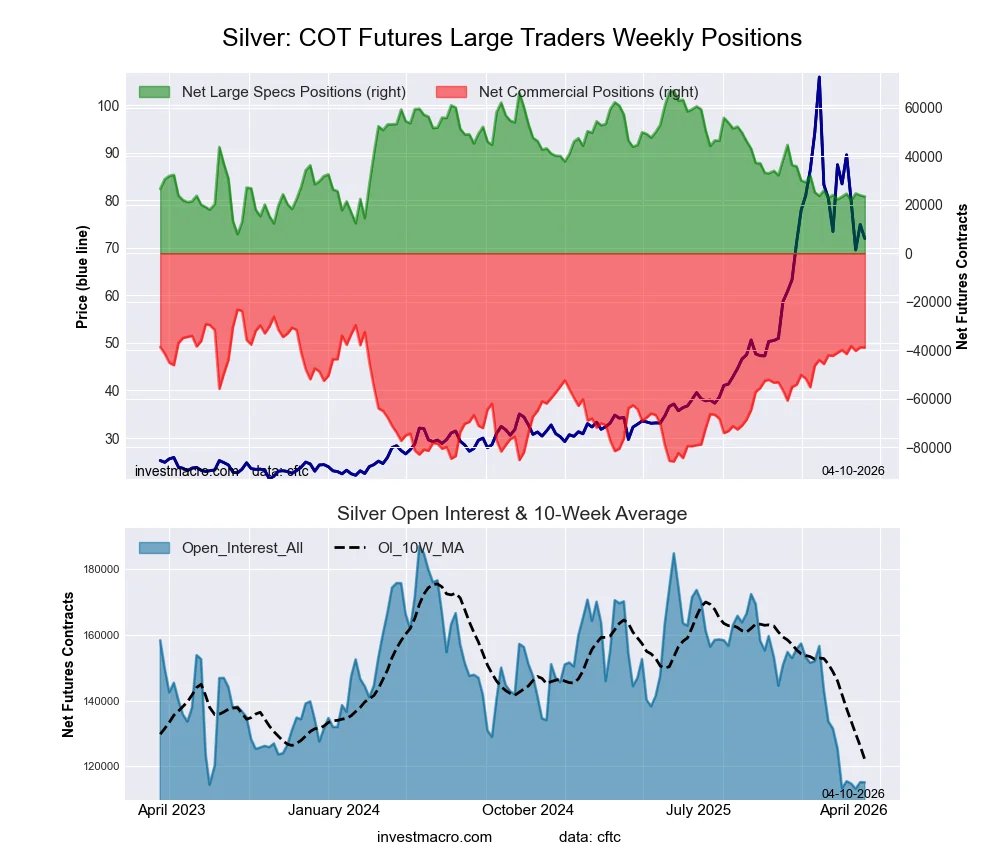
- Silver Comex Futures large speculator standing this week was a net position of 23,417 contracts in the data reported through Tuesday.
- Weekly Speculator position decrease of -487 contracts from the previous week which had a total of 23,904 net contracts.
- This week’s current strength score (range over the past 3 years, measured from 0 to 100) shows the speculators are currently Bearish with a score of 26.2 percent.
- The Commercials are Bullish with a score of 75.0 percent.
- The Small Traders (not shown in chart) are Bearish with a score of 38.0 percent.
Price Trend-Following Model: Weak Uptrend
Our weekly trend-following model classifies the current market price position as: Weak Uptrend.
| Silver Futures Statistics | SPECULATORS | COMMERCIALS | SMALL TRADERS |
| – Percent of Open Interest Longs: | 28.5 | 24.5 | 21.6 |
| – Percent of Open Interest Shorts: | 8.2 | 58.3 | 8.2 |
| – Net Position: | 23,417 | -38,915 | 15,498 |
| – Gross Longs: | 32,810 | 28,211 | 24,908 |
| – Gross Shorts: | 9,393 | 67,126 | 9,410 |
| – Long to Short Ratio: | 3.5 to 1 | 0.4 to 1 | 2.6 to 1 |
| NET POSITION TREND: | |||
| – Strength Index Score (3 Year Range Pct): | 26.2 | 75.0 | 38.0 |
| – Strength Index Reading (3 Year Range): | Bearish | Bullish | Bearish |
| NET POSITION MOVEMENT INDEX: | |||
| – 6-Week Change in Strength Index: | 2.0 | 3.5 | -18.4 |
Copper Grade #1 Futures Futures:
 Positioning Notes:
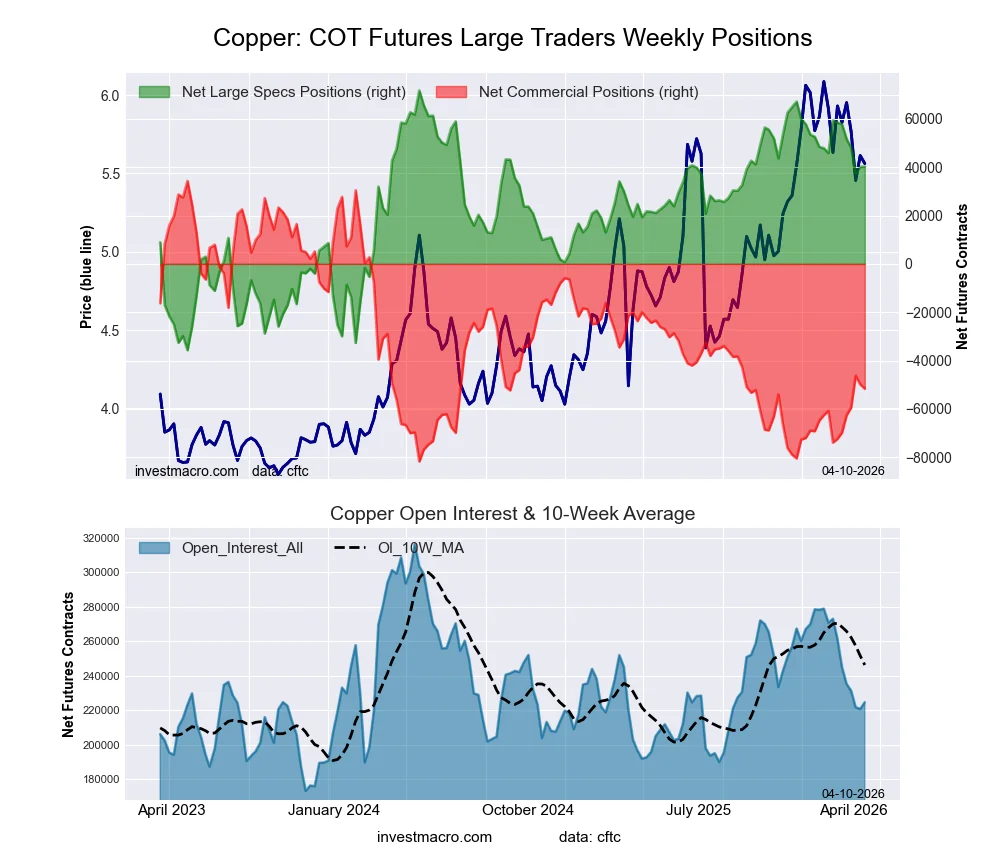
- Copper Grade #1 Futures large speculator standing this week was a net position of 40,227 contracts in the data reported through Tuesday.
- Weekly Speculator position increase of 123 contracts from the previous week which had a total of 40,104 net contracts.
- This week’s current strength score (range over the past 3 years, measured from 0 to 100) shows the speculators are currently Bullish with a score of 70.7 percent.
- The Commercials are Bearish with a score of 26.0 percent.
- The Small Traders (not shown in chart) are Bullish with a score of 73.1 percent.
Price Trend-Following Model: Uptrend
Our weekly trend-following model classifies the current market price position as: Uptrend.
| Copper Futures Statistics | SPECULATORS | COMMERCIALS | SMALL TRADERS |
| – Percent of Open Interest Longs: | 32.3 | 37.4 | 9.2 |
| – Percent of Open Interest Shorts: | 14.4 | 60.4 | 4.1 |
| – Net Position: | 40,227 | -51,615 | 11,388 |
| – Gross Longs: | 72,637 | 84,019 | 20,588 |
| – Gross Shorts: | 32,410 | 135,634 | 9,200 |
| – Long to Short Ratio: | 2.2 to 1 | 0.6 to 1 | 2.2 to 1 |
| NET POSITION TREND: | |||
| – Strength Index Score (3 Year Range Pct): | 70.7 | 26.0 | 73.1 |
| – Strength Index Reading (3 Year Range): | Bullish | Bearish | Bullish |
| NET POSITION MOVEMENT INDEX: | |||
| – 6-Week Change in Strength Index: | -17.0 | 17.9 | -13.0 |
Platinum Futures Futures:
 Positioning Notes:
- Platinum Futures large speculator standing this week was a net position of 18,038 contracts in the data reported through Tuesday.
- Weekly Speculator position boost of 1,701 contracts from the previous week which had a total of 16,337 net contracts.
- This week’s current strength score (range over the past 3 years, measured from 0 to 100) shows the speculators are currently Bullish with a score of 56.1 percent.
- The Commercials are Bearish with a score of 47.1 percent.
- The Small Traders (not shown in chart) are Bullish with a score of 56.1 percent.
Price Trend-Following Model: Weak Uptrend
Our weekly trend-following model classifies the current market price position as: Weak Uptrend.
| Platinum Futures Statistics | SPECULATORS | COMMERCIALS | SMALL TRADERS |
| – Percent of Open Interest Longs: | 45.5 | 29.0 | 12.9 |
| – Percent of Open Interest Shorts: | 15.4 | 67.5 | 4.6 |
| – Net Position: | 18,038 | -23,034 | 4,996 |
| – Gross Longs: | 27,259 | 17,393 | 7,735 |
| – Gross Shorts: | 9,221 | 40,427 | 2,739 |
| – Long to Short Ratio: | 3.0 to 1 | 0.4 to 1 | 2.8 to 1 |
| NET POSITION TREND: | |||
| – Strength Index Score (3 Year Range Pct): | 56.1 | 47.1 | 56.1 |
| – Strength Index Reading (3 Year Range): | Bullish | Bearish | Bullish |
| NET POSITION MOVEMENT INDEX: | |||
| – 6-Week Change in Strength Index: | 12.0 | -8.8 | -15.8 |
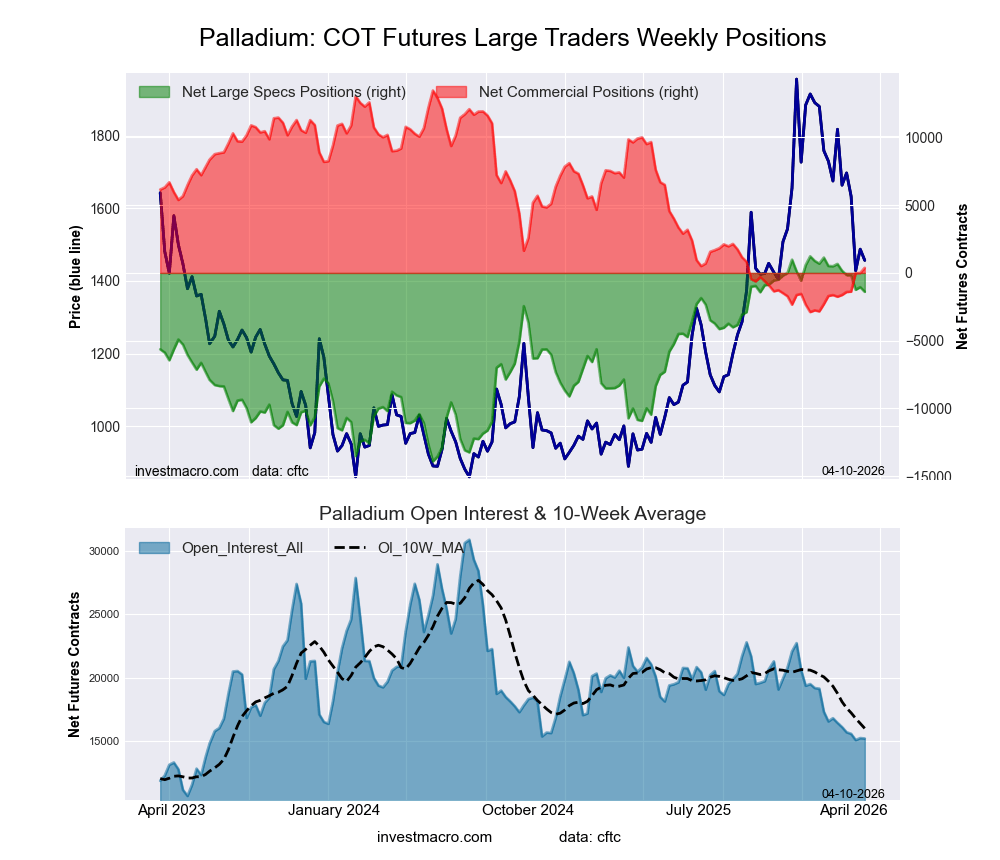
Palladium Futures Futures:
 Positioning Notes:
- Palladium Futures large speculator standing this week was a net position of -1,393 contracts in the data reported through Tuesday.
- Weekly Speculator position fall of -343 contracts from the previous week which had a total of -1,050 net contracts.
- This week’s current strength score (range over the past 3 years, measured from 0 to 100) shows the speculators are currently Bullish-Extreme with a score of 82.7 percent.
- The Commercials are Bearish-Extreme with a score of 20.0 percent.
- The Small Traders (not shown in chart) are Bullish with a score of 55.3 percent.
Price Trend-Following Model: Strong Downtrend
Our weekly trend-following model classifies the current market price position as: Strong Downtrend.
| Palladium Futures Statistics | SPECULATORS | COMMERCIALS | SMALL TRADERS |
| – Percent of Open Interest Longs: | 43.8 | 37.2 | 14.7 |
| – Percent of Open Interest Shorts: | 53.0 | 34.8 | 8.0 |
| – Net Position: | -1,393 | 375 | 1,018 |
| – Gross Longs: | 6,655 | 5,655 | 2,228 |
| – Gross Shorts: | 8,048 | 5,280 | 1,210 |
| – Long to Short Ratio: | 0.8 to 1 | 1.1 to 1 | 1.8 to 1 |
| NET POSITION TREND: | |||
| – Strength Index Score (3 Year Range Pct): | 82.7 | 20.0 | 55.3 |
| – Strength Index Reading (3 Year Range): | Bullish-Extreme | Bearish-Extreme | Bullish |
| NET POSITION MOVEMENT INDEX: | |||
| – 6-Week Change in Strength Index: | -13.6 | 13.0 | -2.6 |
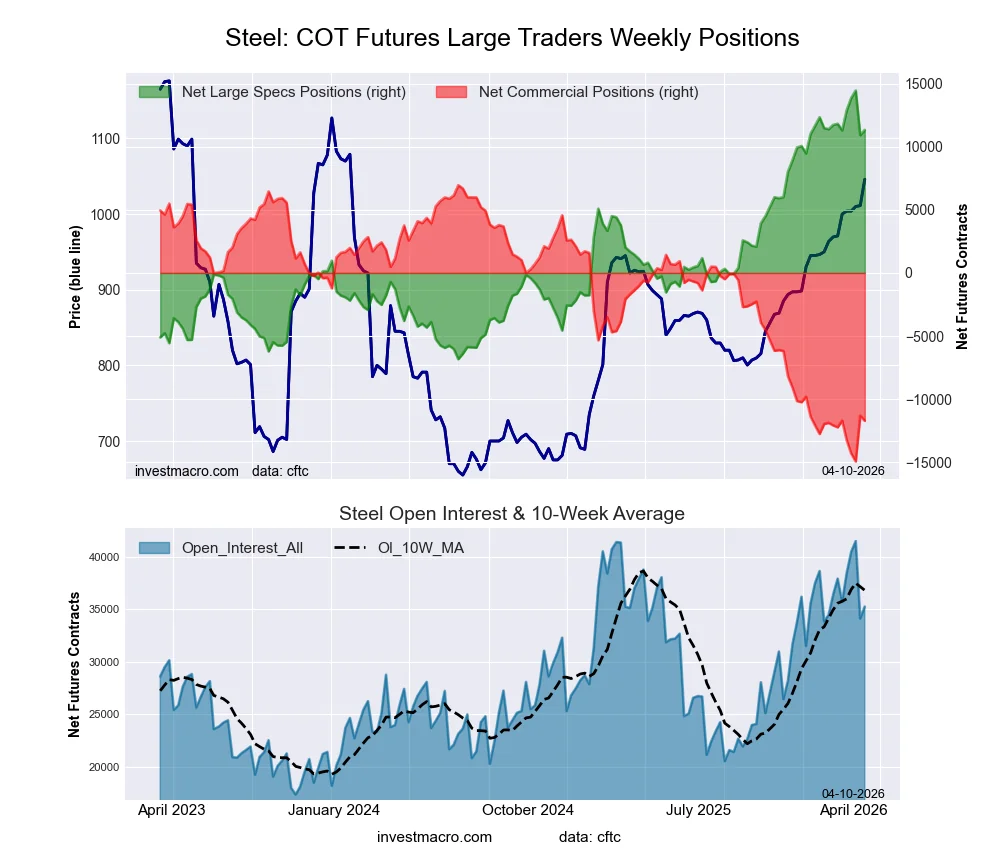
Steel Futures Futures:
 Positioning Notes:
- Steel Futures large speculator standing this week was a net position of 11,338 contracts in the data reported through Tuesday.
- Weekly Speculator position advance of 420 contracts from the previous week which had a total of 10,918 net contracts.
- This week’s current strength score (range over the past 3 years, measured from 0 to 100) shows the speculators are currently Bullish-Extreme with a score of 85.3 percent.
- The Commercials are Bearish-Extreme with a score of 14.7 percent.
- The Small Traders (not shown in chart) are Bullish-Extreme with a score of 86.7 percent.
Price Trend-Following Model: Strong Uptrend
Our weekly trend-following model classifies the current market price position as: Strong Uptrend.
| Steel Futures Statistics | SPECULATORS | COMMERCIALS | SMALL TRADERS |
| – Percent of Open Interest Longs: | 34.3 | 61.7 | 1.3 |
| – Percent of Open Interest Shorts: | 2.2 | 94.9 | 0.2 |
| – Net Position: | 11,338 | -11,727 | 389 |
| – Gross Longs: | 12,103 | 21,746 | 472 |
| – Gross Shorts: | 765 | 33,473 | 83 |
| – Long to Short Ratio: | 15.8 to 1 | 0.6 to 1 | 5.7 to 1 |
| NET POSITION TREND: | |||
| – Strength Index Score (3 Year Range Pct): | 85.3 | 14.7 | 86.7 |
| – Strength Index Reading (3 Year Range): | Bullish-Extreme | Bearish-Extreme | Bullish-Extreme |
| NET POSITION MOVEMENT INDEX: | |||
| – 6-Week Change in Strength Index: | -2.3 | 2.3 | -3.3 |
Article By InvestMacro – Receive our weekly COT Newsletter
*COT Report: The COT data, released weekly to the public each Friday, is updated through the most recent Tuesday (data is 3 days old) and shows a quick view of how large speculators or non-commercials (for-profit traders) were positioned in the futures markets.
The CFTC categorizes trader positions according to commercial hedgers (traders who use futures contracts for hedging as part of the business), non-commercials (large traders who speculate to realize trading profits) and nonreportable traders (usually small traders/speculators) as well as their open interest (contracts open in the market at time of reporting). See CFTC criteria here.

- The US Tech sector hit by sell‑off. Oil prices decline on renewed negotiations Jul 28, 2026
- Gold Declines, Focus on Fed and Falling Oil Prices Jul 28, 2026
- This week will be one of the most crowded for central‑bank meetings Jul 27, 2026
- EUR/USD Ahead of a Key Week: Holding Near Lows Jul 27, 2026
- COT Metals Charts: Weekly Speculator Changes led by Copper Jul 26, 2026
- COT Bonds Charts: Speculator Bets led by SOFR 3-Months & 5-Year Bonds Jul 26, 2026
- COT Energy Charts: Weekly Speculator Bets led by WTI Crude & Natural Gas Jul 26, 2026
- COT Soft Commodities Charts: Weekly Speculator Bets led by Corn & Soybeans Jul 26, 2026
- The US introduces new import tariffs for 60 countries. Brent crude surpasses $100 per barrel Jul 24, 2026
- USD/JPY Breaks Records: Nothing Slows the Yen’s Decline Jul 24, 2026