By InvestMacro
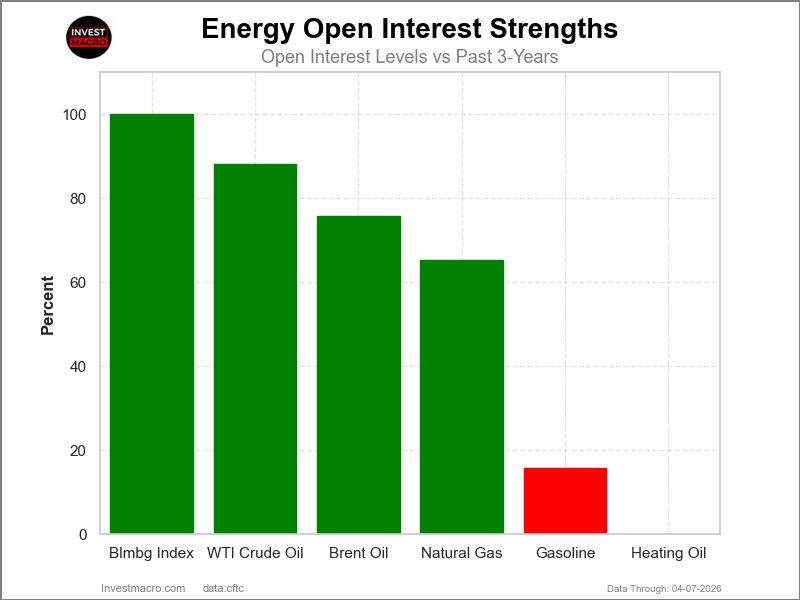
Open Interest (OI) is the amount of contracts that are currently live in the marketplace. OI Strength shows the current strength compared to the past 3-years.
Here are the latest charts and statistics for the Commitment of Traders (COT) data published by the Commodities Futures Trading Commission (CFTC).
The latest COT data is updated through Tuesday April 7th and shows a quick view of how large traders (for-profit speculators and commercial entities) were positioned in the futures markets.
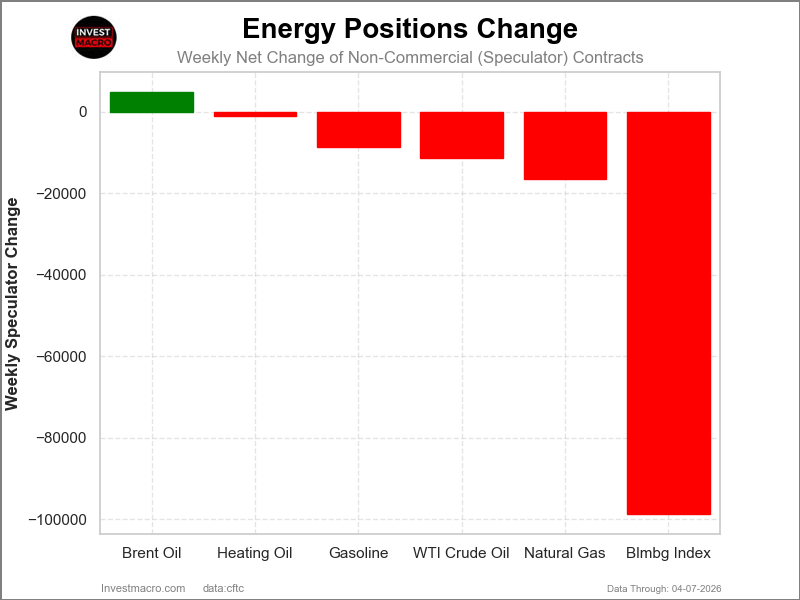
The COT energy market speculator bets were overall lower this week as just one out of the six energy markets we cover had higher positioning while the other five markets had lower speculator contracts.
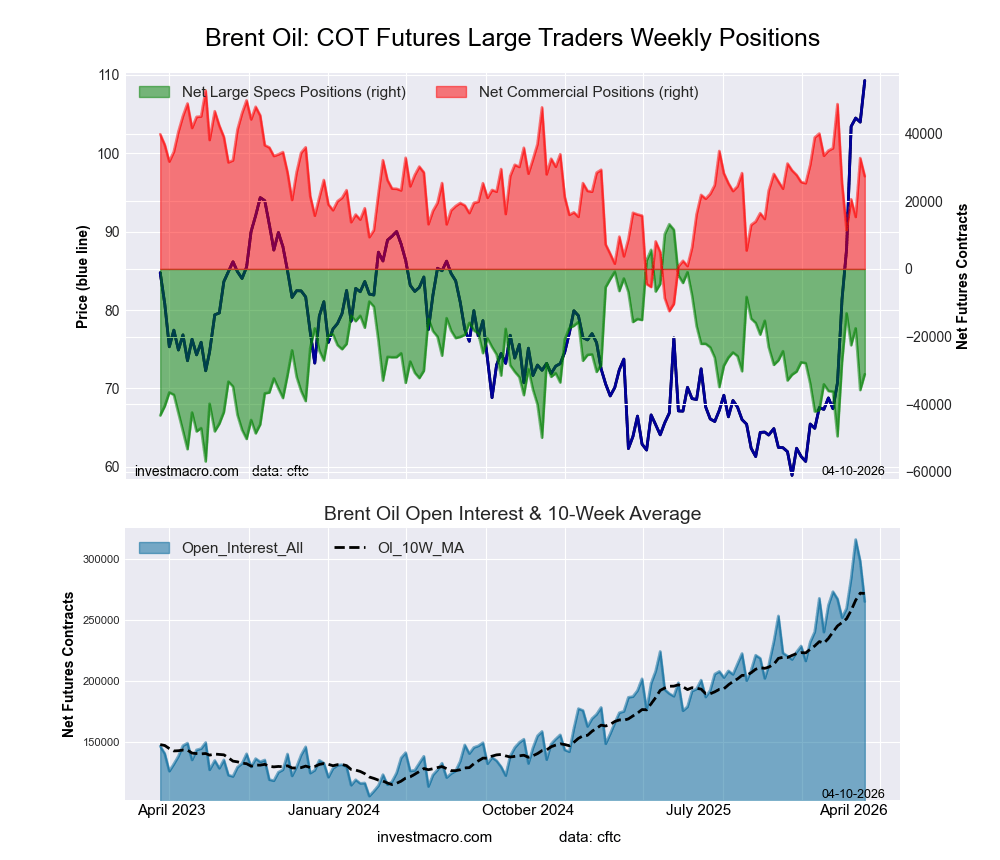
Leading the gains for the energy markets was Brent Oil with a gain of 4,691 contracts.
Free Reports:
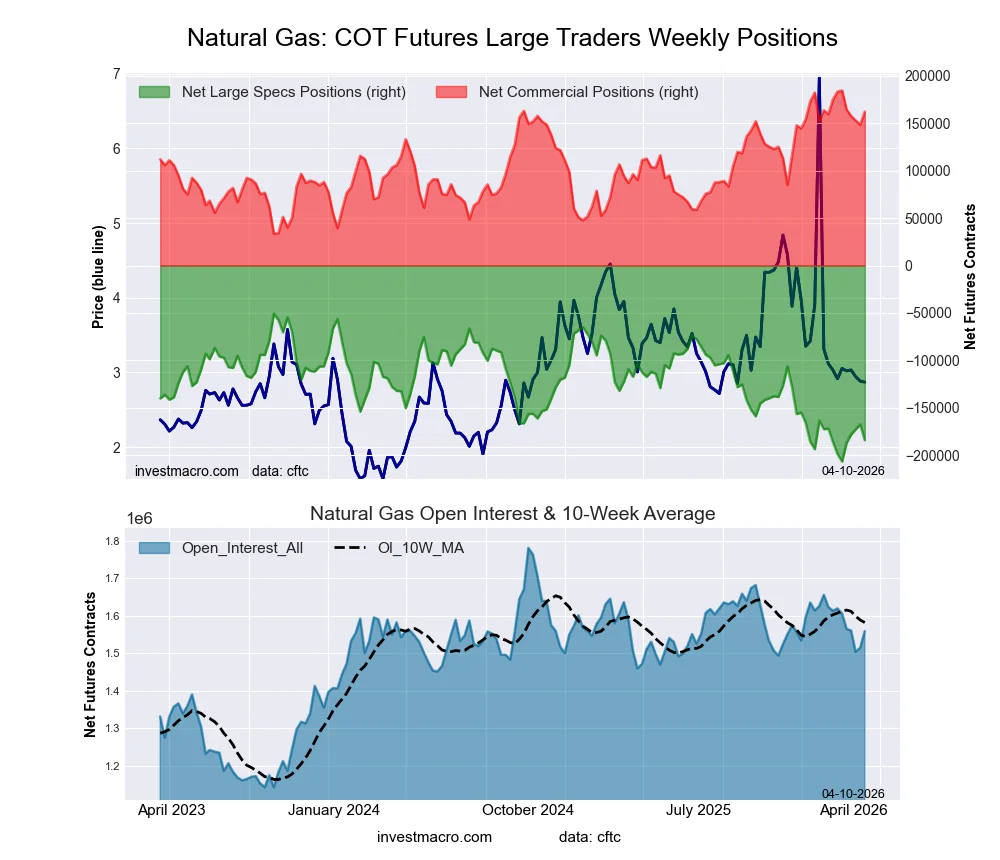
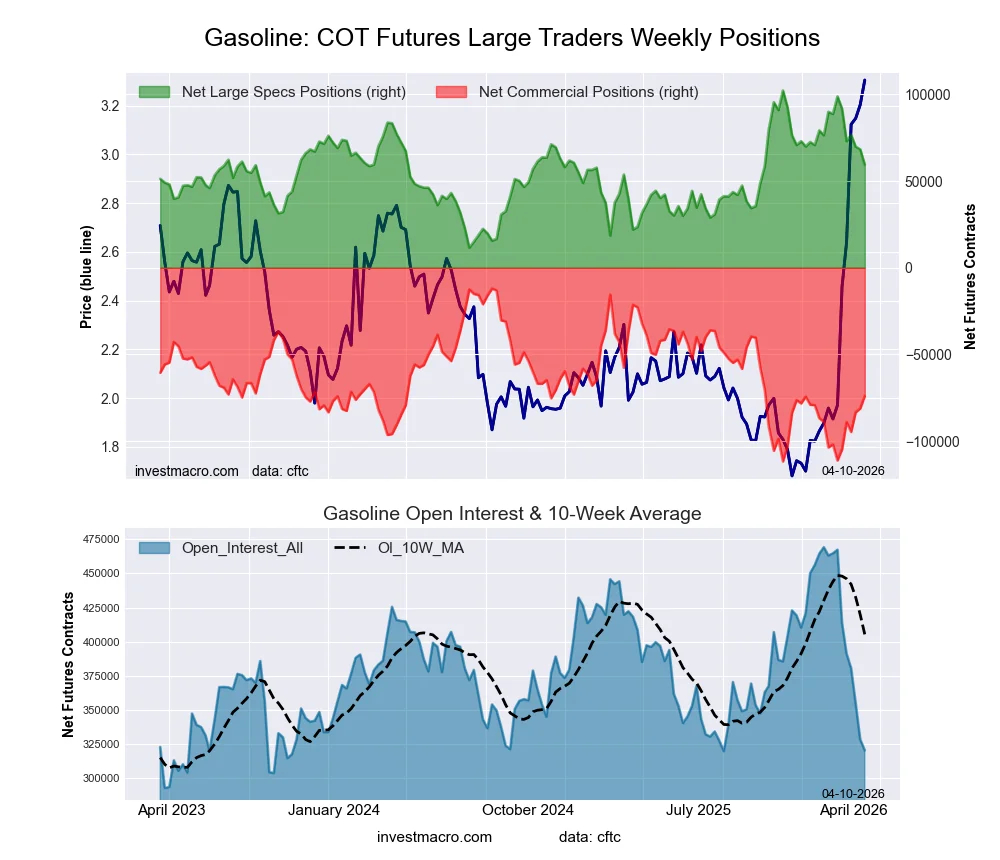
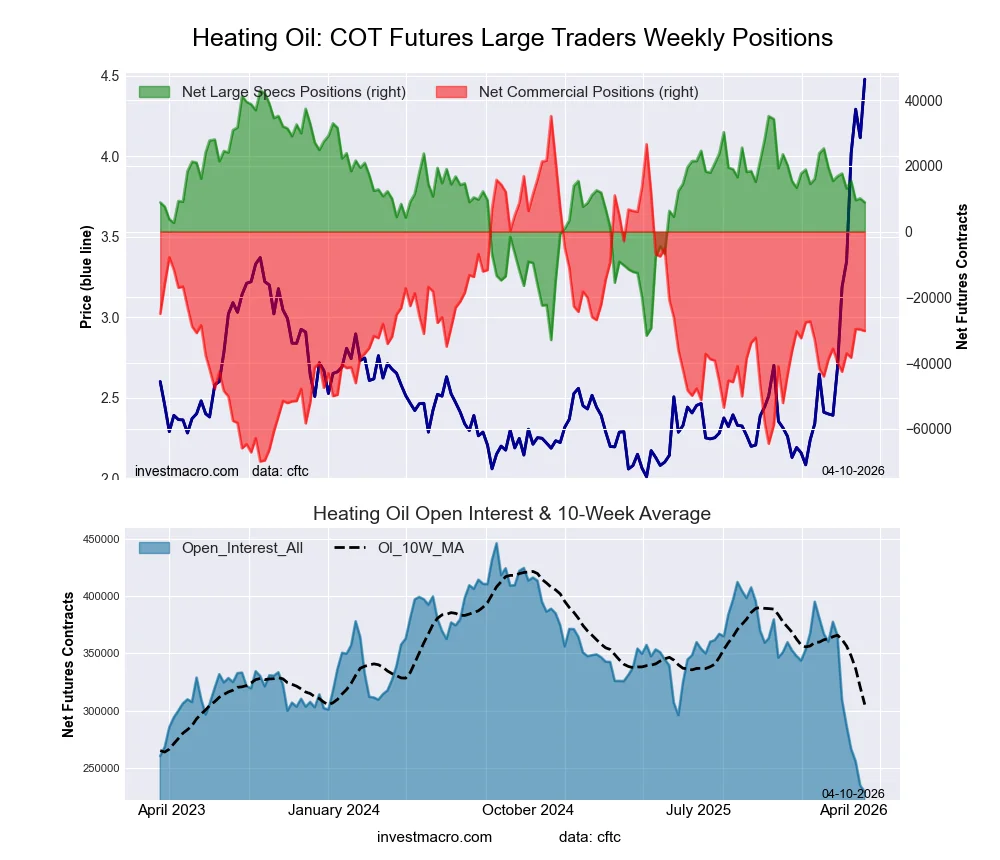
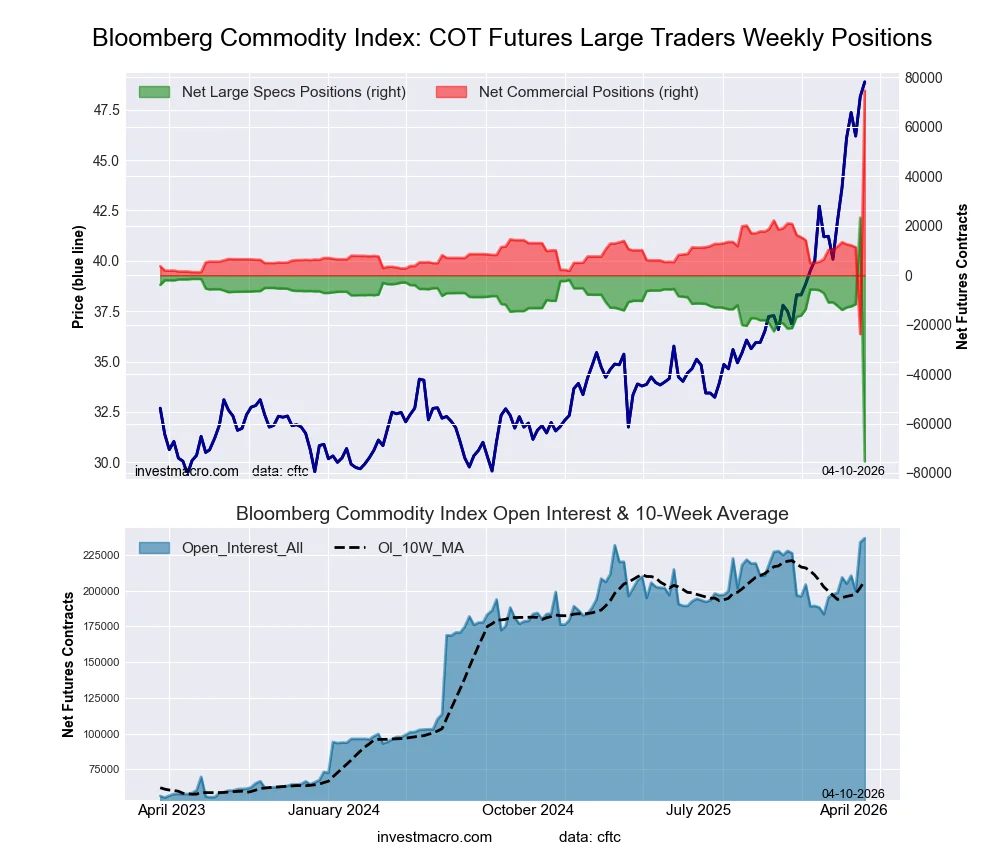
The markets with declines in speculator bets for the week were the Bloomberg Index (-98,639 contracts), Natural Gas (-16,531 contracts), WTI Crude (-11,335 contracts), Gasoline (-8,734 contracts) and Heating Oil (-1,205 contracts) also seeing lower bets on the week.
Highlighting the Energy market changes this week was Brent Oil, which was the only market with a positive week in speculator bets. Brent Oil saw a sharp drop by over -18,000 contracts last week (March 31st) and rebounded by almost +5,000 contracts this week. Overall, the Brent Crude Oil speculator position remains in negative territory as this market is usually negative and incorporates a lot of hedging activity.
Next up, the Bloomberg Commodity Index positions dropped by the most on record, falling by almost -100,000 contracts this week after seeing an influx of positions by over +35,000 contracts last week (March 31st). The Bloomberg Commodity Index bets fell by -98,639 contracts this week, bringing the overall net position standing to -75,342 contracts. This means the Bloomberg Commodity Index is now at the lowest or most bearish level on record dating back to 2016, according to CFTC data.
In the energy markets, Gasoline fell the least this week with a -3.47% decline, followed by the Bloomberg Commodity Index, which retreated by -4.46%. Natural Gas was down by over 6% with a drop by -6.13%.
The biggest losers on the week and most significantly affected by the Iran war ceasefire, were Brent Oil which fell by -13.91%, WTI Crude Oil, which dropped by -14.09%, and Heating Oil, which decreased strongly by -16.45% over the past five days.
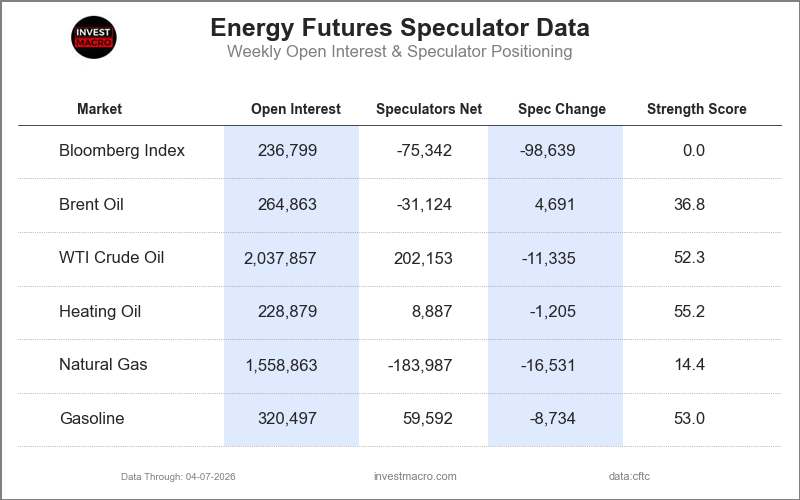
Legend: Weekly Speculators Change | Speculators Current Net Position | Speculators Strength Score compared to last 3-Years (0-100 range)
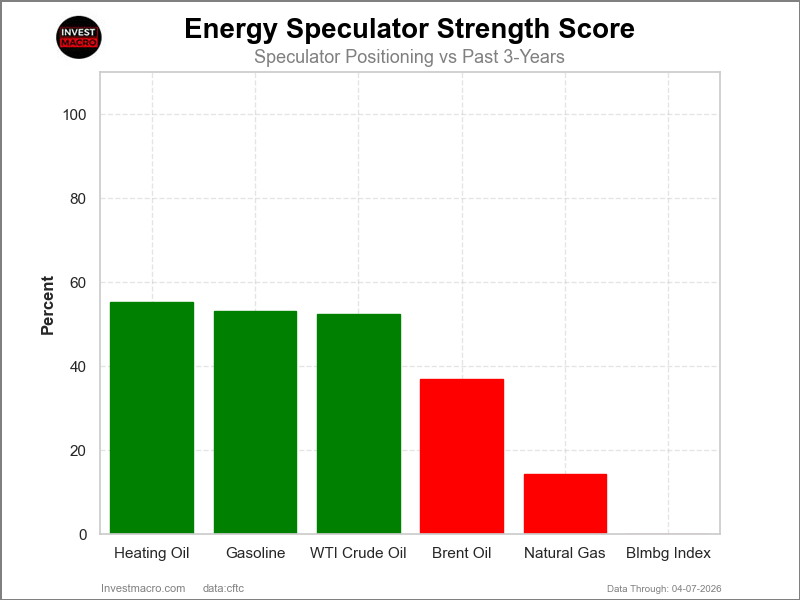
COT Strength Scores (a normalized measure of Speculator positions over a 3-Year range, from 0 to 100 where above 80 is Extreme-Bullish and below 20 is Extreme-Bearish) showed that Heating Oil (55.2 percent), Gasoline (53.0 percent) and WTI Crude Oil (52.3 percent) lead the energy markets this week.
On the downside, the Bloomberg Index (0.0 percent) and Natural Gas (14.4 percent) come in at the lowest strength level currently and is in Extreme-Bearish territory (below 20 percent).
Strength Statistics:
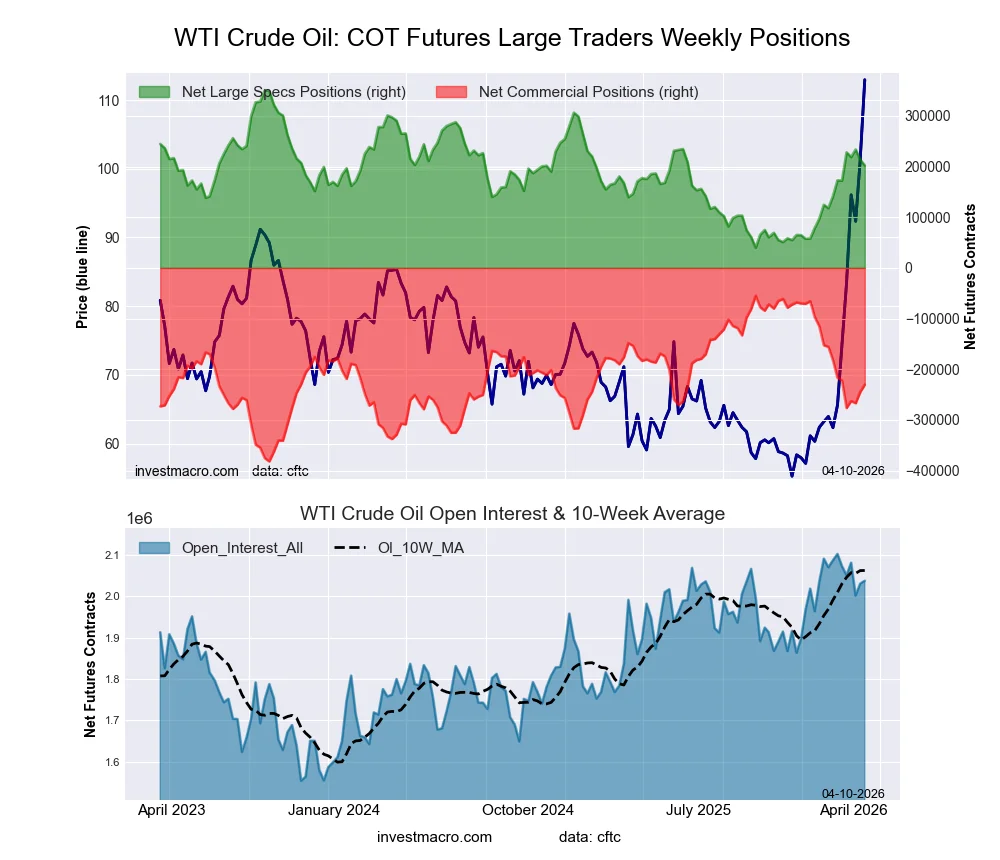
WTI Crude Oil (52.3 percent) vs WTI Crude Oil previous week (56.0 percent)
Brent Crude Oil (36.8 percent) vs Brent Crude Oil previous week (30.1 percent)
Natural Gas (14.4 percent) vs Natural Gas previous week (25.0 percent)
Gasoline (53.0 percent) vs Gasoline previous week (62.6 percent)
Heating Oil (55.2 percent) vs Heating Oil previous week (56.7 percent)
Bloomberg Commodity Index (0.0 percent) vs Bloomberg Commodity Index previous week (100.0 percent)
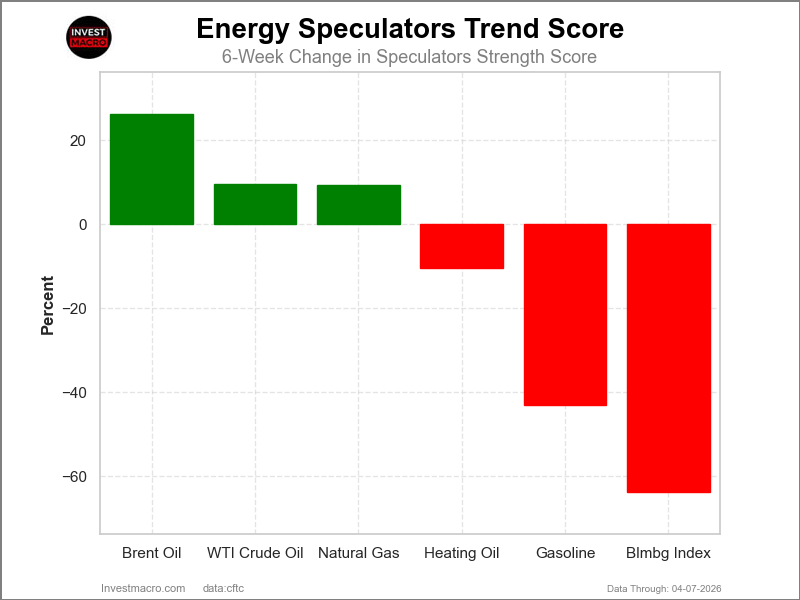
COT Strength Score Trends (or move index, calculates the 6-week changes in strength scores) showed that Brent Oil (26.2 percent) and WTI Crude (9.5 percent) lead the past six weeks trends for the energy markets. is the next highest positive mover in the latest trends data.
The Bloomberg Index (-63.8 percent) and Gasoline (-43.2 percent) lead the downside trend scores currently with Heating Oil (-10.5 percent) as the next market with lower trend scores.
Move Statistics:
WTI Crude Oil (9.5 percent) vs WTI Crude Oil previous week (23.3 percent)
Brent Crude Oil (26.2 percent) vs Brent Crude Oil previous week (0.6 percent)
Natural Gas (9.3 percent) vs Natural Gas previous week (11.8 percent)
Gasoline (-43.2 percent) vs Gasoline previous week (-22.5 percent)
Heating Oil (-10.5 percent) vs Heating Oil previous week (-7.0 percent)
Bloomberg Commodity Index (-63.8 percent) vs Bloomberg Commodity Index previous week (34.7 percent)
Our weekly trend-following model classifies the current market price position as: Uptrend.
| WTI Crude Oil Futures Statistics | SPECULATORS | COMMERCIALS | SMALL TRADERS |
| – Percent of Open Interest Longs: | 18.7 | 43.4 | 4.0 |
| – Percent of Open Interest Shorts: | 8.8 | 54.7 | 2.6 |
| – Net Position: | 202,153 | -230,466 | 28,313 |
| – Gross Longs: | 381,615 | 883,576 | 81,673 |
| – Gross Shorts: | 179,462 | 1,114,042 | 53,360 |
| – Long to Short Ratio: | 2.1 to 1 | 0.8 to 1 | 1.5 to 1 |
| NET POSITION TREND: | |||
| – Strength Index Score (3 Year Range Pct): | 52.3 | 46.3 | 56.8 |
| – Strength Index Reading (3 Year Range): | Bullish | Bearish | Bullish |
| NET POSITION MOVEMENT INDEX: | |||
| – 6-Week Change in Strength Index: | 9.5 | -4.2 | -31.1 |
Our weekly trend-following model classifies the current market price position as: Uptrend.
| Brent Crude Oil Futures Statistics | SPECULATORS | COMMERCIALS | SMALL TRADERS |
| – Percent of Open Interest Longs: | 25.5 | 40.5 | 4.6 |
| – Percent of Open Interest Shorts: | 37.3 | 30.1 | 3.2 |
| – Net Position: | -31,124 | 27,416 | 3,708 |
| – Gross Longs: | 67,615 | 107,138 | 12,052 |
| – Gross Shorts: | 98,739 | 79,722 | 8,344 |
| – Long to Short Ratio: | 0.7 to 1 | 1.3 to 1 | 1.4 to 1 |
| NET POSITION TREND: | |||
| – Strength Index Score (3 Year Range Pct): | 36.8 | 61.2 | 86.1 |
| – Strength Index Reading (3 Year Range): | Bearish | Bullish | Bullish-Extreme |
| NET POSITION MOVEMENT INDEX: | |||
| – 6-Week Change in Strength Index: | 26.2 | -32.7 | 37.7 |
Our weekly trend-following model classifies the current market price position as: Downtrend.
| Natural Gas Futures Statistics | SPECULATORS | COMMERCIALS | SMALL TRADERS |
| – Percent of Open Interest Longs: | 13.7 | 36.7 | 3.6 |
| – Percent of Open Interest Shorts: | 25.5 | 26.3 | 2.2 |
| – Net Position: | -183,987 | 162,087 | 21,900 |
| – Gross Longs: | 212,869 | 572,123 | 56,582 |
| – Gross Shorts: | 396,856 | 410,036 | 34,682 |
| – Long to Short Ratio: | 0.5 to 1 | 1.4 to 1 | 1.6 to 1 |
| NET POSITION TREND: | |||
| – Strength Index Score (3 Year Range Pct): | 14.4 | 85.2 | 58.5 |
| – Strength Index Reading (3 Year Range): | Bearish-Extreme | Bullish-Extreme | Bullish |
| NET POSITION MOVEMENT INDEX: | |||
| – 6-Week Change in Strength Index: | 9.3 | -14.0 | 16.6 |
Our weekly trend-following model classifies the current market price position as: Uptrend.
| Nasdaq Mini Futures Statistics | SPECULATORS | COMMERCIALS | SMALL TRADERS |
| – Percent of Open Interest Longs: | 25.0 | 49.5 | 9.6 |
| – Percent of Open Interest Shorts: | 6.4 | 72.6 | 5.1 |
| – Net Position: | 59,592 | -74,020 | 14,428 |
| – Gross Longs: | 80,253 | 158,736 | 30,682 |
| – Gross Shorts: | 20,661 | 232,756 | 16,254 |
| – Long to Short Ratio: | 3.9 to 1 | 0.7 to 1 | 1.9 to 1 |
| NET POSITION TREND: | |||
| – Strength Index Score (3 Year Range Pct): | 53.0 | 37.8 | 83.3 |
| – Strength Index Reading (3 Year Range): | Bullish | Bearish | Bullish-Extreme |
| NET POSITION MOVEMENT INDEX: | |||
| – 6-Week Change in Strength Index: | -43.2 | 37.2 | 9.5 |
Our weekly trend-following model classifies the current market price position as: Uptrend.
| Heating Oil Futures Statistics | SPECULATORS | COMMERCIALS | SMALL TRADERS |
| – Percent of Open Interest Longs: | 15.2 | 49.7 | 18.8 |
| – Percent of Open Interest Shorts: | 11.4 | 62.9 | 9.4 |
| – Net Position: | 8,887 | -30,231 | 21,344 |
| – Gross Longs: | 34,892 | 113,696 | 42,973 |
| – Gross Shorts: | 26,005 | 143,927 | 21,629 |
| – Long to Short Ratio: | 1.3 to 1 | 0.8 to 1 | 2.0 to 1 |
| NET POSITION TREND: | |||
| – Strength Index Score (3 Year Range Pct): | 55.2 | 37.8 | 76.5 |
| – Strength Index Reading (3 Year Range): | Bullish | Bearish | Bullish |
| NET POSITION MOVEMENT INDEX: | |||
| – 6-Week Change in Strength Index: | -10.5 | 9.1 | -4.4 |
Our weekly trend-following model classifies the current market price position as: Uptrend.
| Bloomberg Index Futures Statistics | SPECULATORS | COMMERCIALS | SMALL TRADERS |
| – Percent of Open Interest Longs: | 42.3 | 56.9 | 0.3 |
| – Percent of Open Interest Shorts: | 74.1 | 25.3 | 0.0 |
| – Net Position: | -75,342 | 74,711 | 631 |
| – Gross Longs: | 100,140 | 134,711 | 657 |
| – Gross Shorts: | 175,482 | 60,000 | 26 |
| – Long to Short Ratio: | 0.6 to 1 | 2.2 to 1 | 25.3 to 1 |
| NET POSITION TREND: | |||
| – Strength Index Score (3 Year Range Pct): | 0.0 | 100.0 | 74.5 |
| – Strength Index Reading (3 Year Range): | Bearish-Extreme | Bullish-Extreme | Bullish |
| NET POSITION MOVEMENT INDEX: | |||
| – 6-Week Change in Strength Index: | -63.8 | 64.0 | -9.7 |
Article By InvestMacro – Receive our weekly COT Reports by Email
*COT Report: The COT data, released weekly to the public each Friday, is updated through the most recent Tuesday (data is 3 days old) and shows a quick view of how large speculators or non-commercials (for-profit traders) were positioned in the futures markets.
The CFTC categorizes trader positions according to commercial hedgers (traders who use futures contracts for hedging as part of the business), non-commercials (large traders who speculate to realize trading profits) and nonreportable traders (usually small traders/speculators) as well as their open interest (contracts open in the market at time of reporting).See CFTC criteria here.
All information and opinions on this website and contained in this article are for general informational purposes only and do not constitute investment advice.
By JustMarkets On Thursday, the US stock indices posted strong gains, fully recovering from the…
By Analytical Department RoboForex USD/JPY recovered to 160.60 on Friday following a sharp drop the…
By Patrick J. Schena, Tufts University Creating a government fund to own AI stock and…
By JustMarkets The US equity indices ended Wednesday’s session with notable declines as geopolitical risks…
By Analytical Department RoboForex USD/JPY held near 163.50 on Thursday, with the yen retreating slightly…
By Analytical Department RoboForex GBP/USD continued to consolidate at 1.3283 on Wednesday. The British pound…
This website uses cookies.