By Analytical Department RoboForex
EUR/USD is trading around 1.1608 on Tuesday. The US dollar attempted to recover from a sharp intraday decline the previous day, which had been driven by expectations of a faster resolution to the conflict involving Iran, temporarily reducing demand for the dollar as a safe-haven asset.
US President Donald Trump stated that the military operation in Iran is nearing completion and is progressing faster than initial estimates, which had suggested a duration of four to five weeks. He also announced plans to reduce oil sanctions and deploy US Navy ships to escort tankers through the Strait of Hormuz in an effort to contain rising oil prices.
Previously, the dollar had strengthened significantly due to safe-haven demand. The escalation of the Middle East conflict and rising energy prices had intensified fears of prolonged economic disruption and a fresh wave of inflation.
Investor attention is now shifting to macroeconomic statistics from the United States. The February consumer price index (CPI) is scheduled for release on Wednesday, followed by the January PCE index on Friday. Market participants believe these data points will not yet fully capture the conflict’s impact on inflation expectations.
Technical Analysis
Free Reports:
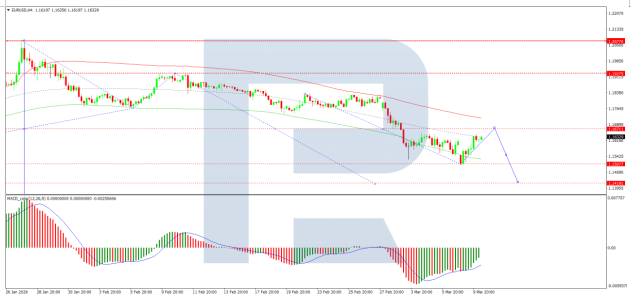
On the H4 chart of EUR/USD, the market is forming a consolidation range around the 1.1588 level. An upward wave is expected, with a continuation towards the 1.1668 level. Thereafter, the beginning of a new downward wave within the broader trend is anticipated, targeting 1.1419 as a local objective. Technically, this scenario is confirmed by the MACD indicator, whose signal line remains below zero and is pointing strictly downwards, reflecting sustained bearish momentum with potential for further downside.
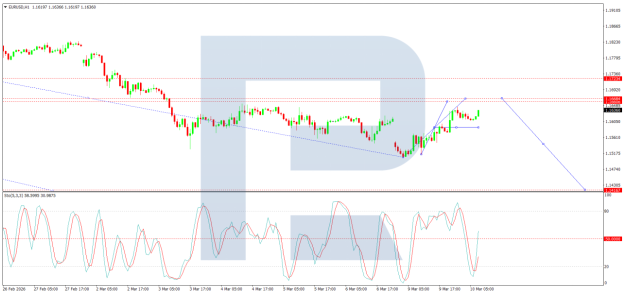
On the H1 chart, the market is forming the structure of the next growth wave towards the 1.1668 level. After reaching this level, a decline to 1.1419 is expected, followed by the initiation of a new growth wave to 1.1650. Technically, this scenario is supported by the Stochastic oscillator, with its signal line below 50 and pointing strictly upwards towards the 80 level.
Conclusion
EUR/USD remains highly sensitive to geopolitical developments, with signals of a potential de-escalation in the Iran conflict temporarily weighing on the dollar’s safe-haven appeal. However, the broader technical picture suggests any upside may be limited, with bearish momentum likely to reassert itself once the current corrective wave completes. Upcoming US inflation data will provide crucial clues about whether recent energy price increases are beginning to filter through to consumer prices, potentially influencing Fed policy expectations.
Disclaimer
Any forecasts contained herein are based on the author’s particular opinion. This analysis may not be treated as trading advice. RoboForex bears no responsibility for trading results based on trading recommendations and reviews contained herein.
By Michael Klein, Tufts University The “fog of war” refers to confusion and uncertainty on…
By JustMarkets The Canadian dollar rose above 1.37 against the US dollar, reaching a one-month…
By InvestMacro Here are the latest charts and statistics for the Commitment of Traders (COT)…
By InvestMacro The latest update for the weekly Commitment of Traders (COT) report was released…
By InvestMacro Here are the latest charts and statistics for the Commitment of Traders (COT)…
By InvestMacro Here are the latest charts and statistics for the Commitment of Traders (COT)…
This website uses cookies.