
By InvestMacro
Here are the latest charts and statistics for the Commitment of Traders (COT) reports data published by the Commodities Futures Trading Commission (CFTC).
The latest COT data is updated through Tuesday April 29th and shows a quick view of how large traders (for-profit speculators and commercial entities) were positioned in the futures markets.
Weekly Speculator Changes led by Cotton, Soybean Oil & Coffee

The COT soft commodities markets speculator bets were higher this week as eight out of the eleven softs markets we cover had higher positioning while the other three markets had lower speculator contracts.
Free Reports:
 Sign Up for Our Stock Market Newsletter – Get updated on News, Charts & Rankings of Public Companies when you join our Stocks Newsletter
 Get our Weekly Commitment of Traders Reports - See where the biggest traders (Hedge Funds and Commercial Hedgers) are positioned in the futures markets on a weekly basis.
Leading the gains for the softs markets was Cotton (13,340 contracts) with Soybean Oil (9,774 contracts), Coffee (8,233 contracts), Sugar (5,530 contracts), Live Cattle (4,024 contracts), Soybeans (3,789 contracts), Lean Hogs (3,561 contracts) and Cocoa (1,775 contracts) also having positive weeks.
The markets with the declines in speculator bets this week were Corn (-44,414 contracts), Soybean Meal (-22,758 contracts) and with Wheat (-22,839 contracts) also registering lower bets on the week.
Soft Commodities Data

Legend: Weekly Speculators Change | Speculators Current Net Position | Speculators Strength Score compared to last 3-Years (0-100 range)
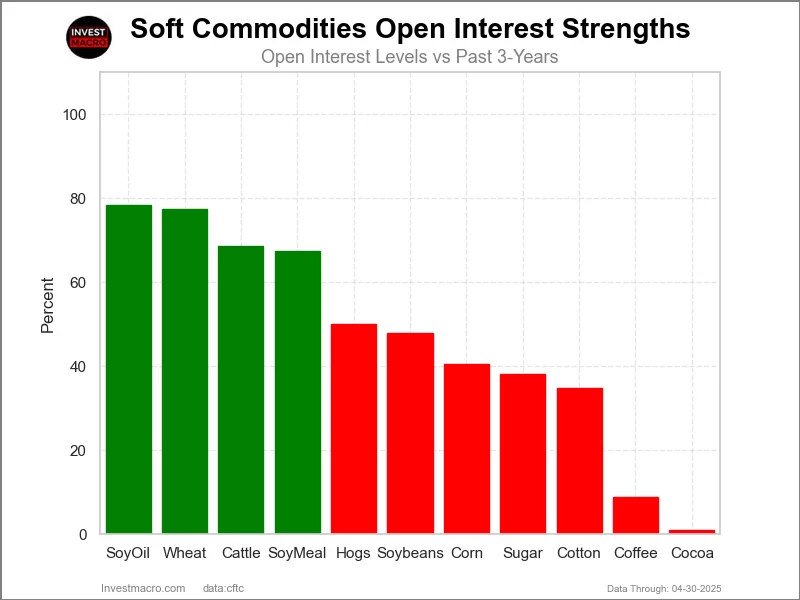
Strength Scores led by Soybean Oil & Live Cattle

COT Strength Scores (a normalized measure of Speculator positions over a 3-Year range, from 0 to 100 where above 80 is Extreme-Bullish and below 20 is Extreme-Bearish) showed that Soybean Oil (81 percent) and Live Cattle (80 percent) lead the softs markets this week. Coffee (74 percent), Soybeans (66 percent) and Corn (60 percent) come in as the next highest in the weekly strength scores.
On the downside, Wheat (0 percent) and Soybean Meal (5 percent) come in at the lowest strength levels currently and are in Extreme-Bearish territory (below 20 percent). The next lowest strength scores are the Sugar (23 percent) and the Cocoa (28 percent).
Strength Statistics:
Corn (59.7 percent) vs Corn previous week (65.7 percent)
Sugar (23.0 percent) vs Sugar previous week (21.2 percent)
Coffee (73.6 percent) vs Coffee previous week (65.7 percent)
Soybeans (65.7 percent) vs Soybeans previous week (64.8 percent)
Soybean Oil (80.6 percent) vs Soybean Oil previous week (75.2 percent)
Soybean Meal (5.4 percent) vs Soybean Meal previous week (14.7 percent)
Live Cattle (80.2 percent) vs Live Cattle previous week (76.3 percent)
Lean Hogs (54.8 percent) vs Lean Hogs previous week (52.0 percent)
Cotton (30.6 percent) vs Cotton previous week (22.5 percent)
Cocoa (27.7 percent) vs Cocoa previous week (25.8 percent)
Wheat (0.0 percent) vs Wheat previous week (15.7 percent)
Soybean Oil & Cotton top the 6-Week Strength Trends

COT Strength Score Trends (or move index, calculates the 6-week changes in strength scores) showed that Soybean Oil (44 percent) and Cotton (23 percent) lead the past six weeks trends for soft commodities. Soybeans (17 percent), Sugar (2 percent) and Cocoa (1 percent) are the next highest positive movers in the latest trends data.
Wheat (-28 percent) leads the downside trend scores currently with Soybean Meal (-9 percent), Corn (-9 percent) and Coffee (-7 percent) following next with lower trend scores.
Strength Trend Statistics:
Corn (-8.6 percent) vs Corn previous week (-6.6 percent)
Sugar (2.2 percent) vs Sugar previous week (7.8 percent)
Coffee (-6.6 percent) vs Coffee previous week (-14.9 percent)
Soybeans (17.3 percent) vs Soybeans previous week (17.4 percent)
Soybean Oil (44.2 percent) vs Soybean Oil previous week (34.2 percent)
Soybean Meal (-8.8 percent) vs Soybean Meal previous week (5.8 percent)
Live Cattle (-0.4 percent) vs Live Cattle previous week (1.6 percent)
Lean Hogs (0.2 percent) vs Lean Hogs previous week (-5.3 percent)
Cotton (22.8 percent) vs Cotton previous week (19.2 percent)
Cocoa (0.9 percent) vs Cocoa previous week (-1.8 percent)
Wheat (-27.7 percent) vs Wheat previous week (-10.9 percent)
Individual Soft Commodities Markets:
CORN Futures:
 The CORN large speculator standing this week was a net position of 175,429 contracts in the data reported through Tuesday. This was a weekly reduction of -44,414 contracts from the previous week which had a total of 219,843 net contracts.
This week’s current strength score (the trader positioning range over the past three years, measured from 0 to 100) shows the speculators are currently Bullish with a score of 59.7 percent. The commercials are Bearish with a score of 41.9 percent and the small traders (not shown in chart) are Bullish with a score of 52.1 percent.
Price Trend-Following Model: Weak Uptrend
Our weekly trend-following model classifies the current market price position as: Weak Uptrend.
| CORN Futures Statistics | SPECULATORS | COMMERCIALS | SMALL TRADERS |
| – Percent of Open Interest Longs: | 26.7 | 44.4 | 7.7 |
| – Percent of Open Interest Shorts: | 15.3 | 52.7 | 10.8 |
| – Net Position: | 175,429 | -128,654 | -46,775 |
| – Gross Longs: | 412,036 | 685,641 | 119,389 |
| – Gross Shorts: | 236,607 | 814,295 | 166,164 |
| – Long to Short Ratio: | 1.7 to 1 | 0.8 to 1 | 0.7 to 1 |
| NET POSITION TREND: | |||
| – Strength Index Score (3 Year Range Pct): | 59.7 | 41.9 | 52.1 |
| – Strength Index Reading (3 Year Range): | Bullish | Bearish | Bullish |
| NET POSITION MOVEMENT INDEX: | |||
| – 6-Week Change in Strength Index: | -8.6 | 7.5 | 12.7 |
SUGAR Futures:
 The SUGAR large speculator standing this week was a net position of 38,765 contracts in the data reported through Tuesday. This was a weekly boost of 5,530 contracts from the previous week which had a total of 33,235 net contracts.
This week’s current strength score (the trader positioning range over the past three years, measured from 0 to 100) shows the speculators are currently Bearish with a score of 23.0 percent. The commercials are Bullish-Extreme with a score of 81.2 percent and the small traders (not shown in chart) are Bearish-Extreme with a score of 15.1 percent.
Price Trend-Following Model: Weak Uptrend
Our weekly trend-following model classifies the current market price position as: Weak Uptrend.
| SUGAR Futures Statistics | SPECULATORS | COMMERCIALS | SMALL TRADERS |
| – Percent of Open Interest Longs: | 24.2 | 54.6 | 6.9 |
| – Percent of Open Interest Shorts: | 19.4 | 58.9 | 7.4 |
| – Net Position: | 38,765 | -34,712 | -4,053 |
| – Gross Longs: | 196,828 | 444,878 | 56,409 |
| – Gross Shorts: | 158,063 | 479,590 | 60,462 |
| – Long to Short Ratio: | 1.2 to 1 | 0.9 to 1 | 0.9 to 1 |
| NET POSITION TREND: | |||
| – Strength Index Score (3 Year Range Pct): | 23.0 | 81.2 | 15.1 |
| – Strength Index Reading (3 Year Range): | Bearish | Bullish-Extreme | Bearish-Extreme |
| NET POSITION MOVEMENT INDEX: | |||
| – 6-Week Change in Strength Index: | 2.2 | 5.3 | -36.7 |
COFFEE Futures:
 The COFFEE large speculator standing this week was a net position of 49,289 contracts in the data reported through Tuesday. This was a weekly gain of 8,233 contracts from the previous week which had a total of 41,056 net contracts.
This week’s current strength score (the trader positioning range over the past three years, measured from 0 to 100) shows the speculators are currently Bullish with a score of 73.6 percent. The commercials are Bearish with a score of 27.2 percent and the small traders (not shown in chart) are Bullish with a score of 67.0 percent.
Price Trend-Following Model: Uptrend
Our weekly trend-following model classifies the current market price position as: Uptrend.
| COFFEE Futures Statistics | SPECULATORS | COMMERCIALS | SMALL TRADERS |
| – Percent of Open Interest Longs: | 38.2 | 37.0 | 5.9 |
| – Percent of Open Interest Shorts: | 6.5 | 70.6 | 4.0 |
| – Net Position: | 49,289 | -52,194 | 2,905 |
| – Gross Longs: | 59,405 | 57,566 | 9,134 |
| – Gross Shorts: | 10,116 | 109,760 | 6,229 |
| – Long to Short Ratio: | 5.9 to 1 | 0.5 to 1 | 1.5 to 1 |
| NET POSITION TREND: | |||
| – Strength Index Score (3 Year Range Pct): | 73.6 | 27.2 | 67.0 |
| – Strength Index Reading (3 Year Range): | Bullish | Bearish | Bullish |
| NET POSITION MOVEMENT INDEX: | |||
| – 6-Week Change in Strength Index: | -6.6 | 6.5 | 0.9 |
SOYBEANS Futures:
 The SOYBEANS large speculator standing this week was a net position of 59,473 contracts in the data reported through Tuesday. This was a weekly rise of 3,789 contracts from the previous week which had a total of 55,684 net contracts.
This week’s current strength score (the trader positioning range over the past three years, measured from 0 to 100) shows the speculators are currently Bullish with a score of 65.7 percent. The commercials are Bearish with a score of 33.5 percent and the small traders (not shown in chart) are Bullish with a score of 59.0 percent.
Price Trend-Following Model: Uptrend
Our weekly trend-following model classifies the current market price position as: Uptrend.
| SOYBEANS Futures Statistics | SPECULATORS | COMMERCIALS | SMALL TRADERS |
| – Percent of Open Interest Longs: | 24.5 | 50.3 | 5.5 |
| – Percent of Open Interest Shorts: | 16.6 | 55.5 | 8.2 |
| – Net Position: | 59,473 | -38,976 | -20,497 |
| – Gross Longs: | 184,167 | 378,825 | 41,309 |
| – Gross Shorts: | 124,694 | 417,801 | 61,806 |
| – Long to Short Ratio: | 1.5 to 1 | 0.9 to 1 | 0.7 to 1 |
| NET POSITION TREND: | |||
| – Strength Index Score (3 Year Range Pct): | 65.7 | 33.5 | 59.0 |
| – Strength Index Reading (3 Year Range): | Bullish | Bearish | Bullish |
| NET POSITION MOVEMENT INDEX: | |||
| – 6-Week Change in Strength Index: | 17.3 | -21.2 | 27.9 |
SOYBEAN OIL Futures:
 The SOYBEAN OIL large speculator standing this week was a net position of 70,165 contracts in the data reported through Tuesday. This was a weekly boost of 9,774 contracts from the previous week which had a total of 60,391 net contracts.
This week’s current strength score (the trader positioning range over the past three years, measured from 0 to 100) shows the speculators are currently Bullish-Extreme with a score of 80.6 percent. The commercials are Bearish with a score of 20.5 percent and the small traders (not shown in chart) are Bullish with a score of 56.3 percent.
Price Trend-Following Model: Strong Uptrend
Our weekly trend-following model classifies the current market price position as: Strong Uptrend.
| SOYBEAN OIL Futures Statistics | SPECULATORS | COMMERCIALS | SMALL TRADERS |
| – Percent of Open Interest Longs: | 27.6 | 46.0 | 6.6 |
| – Percent of Open Interest Shorts: | 14.8 | 60.7 | 4.7 |
| – Net Position: | 70,165 | -80,644 | 10,479 |
| – Gross Longs: | 151,088 | 251,914 | 35,994 |
| – Gross Shorts: | 80,923 | 332,558 | 25,515 |
| – Long to Short Ratio: | 1.9 to 1 | 0.8 to 1 | 1.4 to 1 |
| NET POSITION TREND: | |||
| – Strength Index Score (3 Year Range Pct): | 80.6 | 20.5 | 56.3 |
| – Strength Index Reading (3 Year Range): | Bullish-Extreme | Bearish | Bullish |
| NET POSITION MOVEMENT INDEX: | |||
| – 6-Week Change in Strength Index: | 44.2 | -45.6 | 37.3 |
SOYBEAN MEAL Futures:
 The SOYBEAN MEAL large speculator standing this week was a net position of -53,734 contracts in the data reported through Tuesday. This was a weekly reduction of -22,758 contracts from the previous week which had a total of -30,976 net contracts.
This week’s current strength score (the trader positioning range over the past three years, measured from 0 to 100) shows the speculators are currently Bearish-Extreme with a score of 5.4 percent. The commercials are Bullish-Extreme with a score of 91.8 percent and the small traders (not shown in chart) are Bearish with a score of 44.3 percent.
Price Trend-Following Model: Weak Uptrend
Our weekly trend-following model classifies the current market price position as: Weak Uptrend.
| SOYBEAN MEAL Futures Statistics | SPECULATORS | COMMERCIALS | SMALL TRADERS |
| – Percent of Open Interest Longs: | 20.5 | 51.0 | 8.4 |
| – Percent of Open Interest Shorts: | 30.3 | 44.5 | 5.1 |
| – Net Position: | -53,734 | 35,546 | 18,188 |
| – Gross Longs: | 112,251 | 279,114 | 46,066 |
| – Gross Shorts: | 165,985 | 243,568 | 27,878 |
| – Long to Short Ratio: | 0.7 to 1 | 1.1 to 1 | 1.7 to 1 |
| NET POSITION TREND: | |||
| – Strength Index Score (3 Year Range Pct): | 5.4 | 91.8 | 44.3 |
| – Strength Index Reading (3 Year Range): | Bearish-Extreme | Bullish-Extreme | Bearish |
| NET POSITION MOVEMENT INDEX: | |||
| – 6-Week Change in Strength Index: | -8.8 | 8.7 | -2.9 |
LIVE CATTLE Futures:
 The LIVE CATTLE large speculator standing this week was a net position of 103,030 contracts in the data reported through Tuesday. This was a weekly increase of 4,024 contracts from the previous week which had a total of 99,006 net contracts.
This week’s current strength score (the trader positioning range over the past three years, measured from 0 to 100) shows the speculators are currently Bullish-Extreme with a score of 80.2 percent. The commercials are Bearish with a score of 21.3 percent and the small traders (not shown in chart) are Bearish with a score of 26.0 percent.
Price Trend-Following Model: Strong Uptrend
Our weekly trend-following model classifies the current market price position as: Strong Uptrend.
| LIVE CATTLE Futures Statistics | SPECULATORS | COMMERCIALS | SMALL TRADERS |
| – Percent of Open Interest Longs: | 48.9 | 28.3 | 8.0 |
| – Percent of Open Interest Shorts: | 20.1 | 51.5 | 13.7 |
| – Net Position: | 103,030 | -82,863 | -20,167 |
| – Gross Longs: | 174,783 | 101,168 | 28,663 |
| – Gross Shorts: | 71,753 | 184,031 | 48,830 |
| – Long to Short Ratio: | 2.4 to 1 | 0.5 to 1 | 0.6 to 1 |
| NET POSITION TREND: | |||
| – Strength Index Score (3 Year Range Pct): | 80.2 | 21.3 | 26.0 |
| – Strength Index Reading (3 Year Range): | Bullish-Extreme | Bearish | Bearish |
| NET POSITION MOVEMENT INDEX: | |||
| – 6-Week Change in Strength Index: | -0.4 | -2.4 | 8.0 |
LEAN HOGS Futures:
 The LEAN HOGS large speculator standing this week was a net position of 34,857 contracts in the data reported through Tuesday. This was a weekly advance of 3,561 contracts from the previous week which had a total of 31,296 net contracts.
This week’s current strength score (the trader positioning range over the past three years, measured from 0 to 100) shows the speculators are currently Bullish with a score of 54.8 percent. The commercials are Bearish with a score of 41.2 percent and the small traders (not shown in chart) are Bullish with a score of 75.6 percent.
Price Trend-Following Model: Weak Downtrend
Our weekly trend-following model classifies the current market price position as: Weak Downtrend.
| LEAN HOGS Futures Statistics | SPECULATORS | COMMERCIALS | SMALL TRADERS |
| – Percent of Open Interest Longs: | 36.3 | 34.7 | 8.0 |
| – Percent of Open Interest Shorts: | 23.4 | 47.4 | 8.1 |
| – Net Position: | 34,857 | -34,534 | -323 |
| – Gross Longs: | 98,526 | 94,174 | 21,808 |
| – Gross Shorts: | 63,669 | 128,708 | 22,131 |
| – Long to Short Ratio: | 1.5 to 1 | 0.7 to 1 | 1.0 to 1 |
| NET POSITION TREND: | |||
| – Strength Index Score (3 Year Range Pct): | 54.8 | 41.2 | 75.6 |
| – Strength Index Reading (3 Year Range): | Bullish | Bearish | Bullish |
| NET POSITION MOVEMENT INDEX: | |||
| – 6-Week Change in Strength Index: | 0.2 | -2.6 | 16.8 |
COTTON Futures:
 The COTTON large speculator standing this week was a net position of -11,738 contracts in the data reported through Tuesday. This was a weekly lift of 13,340 contracts from the previous week which had a total of -25,078 net contracts.
This week’s current strength score (the trader positioning range over the past three years, measured from 0 to 100) shows the speculators are currently Bearish with a score of 30.6 percent. The commercials are Bullish with a score of 72.9 percent and the small traders (not shown in chart) are Bearish-Extreme with a score of 0.4 percent.
Price Trend-Following Model: Weak Downtrend
Our weekly trend-following model classifies the current market price position as: Weak Downtrend.
| COTTON Futures Statistics | SPECULATORS | COMMERCIALS | SMALL TRADERS |
| – Percent of Open Interest Longs: | 31.0 | 48.1 | 5.2 |
| – Percent of Open Interest Shorts: | 36.6 | 41.3 | 6.4 |
| – Net Position: | -11,738 | 14,393 | -2,655 |
| – Gross Longs: | 65,344 | 101,388 | 10,925 |
| – Gross Shorts: | 77,082 | 86,995 | 13,580 |
| – Long to Short Ratio: | 0.8 to 1 | 1.2 to 1 | 0.8 to 1 |
| NET POSITION TREND: | |||
| – Strength Index Score (3 Year Range Pct): | 30.6 | 72.9 | 0.4 |
| – Strength Index Reading (3 Year Range): | Bearish | Bullish | Bearish-Extreme |
| NET POSITION MOVEMENT INDEX: | |||
| – 6-Week Change in Strength Index: | 22.8 | -19.3 | -26.7 |
COCOA Futures:
 The COCOA large speculator standing this week was a net position of 17,352 contracts in the data reported through Tuesday. This was a weekly lift of 1,775 contracts from the previous week which had a total of 15,577 net contracts.
This week’s current strength score (the trader positioning range over the past three years, measured from 0 to 100) shows the speculators are currently Bearish with a score of 27.7 percent. The commercials are Bullish with a score of 71.8 percent and the small traders (not shown in chart) are Bullish with a score of 63.9 percent.
Price Trend-Following Model: Weak Downtrend
Our weekly trend-following model classifies the current market price position as: Weak Downtrend.
| COCOA Futures Statistics | SPECULATORS | COMMERCIALS | SMALL TRADERS |
| – Percent of Open Interest Longs: | 30.5 | 39.4 | 10.6 |
| – Percent of Open Interest Shorts: | 11.1 | 63.6 | 5.7 |
| – Net Position: | 17,352 | -21,708 | 4,356 |
| – Gross Longs: | 27,337 | 35,318 | 9,480 |
| – Gross Shorts: | 9,985 | 57,026 | 5,124 |
| – Long to Short Ratio: | 2.7 to 1 | 0.6 to 1 | 1.9 to 1 |
| NET POSITION TREND: | |||
| – Strength Index Score (3 Year Range Pct): | 27.7 | 71.8 | 63.9 |
| – Strength Index Reading (3 Year Range): | Bearish | Bullish | Bullish |
| NET POSITION MOVEMENT INDEX: | |||
| – 6-Week Change in Strength Index: | 0.9 | -2.1 | 12.7 |
WHEAT Futures:
 The WHEAT large speculator standing this week was a net position of -116,808 contracts in the data reported through Tuesday. This was a weekly reduction of -22,839 contracts from the previous week which had a total of -93,969 net contracts.
This week’s current strength score (the trader positioning range over the past three years, measured from 0 to 100) shows the speculators are currently Bearish-Extreme with a score of 0.0 percent. The commercials are Bullish-Extreme with a score of 100.0 percent and the small traders (not shown in chart) are Bullish-Extreme with a score of 96.6 percent.
Price Trend-Following Model: Strong Downtrend
Our weekly trend-following model classifies the current market price position as: Strong Downtrend.
| WHEAT Futures Statistics | SPECULATORS | COMMERCIALS | SMALL TRADERS |
| – Percent of Open Interest Longs: | 25.7 | 39.3 | 8.5 |
| – Percent of Open Interest Shorts: | 51.8 | 14.8 | 6.9 |
| – Net Position: | -116,808 | 109,606 | 7,202 |
| – Gross Longs: | 114,740 | 175,679 | 38,188 |
| – Gross Shorts: | 231,548 | 66,073 | 30,986 |
| – Long to Short Ratio: | 0.5 to 1 | 2.7 to 1 | 1.2 to 1 |
| NET POSITION TREND: | |||
| – Strength Index Score (3 Year Range Pct): | 0.0 | 100.0 | 96.6 |
| – Strength Index Reading (3 Year Range): | Bearish-Extreme | Bullish-Extreme | Bullish-Extreme |
| NET POSITION MOVEMENT INDEX: | |||
| – 6-Week Change in Strength Index: | -27.7 | 25.3 | 33.2 |
Article By InvestMacro – Receive our weekly COT Newsletter
*COT Report: The COT data, released weekly to the public each Friday, is updated through the most recent Tuesday (data is 3 days old) and shows a quick view of how large speculators or non-commercials (for-profit traders) were positioned in the futures markets.
The CFTC categorizes trader positions according to commercial hedgers (traders who use futures contracts for hedging as part of the business), non-commercials (large traders who speculate to realize trading profits) and nonreportable traders (usually small traders/speculators) as well as their open interest (contracts open in the market at time of reporting). See CFTC criteria here.

- Bitcoin shows resilience to Middle East events. Oil market stabilizes Mar 5, 2026
- GBP/USD: Market Not Expecting BoE Rate Cut in March Mar 5, 2026
- Brent headed for $100? Mar 4, 2026
- Global stock indices continue sell-off due to Middle East conflict Mar 4, 2026
- USD/JPY to Quickly Return to Growth: Momentum Favours the US Dollar Mar 4, 2026
- European equities plunge amid Persian Gulf military conflict Mar 3, 2026
- Gold Rallies for Fifth Day, With External Risks Mounting Mar 3, 2026
- Iran Crisis: A Dangerous Turning Point Mar 2, 2026
- Oil prices have seen their largest surge in 4 years amid the military conflict in the Persian Gulf. Mar 2, 2026
- EUR/USD Reacts to Geopolitics and Data: Week Opens Nervously Mar 2, 2026