By RoboForex Analytical Department
Gold prices dipped below 2,620.00 USD per troy ounce on Friday, marking a second consecutive session of decline. The value of the precious metal continues to be influenced by developments in US economic indicators and expectations surrounding the Federal Reserve’s monetary policy.
Investor attention is particularly focused on the upcoming November US labour market data, poised to provide further insights into the Federal Reserve’s monetary policy directions. Recent statistics indicating an increase in unemployment claims suggest potential cooling in the employment sector. This data arrives just ahead of the highly anticipated nonfarm payrolls report, which is crucial for gauging the health of the US labour market.
The probability of a Fed interest rate cut in December currently stands at 70%, with expectations of a 25-basis-point reduction. Such a cut would likely benefit Gold, as lower interest rates decrease the opportunity cost of holding non-yielding assets like Gold.
On the demand side, despite a decline in interest in jewellery, China’s investment in Gold remains robust, according to World Bank data, providing fundamental support to Gold prices.
Technical analysis of XAU/USD
Free Reports:
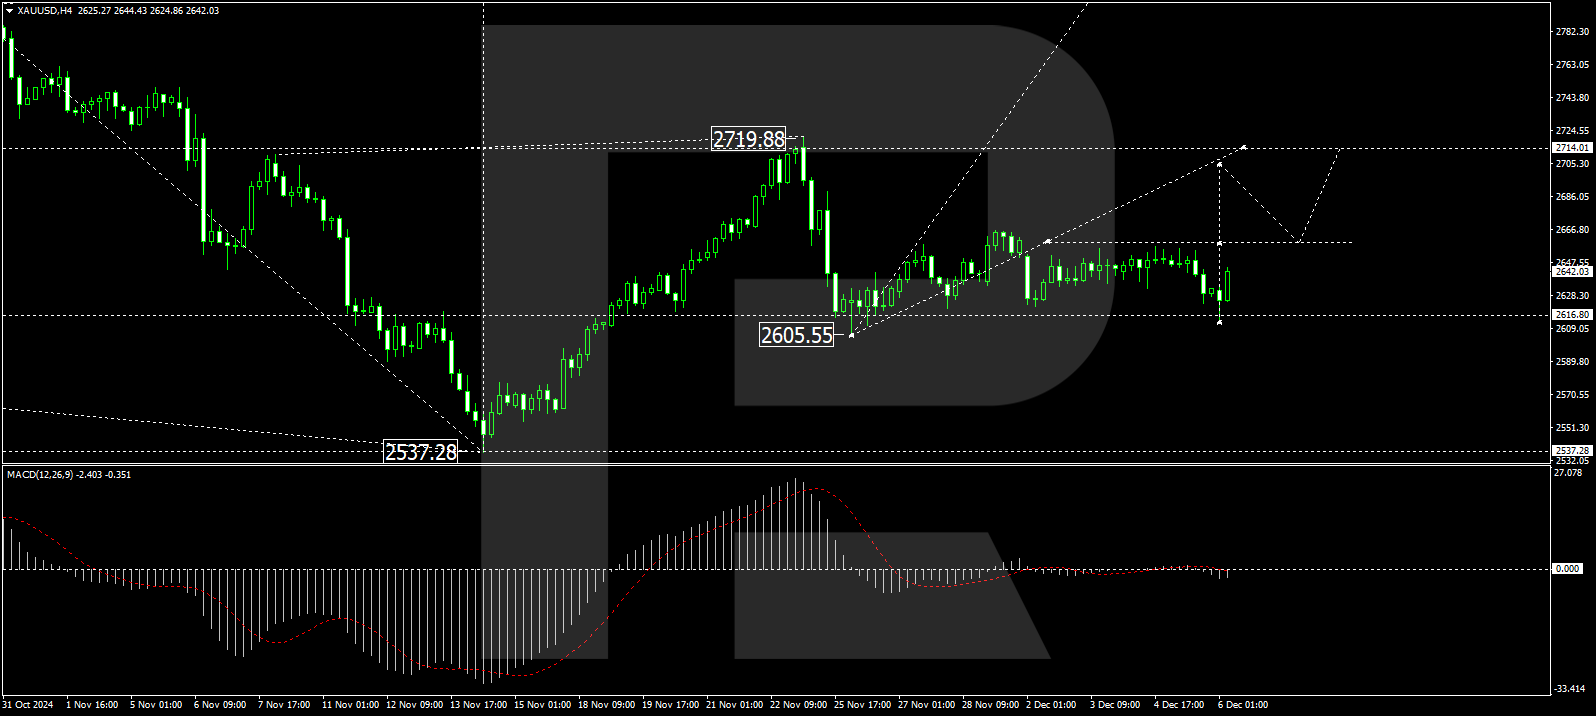
H4 chart: Gold has experienced a growth wave, peaking at 2,666.35, followed by a correction down to 2,616.60. A new growth impulse towards 2,663.00 is underway, and we anticipate the formation of a consolidation range around this level. If the price breaks upward, it may continue its ascent towards 2,714.00. The MACD indicator supports this bullish outlook, with its signal line hovering near zero and pointing upwards.
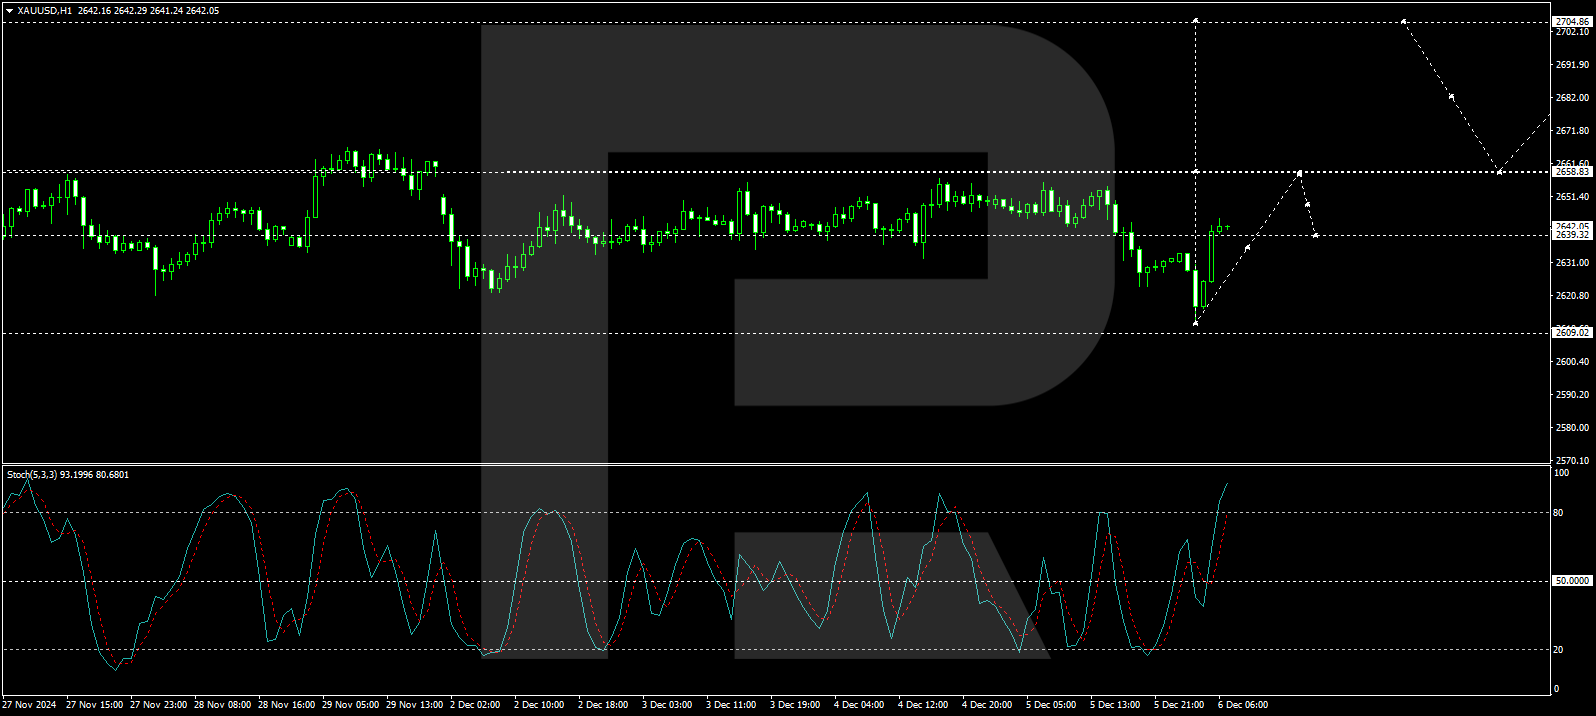
H1 chart: the XAU/USD has completed a growth impulse to 2,640.00 and is likely to form a narrow consolidation range around this level. An upward breakout would suggest the continuation of the growth impulse to 2,663.00, potentially extending to 2,666.00. This scenario is corroborated by the Stochastic oscillator, with its signal line currently above 50 and trending upwards towards 80, indicating strong upward momentum.
Disclaimer
Any forecasts contained herein are based on the author’s particular opinion. This analysis may not be treated as trading advice. RoboForex bears no responsibility for trading results based on trading recommendations and reviews contained herein.
By Analytical Department RoboForex GBP/USD continued to consolidate at 1.3283 on Wednesday. The British pound…
By JustMarkets The US equity indices showed mixed performance on Tuesday. The Dow Jones (US30)…
By Pawan Jain, University of Michigan Flint Finding good financial advice can be stressful –…
Source: Stephen McBride (7/27/26) Stephen McBride of RiskHedge shares his thoughts on the potential for…
By JustMarkets The US equity indices showed mixed performance on Monday ahead of the Federal…
By Analytical Department RoboForex Gold fell to 4,047 USD per ounce on Tuesday, erasing gains…
This website uses cookies.