
By InvestMacro
Here are the latest charts and statistics for the Commitment of Traders (COT) data published by the Commodities Futures Trading Commission (CFTC).
The latest COT data is updated through Tuesday February 27th and shows a quick view of how large traders (for-profit speculators and commercial entities) were positioned in the futures markets.
Weekly Speculator Changes led by Copper
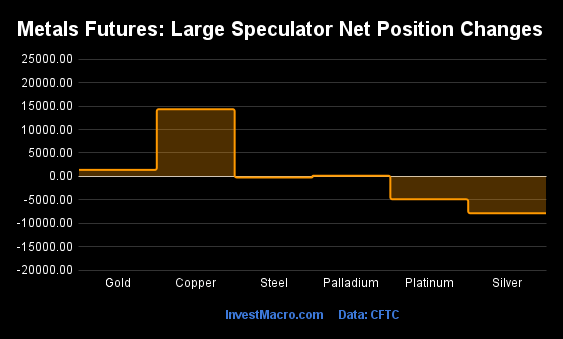
The COT metals markets speculator bets were mixed this week as three out of the six metals markets we cover had higher positioning while the other three markets had lower speculator contracts.
Free Reports:
 Sign Up for Our Stock Market Newsletter – Get updated on News, Charts & Rankings of Public Companies when you join our Stocks Newsletter
 Get our Weekly Commitment of Traders Reports - See where the biggest traders (Hedge Funds and Commercial Hedgers) are positioned in the futures markets on a weekly basis.
Leading the gains for the metals was Copper (14,339 contracts) with Gold (1,374 contracts) and Palladium (138 contracts) also showing positive weeks.
The markets with declines in speculator bets for the week were Silver (-7,878 contracts), Platinum (-4,894 contracts) and Steel with a dip of -234 contracts.
Net Speculators Leaderboard
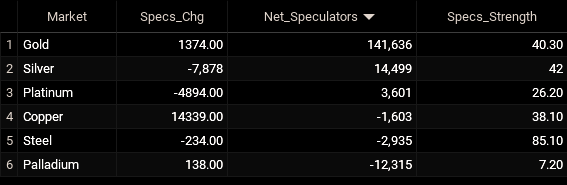
Legend: Weekly Speculators Change | Speculators Current Net Position | Speculators Strength Score compared to last 3-Years (0-100 range)
Strength Scores led by Steel
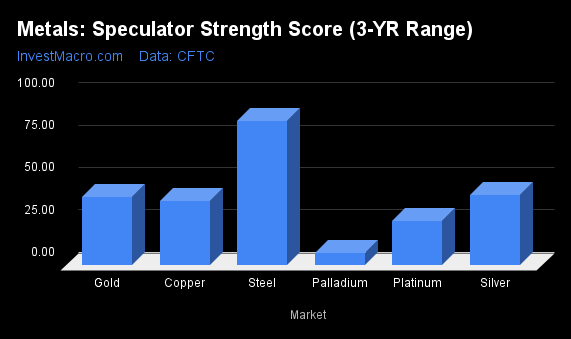
COT Strength Scores (a normalized measure of Speculator positions over a 3-Year range, from 0 to 100 where above 80 is Extreme-Bullish and below 20 is Extreme-Bearish) showed that Steel (85 percent) leads the metals markets this week.
On the downside, Palladium (7 percent) comes in at the lowest strength level currently and is in Extreme-Bearish territory (below 20 percent). The next lowest strength score was Platinum (26 percent) this week.
Strength Statistics:
Gold (40.3 percent) vs Gold previous week (39.7 percent)
Silver (41.6 percent) vs Silver previous week (53.6 percent)
Copper (38.1 percent) vs Copper previous week (22.1 percent)
Platinum (26.2 percent) vs Platinum previous week (38.6 percent)
Palladium (7.2 percent) vs Palladium previous week (6.4 percent)
Steel (85.1 percent) vs Palladium previous week (86.0 percent)
Copper tops the 6-Week Strength Trends
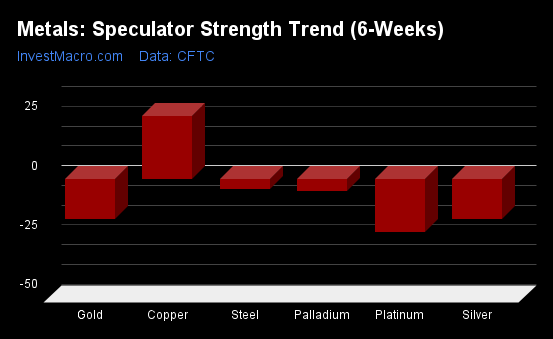
COT Strength Score Trends (or move index, calculates the 6-week changes in strength scores) showed that Copper (26 percent) leads the past six weeks trends for metals and is the only positive mover in the latest data.
Platinum (-23 percent), Gold (-17 percent) and Silver (-17 percent) lead the downside trend scores this week.
Move Statistics:
Gold (-17.2 percent) vs Gold previous week (-21.8 percent)
Silver (-16.9 percent) vs Silver previous week (-6.1 percent)
Copper (26.5 percent) vs Copper previous week (-3.1 percent)
Platinum (-22.7 percent) vs Platinum previous week (-38.1 percent)
Palladium (-5.2 percent) vs Palladium previous week (-18.0 percent)
Steel (-4.4 percent) vs Steel previous week (-4.7 percent)
Individual Markets:
Gold Comex Futures:
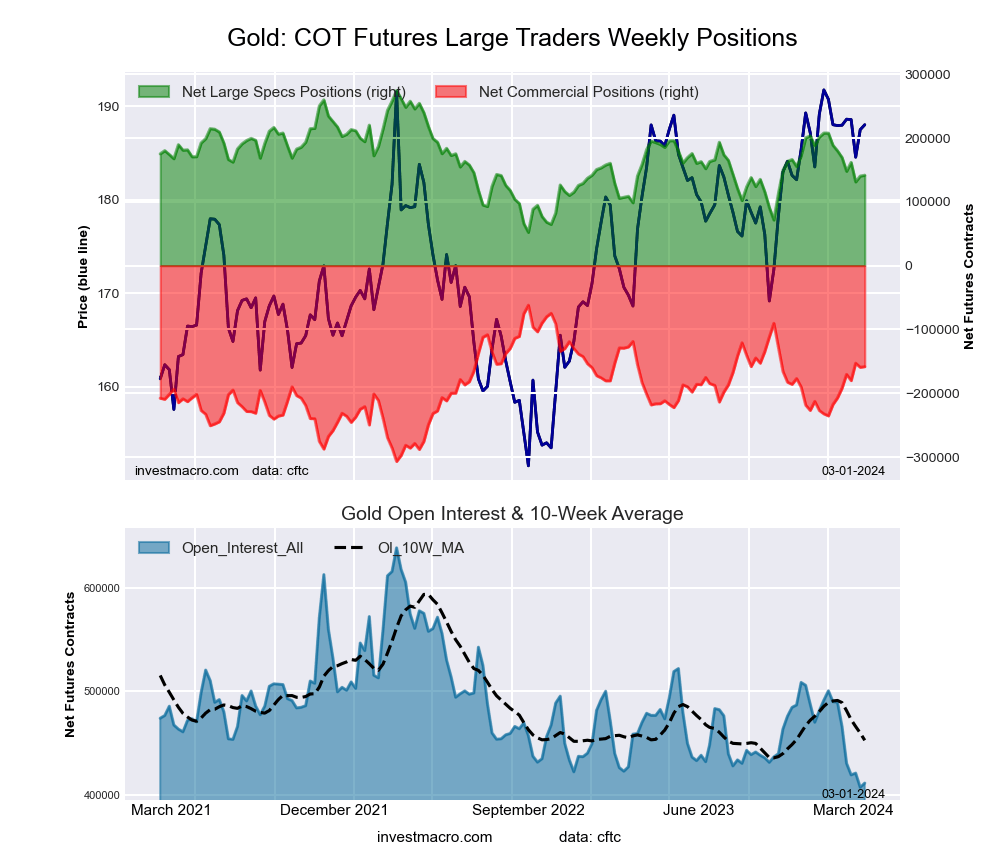 The Gold Comex Futures large speculator standing this week reached a net position of 141,636 contracts in the data reported through Tuesday. This was a weekly gain of 1,374 contracts from the previous week which had a total of 140,262 net contracts.
This week’s current strength score (the trader positioning range over the past three years, measured from 0 to 100) shows the speculators are currently Bearish with a score of 40.3 percent. The commercials are Bullish with a score of 60.7 percent and the small traders (not shown in chart) are Bearish with a score of 27.9 percent.
Price Trend-Following Model: Strong Uptrend
Our weekly trend-following model classifies the current market price position as: Strong Uptrend. The current action for the model is considered to be: Hold – Maintain Long Position.
| Gold Futures Statistics | SPECULATORS | COMMERCIALS | SMALL TRADERS |
| – Percent of Open Interest Longs: | 52.3 | 26.4 | 9.5 |
| – Percent of Open Interest Shorts: | 17.8 | 64.9 | 5.4 |
| – Net Position: | 141,636 | -158,352 | 16,716 |
| – Gross Longs: | 214,948 | 108,432 | 38,943 |
| – Gross Shorts: | 73,312 | 266,784 | 22,227 |
| – Long to Short Ratio: | 2.9 to 1 | 0.4 to 1 | 1.8 to 1 |
| NET POSITION TREND: | |||
| – Strength Index Score (3 Year Range Pct): | 40.3 | 60.7 | 27.9 |
| – Strength Index Reading (3 Year Range): | Bearish | Bullish | Bearish |
| NET POSITION MOVEMENT INDEX: | |||
| – 6-Week Change in Strength Index: | -17.2 | 20.0 | -34.7 |
Silver Comex Futures:
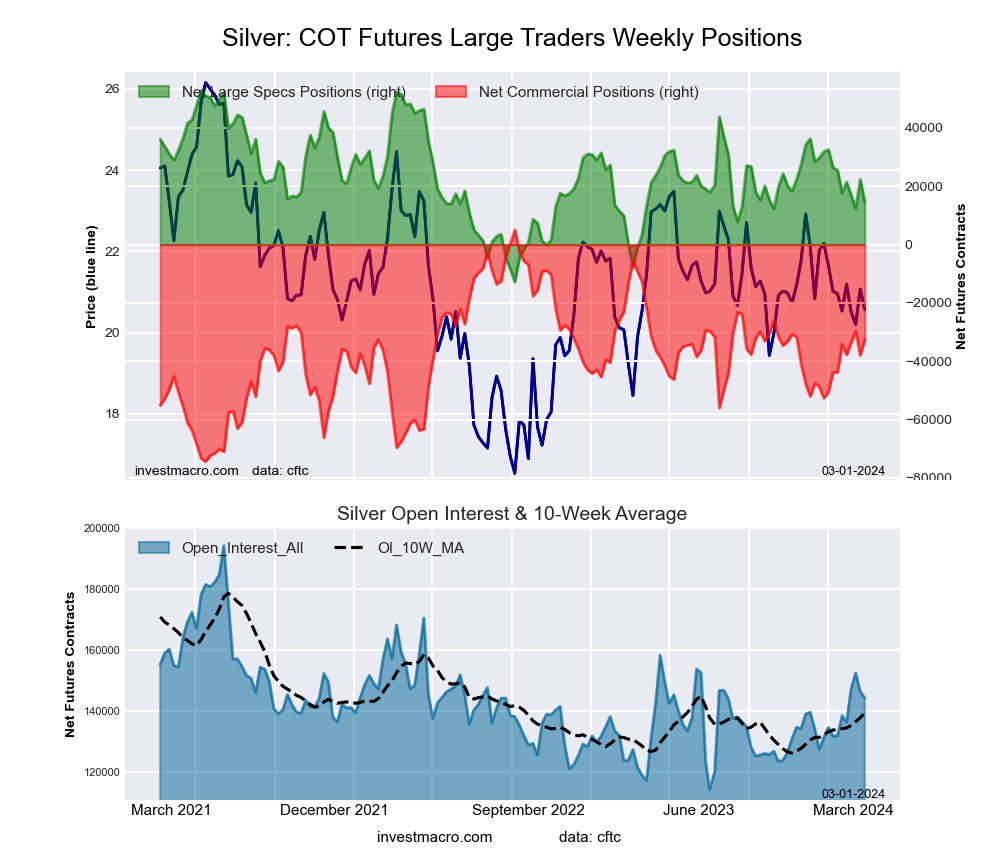 The Silver Comex Futures large speculator standing this week reached a net position of 14,499 contracts in the data reported through Tuesday. This was a weekly fall of -7,878 contracts from the previous week which had a total of 22,377 net contracts.
This week’s current strength score (the trader positioning range over the past three years, measured from 0 to 100) shows the speculators are currently Bearish with a score of 41.6 percent. The commercials are Bullish with a score of 52.8 percent and the small traders (not shown in chart) are Bullish with a score of 66.3 percent.
Price Trend-Following Model: Downtrend
Our weekly trend-following model classifies the current market price position as: Downtrend. The current action for the model is considered to be: Hold – Maintain Short Position.
| Silver Futures Statistics | SPECULATORS | COMMERCIALS | SMALL TRADERS |
| – Percent of Open Interest Longs: | 37.8 | 34.0 | 21.5 |
| – Percent of Open Interest Shorts: | 27.7 | 56.5 | 9.0 |
| – Net Position: | 14,499 | -32,448 | 17,949 |
| – Gross Longs: | 54,546 | 49,112 | 30,987 |
| – Gross Shorts: | 40,047 | 81,560 | 13,038 |
| – Long to Short Ratio: | 1.4 to 1 | 0.6 to 1 | 2.4 to 1 |
| NET POSITION TREND: | |||
| – Strength Index Score (3 Year Range Pct): | 41.6 | 52.8 | 66.3 |
| – Strength Index Reading (3 Year Range): | Bearish | Bullish | Bullish |
| NET POSITION MOVEMENT INDEX: | |||
| – 6-Week Change in Strength Index: | -16.9 | 14.2 | -1.2 |
Copper Grade #1 Futures:
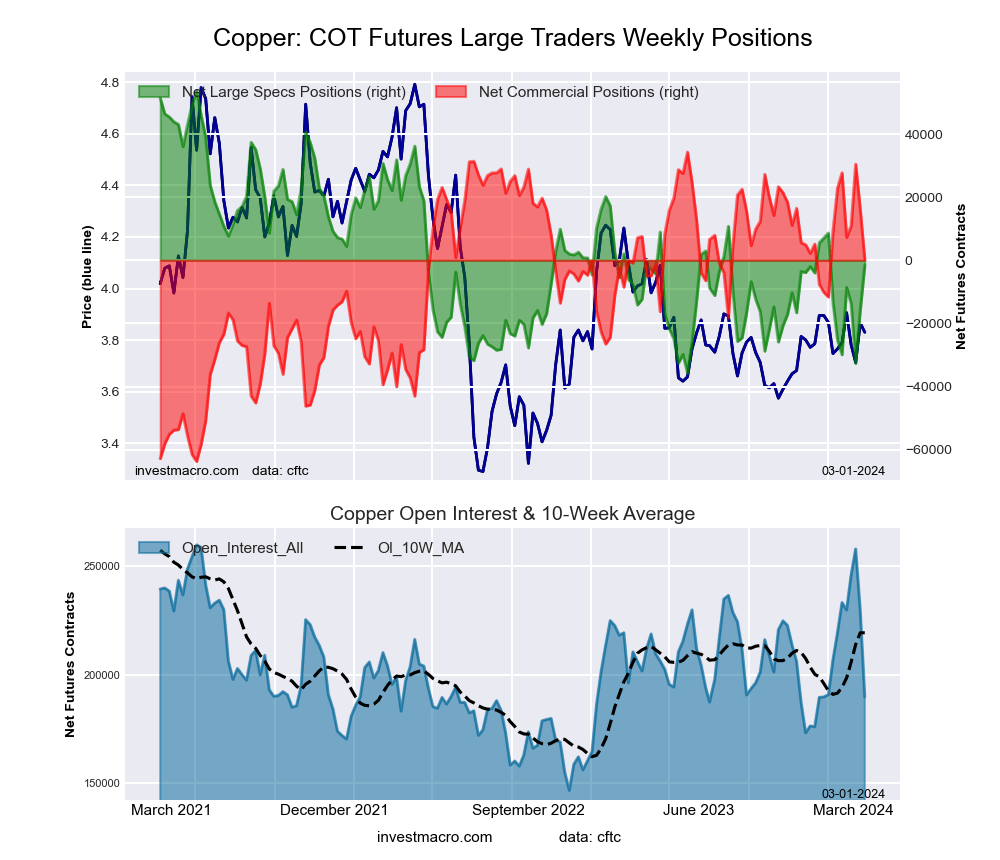 The Copper Grade #1 Futures large speculator standing this week reached a net position of -1,603 contracts in the data reported through Tuesday. This was a weekly boost of 14,339 contracts from the previous week which had a total of -15,942 net contracts.
This week’s current strength score (the trader positioning range over the past three years, measured from 0 to 100) shows the speculators are currently Bearish with a score of 38.1 percent. The commercials are Bullish with a score of 65.3 percent and the small traders (not shown in chart) are Bearish with a score of 26.8 percent.
Price Trend-Following Model: Uptrend
Our weekly trend-following model classifies the current market price position as: Uptrend. The current action for the model is considered to be: Hold – Maintain Long Position.
| Copper Futures Statistics | SPECULATORS | COMMERCIALS | SMALL TRADERS |
| – Percent of Open Interest Longs: | 36.7 | 36.7 | 8.5 |
| – Percent of Open Interest Shorts: | 37.6 | 36.5 | 7.8 |
| – Net Position: | -1,603 | 280 | 1,323 |
| – Gross Longs: | 69,673 | 69,614 | 16,214 |
| – Gross Shorts: | 71,276 | 69,334 | 14,891 |
| – Long to Short Ratio: | 1.0 to 1 | 1.0 to 1 | 1.1 to 1 |
| NET POSITION TREND: | |||
| – Strength Index Score (3 Year Range Pct): | 38.1 | 65.3 | 26.8 |
| – Strength Index Reading (3 Year Range): | Bearish | Bullish | Bearish |
| NET POSITION MOVEMENT INDEX: | |||
| – 6-Week Change in Strength Index: | 26.5 | -23.0 | -7.1 |
Platinum Futures:
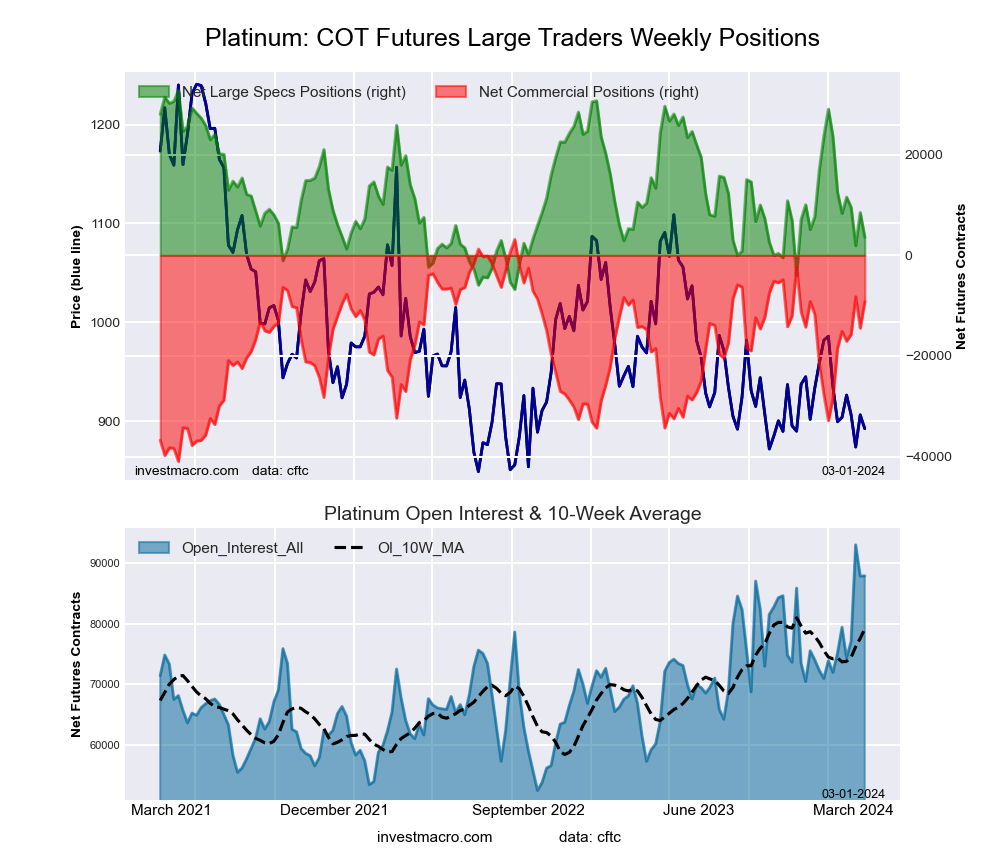 The Platinum Futures large speculator standing this week reached a net position of 3,601 contracts in the data reported through Tuesday. This was a weekly lowering of -4,894 contracts from the previous week which had a total of 8,495 net contracts.
This week’s current strength score (the trader positioning range over the past three years, measured from 0 to 100) shows the speculators are currently Bearish with a score of 26.2 percent. The commercials are Bullish with a score of 72.0 percent and the small traders (not shown in chart) are Bearish with a score of 43.0 percent.
Price Trend-Following Model: Strong Downtrend
Our weekly trend-following model classifies the current market price position as: Strong Downtrend. The current action for the model is considered to be: New Sell – Short Position.
| Platinum Futures Statistics | SPECULATORS | COMMERCIALS | SMALL TRADERS |
| – Percent of Open Interest Longs: | 56.8 | 23.4 | 10.8 |
| – Percent of Open Interest Shorts: | 52.7 | 33.9 | 4.4 |
| – Net Position: | 3,601 | -9,201 | 5,600 |
| – Gross Longs: | 49,898 | 20,570 | 9,492 |
| – Gross Shorts: | 46,297 | 29,771 | 3,892 |
| – Long to Short Ratio: | 1.1 to 1 | 0.7 to 1 | 2.4 to 1 |
| NET POSITION TREND: | |||
| – Strength Index Score (3 Year Range Pct): | 26.2 | 72.0 | 43.0 |
| – Strength Index Reading (3 Year Range): | Bearish | Bullish | Bearish |
| NET POSITION MOVEMENT INDEX: | |||
| – 6-Week Change in Strength Index: | -22.7 | 21.1 | -4.5 |
Palladium Futures:
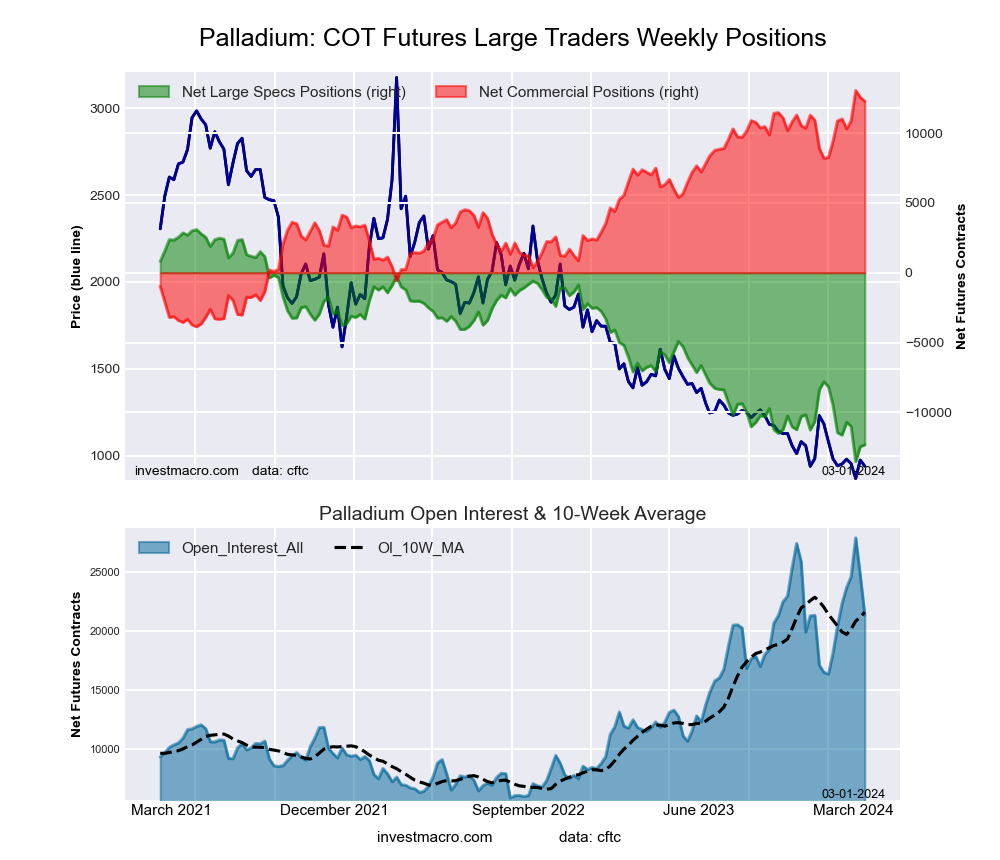 The Palladium Futures large speculator standing this week reached a net position of -12,315 contracts in the data reported through Tuesday. This was a weekly increase of 138 contracts from the previous week which had a total of -12,453 net contracts.
This week’s current strength score (the trader positioning range over the past three years, measured from 0 to 100) shows the speculators are currently Bearish-Extreme with a score of 7.2 percent. The commercials are Bullish-Extreme with a score of 95.5 percent and the small traders (not shown in chart) are Bearish with a score of 44.2 percent.
Price Trend-Following Model: Downtrend
Our weekly trend-following model classifies the current market price position as: Downtrend. The current action for the model is considered to be: Hold – Maintain Short Position.
| Palladium Futures Statistics | SPECULATORS | COMMERCIALS | SMALL TRADERS |
| – Percent of Open Interest Longs: | 20.7 | 62.7 | 8.0 |
| – Percent of Open Interest Shorts: | 78.5 | 5.2 | 7.8 |
| – Net Position: | -12,315 | 12,273 | 42 |
| – Gross Longs: | 4,411 | 13,372 | 1,708 |
| – Gross Shorts: | 16,726 | 1,099 | 1,666 |
| – Long to Short Ratio: | 0.3 to 1 | 12.2 to 1 | 1.0 to 1 |
| NET POSITION TREND: | |||
| – Strength Index Score (3 Year Range Pct): | 7.2 | 95.5 | 44.2 |
| – Strength Index Reading (3 Year Range): | Bearish-Extreme | Bullish-Extreme | Bearish |
| NET POSITION MOVEMENT INDEX: | |||
| – 6-Week Change in Strength Index: | -5.2 | 8.3 | -32.0 |
Steel Futures Futures:
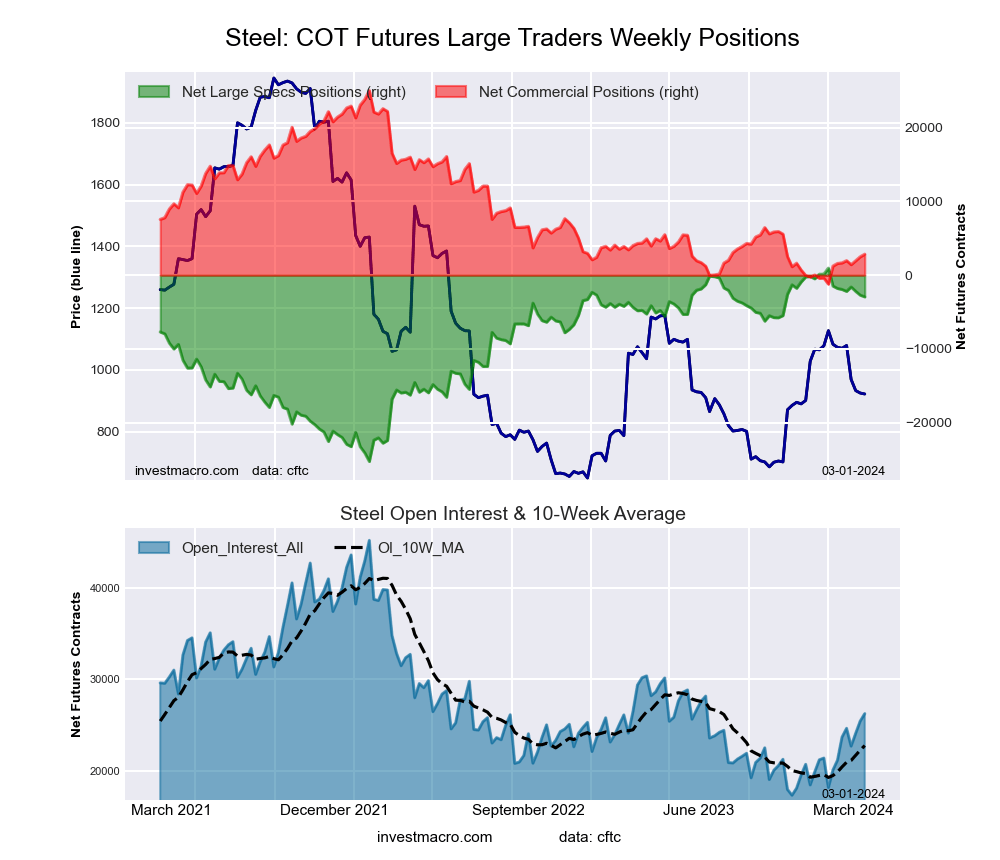 The Steel Futures large speculator standing this week reached a net position of -2,935 contracts in the data reported through Tuesday. This was a weekly fall of -234 contracts from the previous week which had a total of -2,701 net contracts.
This week’s current strength score (the trader positioning range over the past three years, measured from 0 to 100) shows the speculators are currently Bullish-Extreme with a score of 85.1 percent. The commercials are Bearish-Extreme with a score of 15.5 percent and the small traders (not shown in chart) are Bearish with a score of 41.8 percent.
Price Trend-Following Model: Weak Uptrend
Our weekly trend-following model classifies the current market price position as: Weak Uptrend. The current action for the model is considered to be: Hold – Maintain Long Position.
| Steel Futures Statistics | SPECULATORS | COMMERCIALS | SMALL TRADERS |
| – Percent of Open Interest Longs: | 11.2 | 82.8 | 1.0 |
| – Percent of Open Interest Shorts: | 22.4 | 72.0 | 0.7 |
| – Net Position: | -2,935 | 2,849 | 86 |
| – Gross Longs: | 2,937 | 21,733 | 269 |
| – Gross Shorts: | 5,872 | 18,884 | 183 |
| – Long to Short Ratio: | 0.5 to 1 | 1.2 to 1 | 1.5 to 1 |
| NET POSITION TREND: | |||
| – Strength Index Score (3 Year Range Pct): | 85.1 | 15.5 | 41.8 |
| – Strength Index Reading (3 Year Range): | Bullish-Extreme | Bearish-Extreme | Bearish |
| NET POSITION MOVEMENT INDEX: | |||
| – 6-Week Change in Strength Index: | -4.4 | 4.8 | -12.3 |
Article By InvestMacro – Receive our weekly COT Newsletter
*COT Report: The COT data, released weekly to the public each Friday, is updated through the most recent Tuesday (data is 3 days old) and shows a quick view of how large speculators or non-commercials (for-profit traders) were positioned in the futures markets.
The CFTC categorizes trader positions according to commercial hedgers (traders who use futures contracts for hedging as part of the business), non-commercials (large traders who speculate to realize trading profits) and nonreportable traders (usually small traders/speculators) as well as their open interest (contracts open in the market at time of reporting). See CFTC criteria here.

- Investors run to safe-haven assets amid Middle East escalation Mar 6, 2026
- EUR/USD Under Pressure: Middle East Risks Outweigh All Else Mar 6, 2026
- Bitcoin shows resilience to Middle East events. Oil market stabilizes Mar 5, 2026
- GBP/USD: Market Not Expecting BoE Rate Cut in March Mar 5, 2026
- Brent headed for $100? Mar 4, 2026
- Global stock indices continue sell-off due to Middle East conflict Mar 4, 2026
- USD/JPY to Quickly Return to Growth: Momentum Favours the US Dollar Mar 4, 2026
- European equities plunge amid Persian Gulf military conflict Mar 3, 2026
- Gold Rallies for Fifth Day, With External Risks Mounting Mar 3, 2026
- Iran Crisis: A Dangerous Turning Point Mar 2, 2026