By InvestMacro.com | #stocks #NVDA #NVIDIA
The NVIDIA Corporation (NVDA) stock finished the day with an advance of 9.01 percent and closed the day around the 119.60 price level, according to unofficial data at the New York close.
NVIDIA, a technology company that is recognized as a leader in GPU units for computers, opened the trading day at 109.71 price level with the high of the day at 120.78 and the low of the day falling to 108.13.
NVIDIA’s stock had fallen in four out of the previous five days and has dipped to trading at its lowest levels in two years, dating back to August 2020.
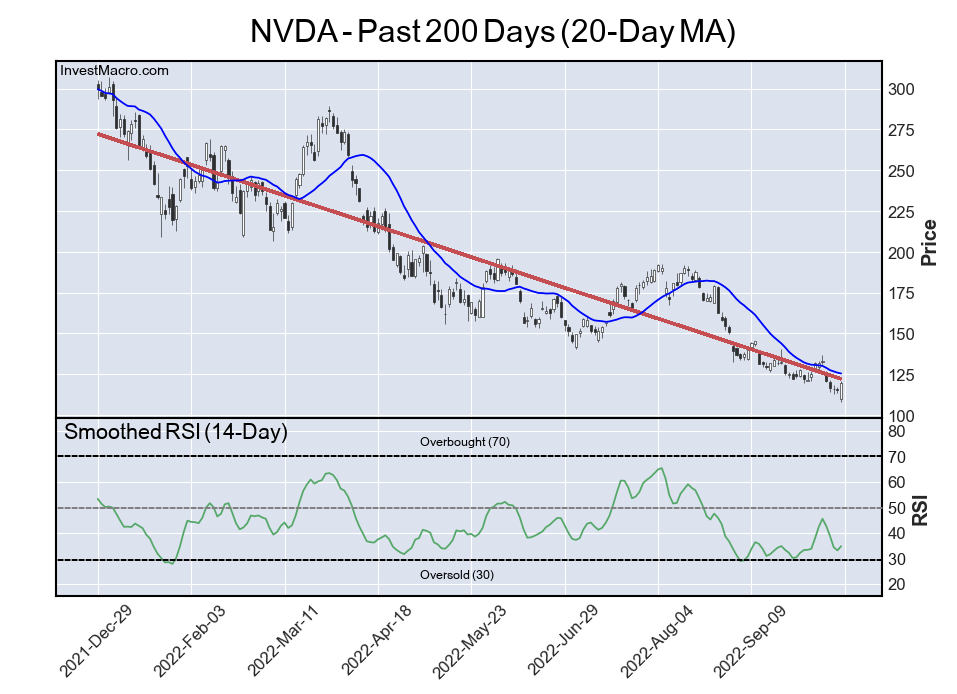
The stock is currently trending sharply lower over the past 200 trading days, according to the linear regression line (red) seen on the chart below. NVDA has lost approximately over half of its share price value since December 2021.
The Relative Strength Index, an indicator that can identify overbought (above 70) and oversold levels (below 30), shows that the current RSI is at a 38.5 score. This is a Bearish reading on the daily time-frame.
Free Reports:
The NVDA is lower by -2.13 percent over the past 10 days while seeing a step lower by -20.76 over the past 30 days. The 90-day change is -36.32 while the 180-day return and the 365-day return are -47.46 and -16.59, respectively.
By InvestMacro.com – – Get our stock market newsletter for stock rankings, charts & updates
By InvestMacro Here are the latest charts and statistics for the Commitment of Traders (COT)…
By InvestMacro Here are the latest charts and statistics for the Commitment of Traders (COT)…
By ForexTime FXTM’s USDInd ↑ 2% MTD Dollar best performing G10 currency MTD Geopolitical risk…
By JustMarkets The US stock market concluded Thursday’s session in the red as the escalating…
By Analytical Department RoboForex EUR/USD is holding near 1.1620 on Friday, with the US dollar…
By JustMarkets The US stock market rose on Wednesday. By the end of the day,…
This website uses cookies.