By RoboForex Analytical Department
The commodity market remains extremely volatile. On Monday, a Brent barrel is declining to 91.50 USD and looks unstable. Previously, the market was afraid that Russia will cut down on supply and pushed prices upwards, but risks of stable demand have become more serious now.
This week, investors will keep an eye on the flow of inflation statistics both from the EU and the US. In the latter case, the information will help to form clearer expectations from the results of the Fed’s meeting in September.
Baker Hughes statistics, published earlier, demonstrated a decline in the number of active oil rigs in the US – by 5 units to 591 rigs.
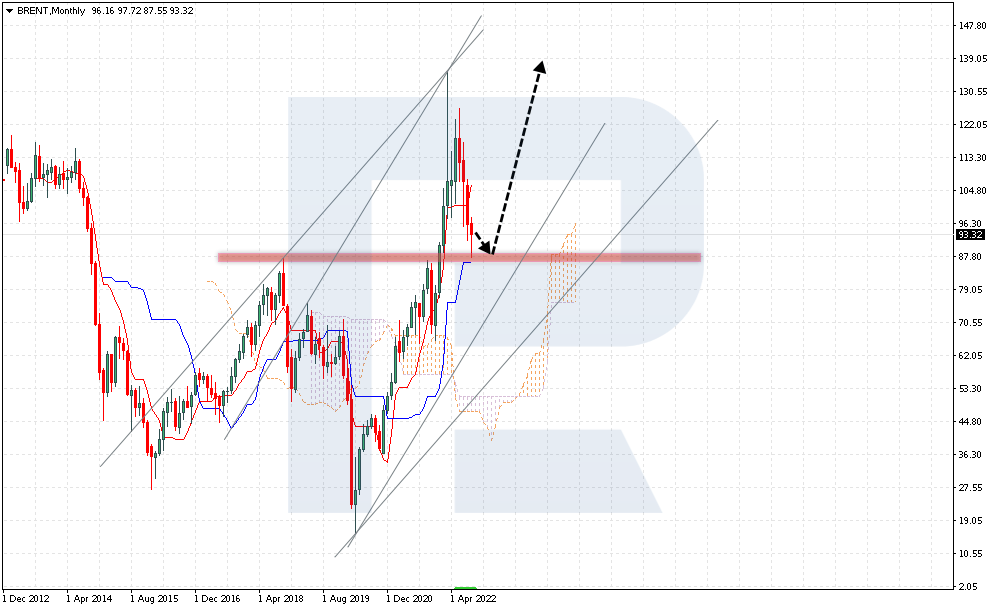
Regardless of Brent falling on, the current movement can still be interpreted as a correction of a mighty bullish trend. The quotes are now testing the support area that used to be a strong resistance level in 2018 and 2020. It was broken away only at the beginning of this year. The price pattern is a bullish 5-0. By this pattern, after a correction the price will head for renewing the high, so in the long run, the quotes may rise to 139.00. The downtrend may start again only if the lower border of the Cloud is broken and prices secure under 70.00.
Free Reports:
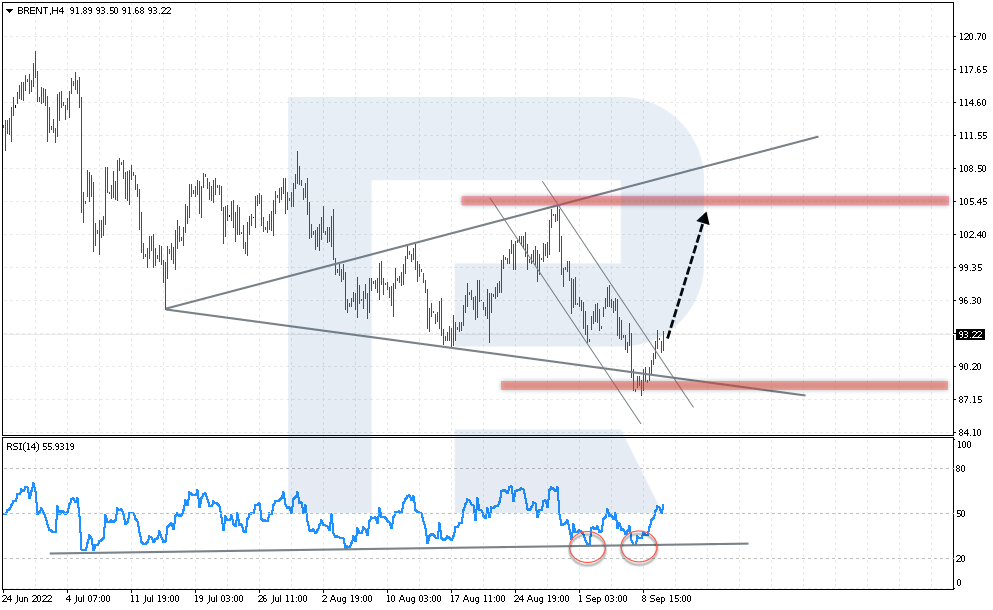
On H4, Brent has bounced off the lower border of a bullish Wolfe Wave. The goal of the movement is 105.45. A strong signal confirming the growth of the pair will be a breakaway of the upper border of the descending channel. With it, the descending movement that started at the end of August will be over. The second signal is a Double Bottom reversal pattern forming on the RSI. The indicator is already testing the upper border of the pattern, and as soon as it is broken away, they might hit 80. A negative scenario for the bulls will be another price decline and securing under 86.00, which will cancel the bullish pattern and indicate further falling.
Disclaimer
Any forecasts contained herein are based on the author’s particular opinion. This analysis may not be treated as trading advice. RoboForex bears no responsibility for trading results based on trading recommendations and reviews contained herein.
By InvestMacro Here are the latest charts and statistics for the Commitment of Traders (COT)…
By InvestMacro Here are the latest charts and statistics for the Commitment of Traders (COT)…
By InvestMacro Here are the latest charts and statistics for the Commitment of Traders (COT)…
By ForexTime FXTM’s USDInd ↑ 2% MTD Dollar best performing G10 currency MTD Geopolitical risk…
By JustMarkets The US stock market concluded Thursday’s session in the red as the escalating…
By Analytical Department RoboForex EUR/USD is holding near 1.1620 on Friday, with the US dollar…
This website uses cookies.