By InvestMacro | COT | Data Tables | COT Leaders | Downloads | COT Newsletter
Here are the latest charts and statistics for the Commitment of Traders (COT) data published by the Commodities Futures Trading Commission (CFTC).
The latest COT data is updated through Tuesday August 16th and shows a quick view of how large traders (for-profit speculators and commercial entities) were positioned in the futures markets. All currency positions are in direct relation to the US dollar where, for example, a bet for the euro is a bet that the euro will rise versus the dollar while a bet against the euro will be a bet that the euro will decline versus the dollar.
The COT currency market speculator bets were overall higher this week as seven out of the eleven currency markets we cover had higher positioning while the other four markets had lower speculator positions.
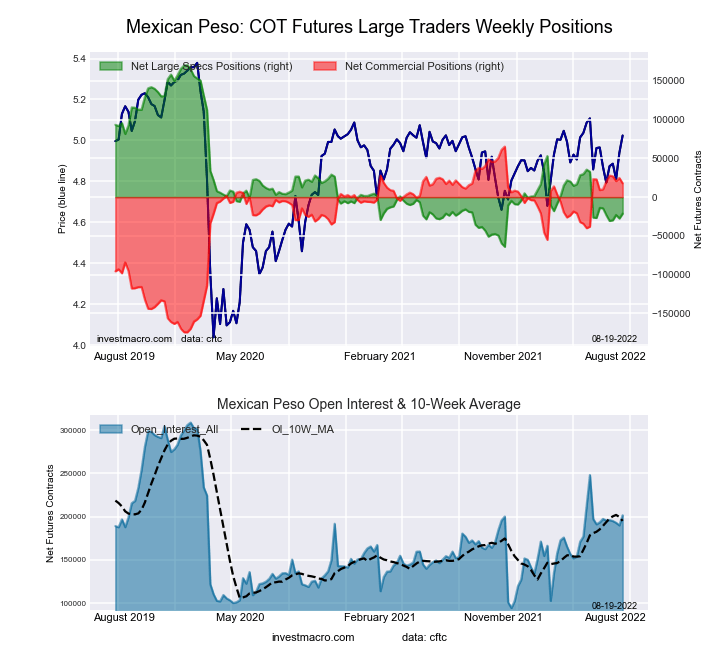
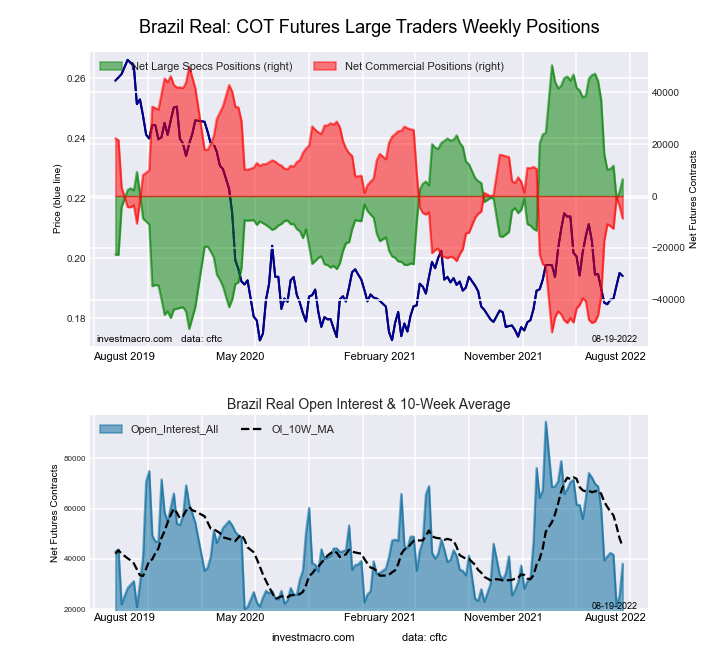
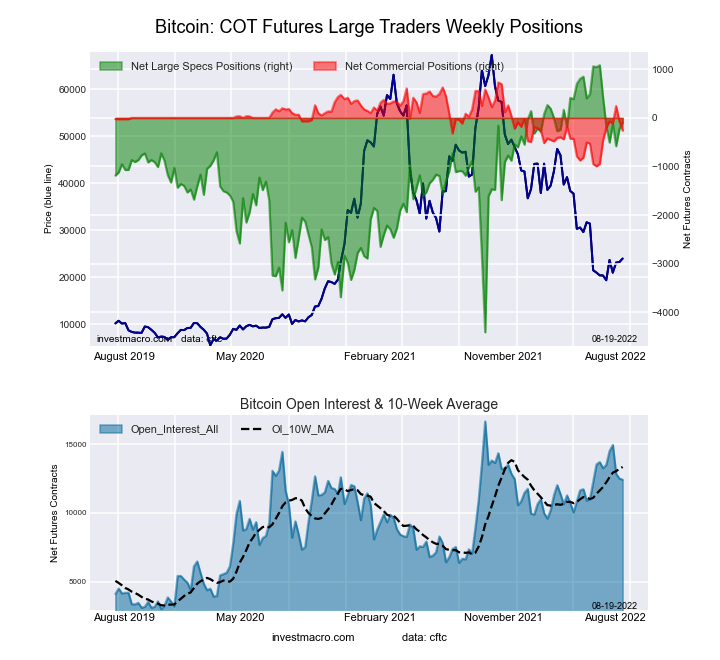
Leading the gains for the currency markets was the Mexican peso (6,250 contracts) with the Canadian dollar (5,644 contracts), Brazilian real (4,790 contracts), Swiss franc (4,686 contracts), New Zealand dollar (2,045 contracts), British pound sterling (1,359 contracts) and Bitcoin (137 contracts) also having positive weeks.
Free Reports:
The currencies leading the declines in speculator bets this week were the Euro (-8,248 contracts) with the Japanese yen (-3,859 contracts), Australian dollar (-1,660 contracts) and the US Dollar Index (-676 contracts) also registering lower bets on the week.
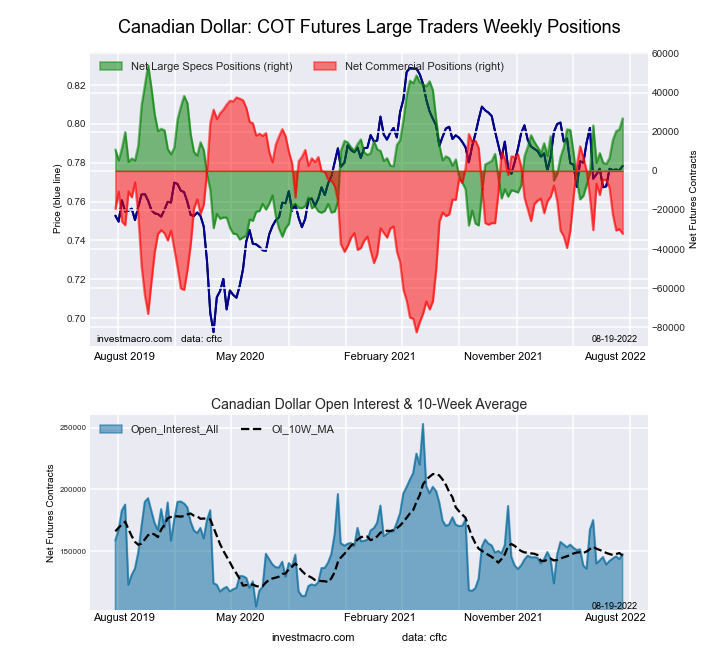
Highlighting the COT currency changes this week is the Canadian dollar‘s recent gains in the speculator positions. The CAD positions rose this week and have now gained for five straight weeks and in ten out of the past thirteen weeks for a total 13-week gain of +41,363 contracts. The speculative position had fallen into bearish territory from April 26th to June 7th before getting a large sentiment boost by +24,264 contracts on June 14th that flipped the position from bearish to bullish. Since then, the bullish position has steadily increased and this week, reached the most bullish level since July 6th of 2021, a span of fifty-eight weeks.
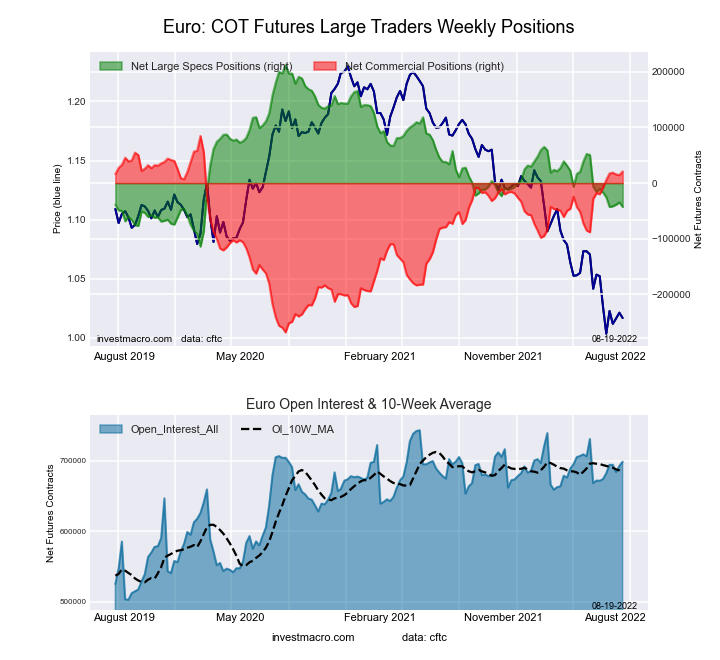
Euro speculative bets this week, meanwhile, fell for the first time in the past four weeks but made a new low for this recent bearish cycle. Euro bets dropped by over -8,000 contracts this week and have now been in an overall bearish position for the past ten weeks. The decline of bets this week brought the current speculator standing to the most bearish level since March 3rd of 2020, a span of one hundred and twenty-eight weeks. The EURUSD currency pair fell rather sharply to end the week (weekly decline by over -2.00 percent) and closed just a hair above parity at the 1.0041 exchange rate. The EURUSD dropped below parity for a quick time on July 14th with a low of 0.9952 (20-year lows) before staging a rally back over 1.0350 in the following weeks but with deteriorating speculator sentiment, it seems possible the pair will be testing below parity again.
| Aug-16-2022 | OI | OI-Index | Spec-Net | Spec-Index | Com-Net | COM-Index | Smalls-Net | Smalls-Index |
|---|---|---|---|---|---|---|---|---|
| USD Index | 58,909 | 86 | 37,961 | 88 | -40,673 | 11 | 2,712 | 46 |
| EUR | 698,570 | 81 | -42,784 | 22 | 20,916 | 82 | 21,868 | 11 |
| GBP | 227,752 | 62 | -33,109 | 46 | 47,217 | 59 | -14,108 | 26 |
| JPY | 228,697 | 74 | -28,891 | 51 | 41,979 | 56 | -13,088 | 27 |
| CHF | 39,407 | 20 | -5,096 | 44 | 13,616 | 65 | -8,520 | 29 |
| CAD | 147,596 | 29 | 26,867 | 70 | -32,129 | 42 | 5,262 | 41 |
| AUD | 160,045 | 52 | -59,248 | 30 | 63,470 | 66 | -4,222 | 42 |
| NZD | 41,729 | 28 | 1,769 | 74 | 195 | 31 | -1,964 | 29 |
| MXN | 201,618 | 50 | -21,371 | 18 | 17,803 | 80 | 3,568 | 58 |
| RUB | 20,930 | 4 | 7,543 | 31 | -7,150 | 69 | -393 | 24 |
| BRL | 38,079 | 24 | 6,523 | 57 | -8,659 | 43 | 2,136 | 90 |
| Bitcoin | 12,423 | 69 | -93 | 79 | -260 | 0 | 353 | 21 |
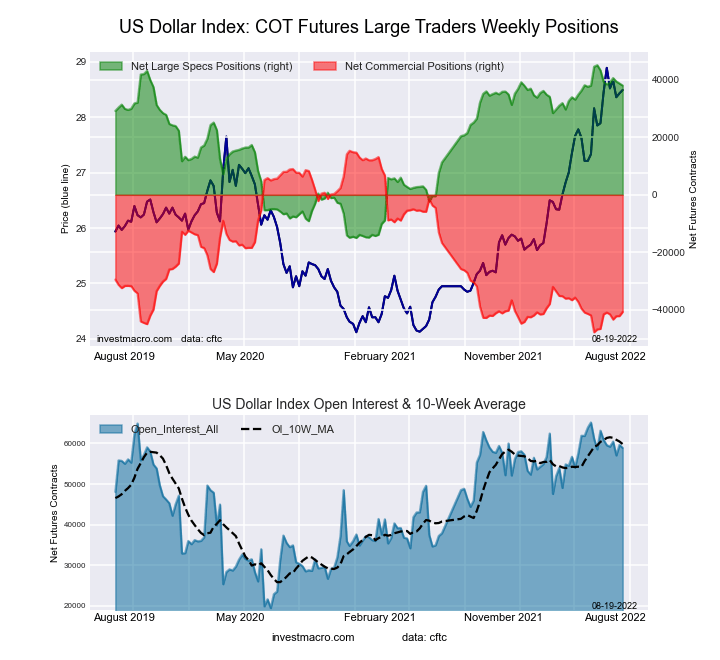
Strength Scores (a normalized measure of Speculator positions over a 3-Year range, from 0 to 100 where above 80 is extreme bullish and below 20 is extreme bearish) show that the US Dollar Index (88.2 percent) remains at the highest levels for the currency markets and continues in a bullish extreme position (above 80 percent). Bitcoin (78.6 percent), the New Zealand Dollar (74.2 percent) and the Canadian Dollar (69.5 percent) round out the next highest strength scores in the currency markets. On the downside, the Mexican Peso (18.2 percent) comes in at the lowest strength level and is in a bearish extreme level (below 20 percent). The next currencies at the lower range of strength scores are the EuroFX at 21.9 percent and the Australian Dollar at 29.9 percent.
Strength Statistics:
US Dollar Index (88.2 percent) vs US Dollar Index previous week (89.4 percent)
EuroFX (21.9 percent) vs EuroFX previous week (24.4 percent)
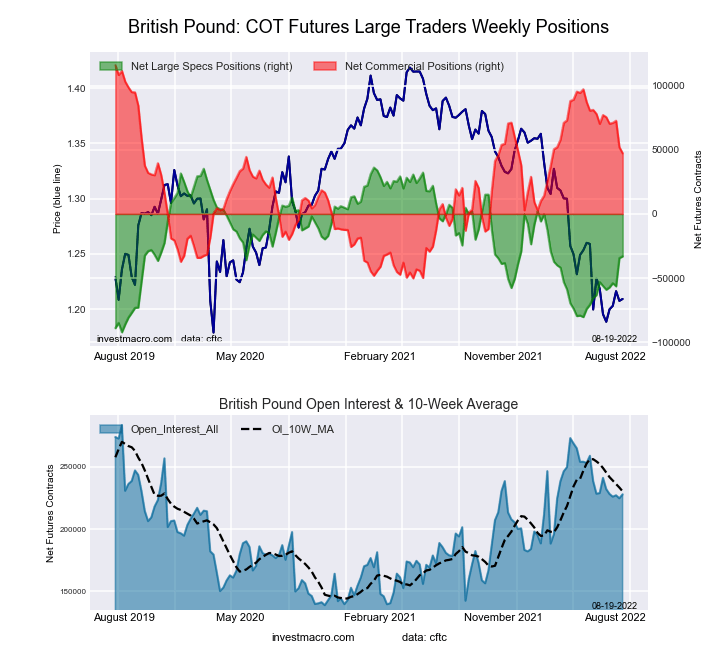
British Pound Sterling (46.1 percent) vs British Pound Sterling previous week (45.0 percent)
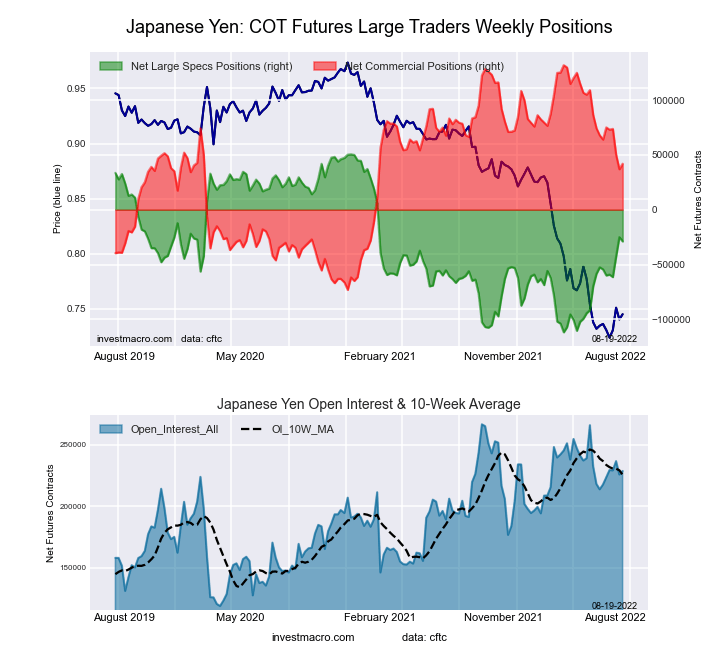
Japanese Yen (51.1 percent) vs Japanese Yen previous week (53.5 percent)
Swiss Franc (43.6 percent) vs Swiss Franc previous week (31.7 percent)
Canadian Dollar (69.5 percent) vs Canadian Dollar previous week (63.2 percent)
Australian Dollar (29.9 percent) vs Australian Dollar previous week (31.4 percent)
New Zealand Dollar (74.2 percent) vs New Zealand Dollar previous week (70.8 percent)
Mexican Peso (18.2 percent) vs Mexican Peso previous week (15.6 percent)
Brazil Real (56.8 percent) vs Brazil Real previous week (52.1 percent)
Bitcoin (78.6 percent) vs Bitcoin previous week (76.1 percent)
Strength Score Trends (or move index, calculates the 6-week changes in strength scores) show that the Canadian Dollar (25.3 percent) leads the past six weeks trends for the currency markets this week. The British Pound Sterling (18.0 percent), the Japanese Yen (15.7 percent) and the New Zealand Dollar (14.8 percent) fill out the other highest movers in the latest trends data. The Australian Dollar (-10.8 percent) leads the downside trend scores currently while the next market with lower trend scores were the Brazilian Real (-9.6 percent) followed by Bitcoin (-9.3 percent) and the EuroFX (-8.0 percent).
Strength Trend Statistics:
US Dollar Index (-2.2 percent) vs US Dollar Index previous week (-7.7 percent)
EuroFX (-8.0 percent) vs EuroFX previous week (-7.3 percent)
British Pound Sterling (18.0 percent) vs British Pound Sterling previous week (14.5 percent)
Japanese Yen (15.7 percent) vs Japanese Yen previous week (17.0 percent)
Swiss Franc (12.8 percent) vs Swiss Franc previous week (-3.0 percent)
Canadian Dollar (25.3 percent) vs Canadian Dollar previous week (13.6 percent)
Australian Dollar (-10.8 percent) vs Australian Dollar previous week (-13.5 percent)
New Zealand Dollar (14.8 percent) vs New Zealand Dollar previous week (8.4 percent)
Mexican Peso (-3.0 percent) vs Mexican Peso previous week (-5.8 percent)
Brazil Real (-9.6 percent) vs Brazil Real previous week (-34.7 percent)
Bitcoin (-9.3 percent) vs Bitcoin previous week (-23.9 percent)
This week’s current strength score (the trader positioning range over the past three years, measured from 0 to 100) shows the speculators are currently Bullish-Extreme with a score of 88.2 percent. The commercials are Bearish-Extreme with a score of 11.2 percent and the small traders (not shown in chart) are Bearish with a score of 46.2 percent.
| US DOLLAR INDEX Statistics | SPECULATORS | COMMERCIALS | SMALL TRADERS |
| – Percent of Open Interest Longs: | 86.2 | 3.5 | 8.2 |
| – Percent of Open Interest Shorts: | 21.8 | 72.6 | 3.6 |
| – Net Position: | 37,961 | -40,673 | 2,712 |
| – Gross Longs: | 50,782 | 2,078 | 4,843 |
| – Gross Shorts: | 12,821 | 42,751 | 2,131 |
| – Long to Short Ratio: | 4.0 to 1 | 0.0 to 1 | 2.3 to 1 |
| NET POSITION TREND: | |||
| – Strength Index Score (3 Year Range Pct): | 88.2 | 11.2 | 46.2 |
| – Strength Index Reading (3 Year Range): | Bullish-Extreme | Bearish-Extreme | Bearish |
| NET POSITION MOVEMENT INDEX: | |||
| – 6-Week Change in Strength Index: | -2.2 | 1.3 | 5.0 |
This week’s current strength score (the trader positioning range over the past three years, measured from 0 to 100) shows the speculators are currently Bearish with a score of 21.9 percent. The commercials are Bullish-Extreme with a score of 82.0 percent and the small traders (not shown in chart) are Bearish-Extreme with a score of 10.6 percent.
| EURO Currency Statistics | SPECULATORS | COMMERCIALS | SMALL TRADERS |
| – Percent of Open Interest Longs: | 28.5 | 57.3 | 11.4 |
| – Percent of Open Interest Shorts: | 34.6 | 54.3 | 8.3 |
| – Net Position: | -42,784 | 20,916 | 21,868 |
| – Gross Longs: | 199,226 | 400,458 | 79,589 |
| – Gross Shorts: | 242,010 | 379,542 | 57,721 |
| – Long to Short Ratio: | 0.8 to 1 | 1.1 to 1 | 1.4 to 1 |
| NET POSITION TREND: | |||
| – Strength Index Score (3 Year Range Pct): | 21.9 | 82.0 | 10.6 |
| – Strength Index Reading (3 Year Range): | Bearish | Bullish-Extreme | Bearish-Extreme |
| NET POSITION MOVEMENT INDEX: | |||
| – 6-Week Change in Strength Index: | -8.0 | 8.4 | -6.0 |
This week’s current strength score (the trader positioning range over the past three years, measured from 0 to 100) shows the speculators are currently Bearish with a score of 46.1 percent. The commercials are Bullish with a score of 58.7 percent and the small traders (not shown in chart) are Bearish with a score of 26.4 percent.
| BRITISH POUND Statistics | SPECULATORS | COMMERCIALS | SMALL TRADERS |
| – Percent of Open Interest Longs: | 19.4 | 68.6 | 8.7 |
| – Percent of Open Interest Shorts: | 33.9 | 47.8 | 14.9 |
| – Net Position: | -33,109 | 47,217 | -14,108 |
| – Gross Longs: | 44,084 | 156,167 | 19,890 |
| – Gross Shorts: | 77,193 | 108,950 | 33,998 |
| – Long to Short Ratio: | 0.6 to 1 | 1.4 to 1 | 0.6 to 1 |
| NET POSITION TREND: | |||
| – Strength Index Score (3 Year Range Pct): | 46.1 | 58.7 | 26.4 |
| – Strength Index Reading (3 Year Range): | Bearish | Bullish | Bearish |
| NET POSITION MOVEMENT INDEX: | |||
| – 6-Week Change in Strength Index: | 18.0 | -17.9 | 13.9 |
This week’s current strength score (the trader positioning range over the past three years, measured from 0 to 100) shows the speculators are currently Bullish with a score of 51.1 percent. The commercials are Bullish with a score of 56.1 percent and the small traders (not shown in chart) are Bearish with a score of 26.9 percent.
| JAPANESE YEN Statistics | SPECULATORS | COMMERCIALS | SMALL TRADERS |
| – Percent of Open Interest Longs: | 22.4 | 66.6 | 9.4 |
| – Percent of Open Interest Shorts: | 35.1 | 48.2 | 15.1 |
| – Net Position: | -28,891 | 41,979 | -13,088 |
| – Gross Longs: | 51,308 | 152,209 | 21,465 |
| – Gross Shorts: | 80,199 | 110,230 | 34,553 |
| – Long to Short Ratio: | 0.6 to 1 | 1.4 to 1 | 0.6 to 1 |
| NET POSITION TREND: | |||
| – Strength Index Score (3 Year Range Pct): | 51.1 | 56.1 | 26.9 |
| – Strength Index Reading (3 Year Range): | Bullish | Bullish | Bearish |
| NET POSITION MOVEMENT INDEX: | |||
| – 6-Week Change in Strength Index: | 15.7 | -10.8 | -7.0 |
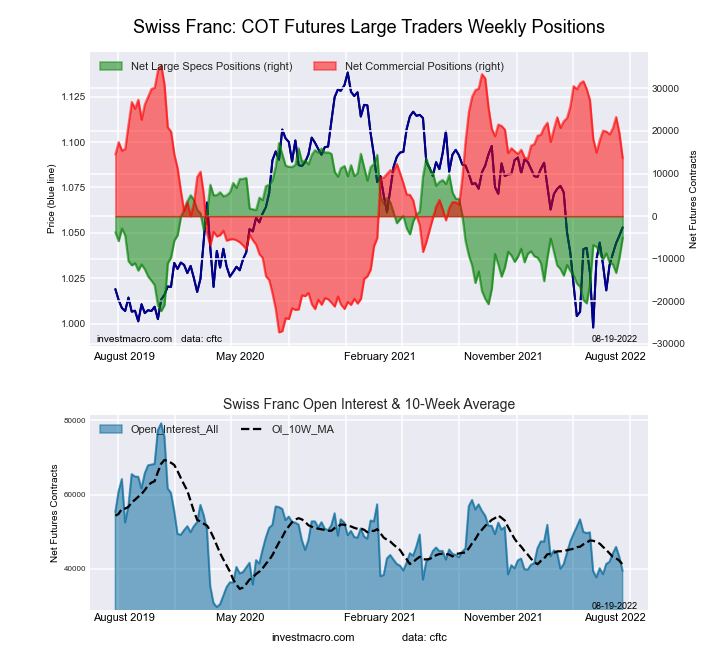
This week’s current strength score (the trader positioning range over the past three years, measured from 0 to 100) shows the speculators are currently Bearish with a score of 43.6 percent. The commercials are Bullish with a score of 65.2 percent and the small traders (not shown in chart) are Bearish with a score of 28.7 percent.
| SWISS FRANC Statistics | SPECULATORS | COMMERCIALS | SMALL TRADERS |
| – Percent of Open Interest Longs: | 19.7 | 55.2 | 24.9 |
| – Percent of Open Interest Shorts: | 32.7 | 20.7 | 46.5 |
| – Net Position: | -5,096 | 13,616 | -8,520 |
| – Gross Longs: | 7,773 | 21,767 | 9,809 |
| – Gross Shorts: | 12,869 | 8,151 | 18,329 |
| – Long to Short Ratio: | 0.6 to 1 | 2.7 to 1 | 0.5 to 1 |
| NET POSITION TREND: | |||
| – Strength Index Score (3 Year Range Pct): | 43.6 | 65.2 | 28.7 |
| – Strength Index Reading (3 Year Range): | Bearish | Bullish | Bearish |
| NET POSITION MOVEMENT INDEX: | |||
| – 6-Week Change in Strength Index: | 12.8 | -10.3 | 4.8 |
This week’s current strength score (the trader positioning range over the past three years, measured from 0 to 100) shows the speculators are currently Bullish with a score of 69.5 percent. The commercials are Bearish with a score of 42.0 percent and the small traders (not shown in chart) are Bearish with a score of 40.7 percent.
| CANADIAN DOLLAR Statistics | SPECULATORS | COMMERCIALS | SMALL TRADERS |
| – Percent of Open Interest Longs: | 35.1 | 39.6 | 22.4 |
| – Percent of Open Interest Shorts: | 16.9 | 61.4 | 18.9 |
| – Net Position: | 26,867 | -32,129 | 5,262 |
| – Gross Longs: | 51,843 | 58,476 | 33,129 |
| – Gross Shorts: | 24,976 | 90,605 | 27,867 |
| – Long to Short Ratio: | 2.1 to 1 | 0.6 to 1 | 1.2 to 1 |
| NET POSITION TREND: | |||
| – Strength Index Score (3 Year Range Pct): | 69.5 | 42.0 | 40.7 |
| – Strength Index Reading (3 Year Range): | Bullish | Bearish | Bearish |
| NET POSITION MOVEMENT INDEX: | |||
| – 6-Week Change in Strength Index: | 25.3 | -23.0 | 10.1 |
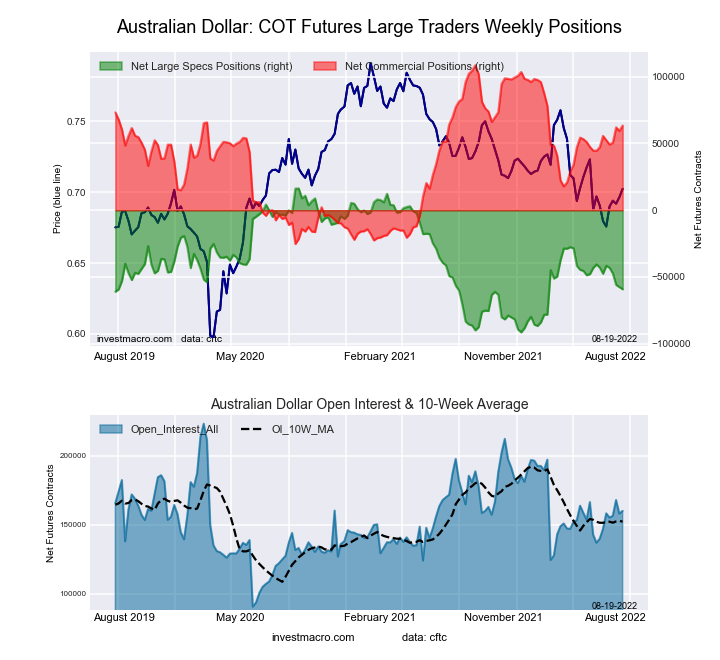
This week’s current strength score (the trader positioning range over the past three years, measured from 0 to 100) shows the speculators are currently Bearish with a score of 29.9 percent. The commercials are Bullish with a score of 66.2 percent and the small traders (not shown in chart) are Bearish with a score of 42.1 percent.
| AUSTRALIAN DOLLAR Statistics | SPECULATORS | COMMERCIALS | SMALL TRADERS |
| – Percent of Open Interest Longs: | 18.0 | 69.3 | 10.4 |
| – Percent of Open Interest Shorts: | 55.0 | 29.6 | 13.0 |
| – Net Position: | -59,248 | 63,470 | -4,222 |
| – Gross Longs: | 28,835 | 110,918 | 16,660 |
| – Gross Shorts: | 88,083 | 47,448 | 20,882 |
| – Long to Short Ratio: | 0.3 to 1 | 2.3 to 1 | 0.8 to 1 |
| NET POSITION TREND: | |||
| – Strength Index Score (3 Year Range Pct): | 29.9 | 66.2 | 42.1 |
| – Strength Index Reading (3 Year Range): | Bearish | Bullish | Bearish |
| NET POSITION MOVEMENT INDEX: | |||
| – 6-Week Change in Strength Index: | -10.8 | 5.8 | 9.4 |
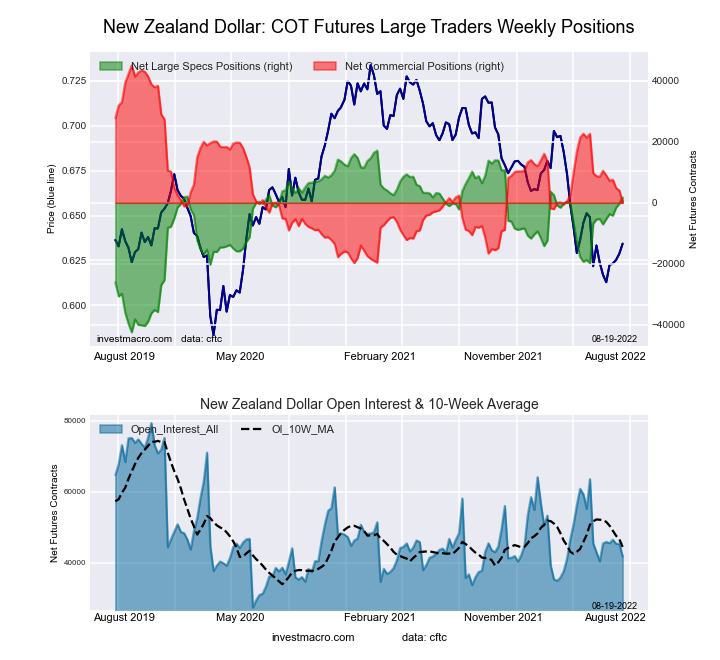
This week’s current strength score (the trader positioning range over the past three years, measured from 0 to 100) shows the speculators are currently Bullish with a score of 74.2 percent. The commercials are Bearish with a score of 30.7 percent and the small traders (not shown in chart) are Bearish with a score of 29.1 percent.
| NEW ZEALAND DOLLAR Statistics | SPECULATORS | COMMERCIALS | SMALL TRADERS |
| – Percent of Open Interest Longs: | 44.1 | 49.6 | 5.9 |
| – Percent of Open Interest Shorts: | 39.9 | 49.1 | 10.6 |
| – Net Position: | 1,769 | 195 | -1,964 |
| – Gross Longs: | 18,412 | 20,688 | 2,458 |
| – Gross Shorts: | 16,643 | 20,493 | 4,422 |
| – Long to Short Ratio: | 1.1 to 1 | 1.0 to 1 | 0.6 to 1 |
| NET POSITION TREND: | |||
| – Strength Index Score (3 Year Range Pct): | 74.2 | 30.7 | 29.1 |
| – Strength Index Reading (3 Year Range): | Bullish | Bearish | Bearish |
| NET POSITION MOVEMENT INDEX: | |||
| – 6-Week Change in Strength Index: | 14.8 | -15.9 | 17.3 |
This week’s current strength score (the trader positioning range over the past three years, measured from 0 to 100) shows the speculators are currently Bearish-Extreme with a score of 18.2 percent. The commercials are Bullish-Extreme with a score of 80.2 percent and the small traders (not shown in chart) are Bullish with a score of 58.1 percent.
| MEXICAN PESO Statistics | SPECULATORS | COMMERCIALS | SMALL TRADERS |
| – Percent of Open Interest Longs: | 53.9 | 42.7 | 3.4 |
| – Percent of Open Interest Shorts: | 64.5 | 33.8 | 1.6 |
| – Net Position: | -21,371 | 17,803 | 3,568 |
| – Gross Longs: | 108,642 | 85,997 | 6,782 |
| – Gross Shorts: | 130,013 | 68,194 | 3,214 |
| – Long to Short Ratio: | 0.8 to 1 | 1.3 to 1 | 2.1 to 1 |
| NET POSITION TREND: | |||
| – Strength Index Score (3 Year Range Pct): | 18.2 | 80.2 | 58.1 |
| – Strength Index Reading (3 Year Range): | Bearish-Extreme | Bullish-Extreme | Bullish |
| NET POSITION MOVEMENT INDEX: | |||
| – 6-Week Change in Strength Index: | -3.0 | 3.2 | -3.2 |
This week’s current strength score (the trader positioning range over the past three years, measured from 0 to 100) shows the speculators are currently Bullish with a score of 56.8 percent. The commercials are Bearish with a score of 42.8 percent and the small traders (not shown in chart) are Bullish-Extreme with a score of 89.8 percent.
| BRAZIL REAL Statistics | SPECULATORS | COMMERCIALS | SMALL TRADERS |
| – Percent of Open Interest Longs: | 67.7 | 22.7 | 9.7 |
| – Percent of Open Interest Shorts: | 50.5 | 45.4 | 4.1 |
| – Net Position: | 6,523 | -8,659 | 2,136 |
| – Gross Longs: | 25,762 | 8,637 | 3,679 |
| – Gross Shorts: | 19,239 | 17,296 | 1,543 |
| – Long to Short Ratio: | 1.3 to 1 | 0.5 to 1 | 2.4 to 1 |
| NET POSITION TREND: | |||
| – Strength Index Score (3 Year Range Pct): | 56.8 | 42.8 | 89.8 |
| – Strength Index Reading (3 Year Range): | Bullish | Bearish | Bullish-Extreme |
| NET POSITION MOVEMENT INDEX: | |||
| – 6-Week Change in Strength Index: | -9.6 | 8.5 | 12.5 |
This week’s current strength score (the trader positioning range over the past three years, measured from 0 to 100) shows the speculators are currently Bullish with a score of 78.6 percent. The commercials are Bearish with a score of 42.6 percent and the small traders (not shown in chart) are Bearish with a score of 21.0 percent.
| BITCOIN Statistics | SPECULATORS | COMMERCIALS | SMALL TRADERS |
| – Percent of Open Interest Longs: | 74.7 | 2.0 | 9.7 |
| – Percent of Open Interest Shorts: | 75.5 | 4.1 | 6.8 |
| – Net Position: | -93 | -260 | 353 |
| – Gross Longs: | 9,284 | 250 | 1,202 |
| – Gross Shorts: | 9,377 | 510 | 849 |
| – Long to Short Ratio: | 1.0 to 1 | 0.5 to 1 | 1.4 to 1 |
| NET POSITION TREND: | |||
| – Strength Index Score (3 Year Range Pct): | 78.6 | 42.6 | 21.0 |
| – Strength Index Reading (3 Year Range): | Bullish | Bearish | Bearish |
| NET POSITION MOVEMENT INDEX: | |||
| – 6-Week Change in Strength Index: | -9.3 | 11.7 | 7.1 |
Article By InvestMacro – Receive our weekly COT Reports by Email
*COT Report: The COT data, released weekly to the public each Friday, is updated through the most recent Tuesday (data is 3 days old) and shows a quick view of how large speculators or non-commercials (for-profit traders) were positioned in the futures markets.
The CFTC categorizes trader positions according to commercial hedgers (traders who use futures contracts for hedging as part of the business), non-commercials (large traders who speculate to realize trading profits) and nonreportable traders (usually small traders/speculators) as well as their open interest (contracts open in the market at time of reporting).See CFTC criteria here.
By Jeffrey Young, Georgia Institute of Technology You’ve probably heard artificial intelligence models described as…
Source: Barry Dawes (7/23/26) Barry Dawes of Martin Place Securities shares his analysis of the…
By JustMarkets The US stock indices ended Thursday’s session with a notable decline amid a…
By Analytical Department RoboForex USD/JPY soared to 163.81 on Friday, marking a new 40-year high.…
By JustMarkets The US equities ended Wednesday’s session lower amid investor caution ahead of the…
By Analytical Department RoboForex EUR/USD rose to 1.1429 on Thursday, with the US dollar continuing…
This website uses cookies.