
By InvestMacro | COT | Data Tables | COT Leaders | Downloads | COT Newsletter
Here are the latest charts and statistics for the Commitment of Traders (COT) data published by the Commodities Futures Trading Commission (CFTC).
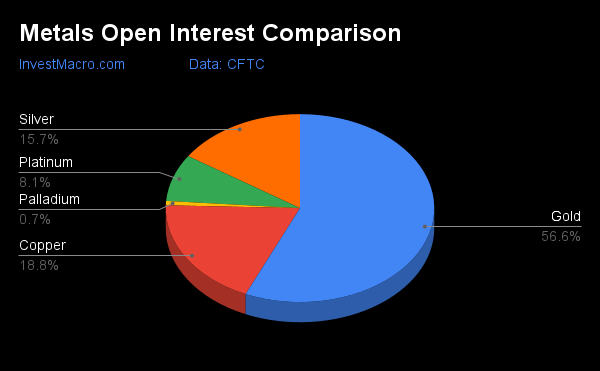
The latest COT data is updated through Tuesday July 19th and shows a quick view of how large traders (for-profit speculators and commercial entities) were positioned in the futures markets.
Weekly Speculator Changes
COT precious metals speculator bets were lower this week as two out of the five metals markets we cover had higher positioning this week while the other three markets had lower speculator contracts.
Leading the gains for the precious metals markets was Copper (2,459 contracts) with Platinum (1,629 contracts) also showing a positive week.
Free Reports:
 Sign Up for Our Stock Market Newsletter – Get updated on News, Charts & Rankings of Public Companies when you join our Stocks Newsletter
 Get our Weekly Commitment of Traders Reports - See where the biggest traders (Hedge Funds and Commercial Hedgers) are positioned in the futures markets on a weekly basis.
The metals markets leading the declines in speculator bets this week were Gold (-23,166 contracts) and XX with Silver (-1,844 contracts) and Palladium (-949 contracts) also registering lower bets on the week.

Highlighting the metals data this week is the continued decline in speculator bets for Gold. Positioning has been down for four straight weeks and in five out of the past six weeks, taking a total of -80,313 contracts off the bullish position in the past six weeks. This weakness has dropped the Gold bullish position to below the +100,000 net contract level for the first time since May 28th of 2019, a span of 164 weeks. Gold prices, meanwhile, have shaved off about $300 from the highs in March but have recently found support near the $1,700 price-point.
Silver positions have been falling in a similar fashion and have now declined for the past four straight weeks. Positioning has also been lower in eleven out of the past thirteen weeks with a total drop of -45,069 contracts over that time-frame. The current speculator standing is at just +1,360 contracts and is dangerously close to going negative for the first time since June of 2019. Silver spot prices in the past two weeks have dipped to the lowest levels since July of 2020 right near the major price level of $18.
| Jul-19-2022 | OI | OI-Index | Spec-Net | Spec-Index | Com-Net | COM-Index | Smalls-Net | Smalls-Index |
|---|---|---|---|---|---|---|---|---|
| WTI Crude | 1,577,616 | 0 | 271,091 | 1 | -293,689 | 100 | 22,598 | 47 |
| Gold | 524,786 | 21 | 94,955 | 0 | -112,262 | 100 | 17,307 | 0 |
| Silver | 145,247 | 12 | 1,360 | 0 | -8,213 | 100 | 6,853 | 2 |
| Copper | 174,592 | 8 | -23,836 | 25 | 23,745 | 76 | 91 | 26 |
| Palladium | 6,915 | 3 | -3,751 | 2 | 4,302 | 99 | -551 | 12 |
| Platinum | 75,069 | 47 | -4,282 | 2 | -273 | 98 | 4,555 | 26 |
| Natural Gas | 953,325 | 0 | -120,323 | 42 | 86,699 | 58 | 33,624 | 60 |
| Brent | 177,889 | 22 | -41,302 | 42 | 40,843 | 61 | 459 | 15 |
| Heating Oil | 267,576 | 22 | 9,243 | 56 | -23,800 | 46 | 14,557 | 49 |
| Soybeans | 602,987 | 0 | 102,593 | 45 | -74,427 | 61 | -28,166 | 23 |
| Corn | 1,308,458 | 0 | 209,940 | 57 | -165,611 | 48 | -44,329 | 18 |
| Coffee | 196,041 | 3 | 27,979 | 63 | -28,026 | 44 | 47 | 0 |
| Sugar | 703,614 | 0 | 127,162 | 63 | -141,842 | 41 | 14,680 | 26 |
| Wheat | 292,700 | 2 | 6,522 | 28 | 3,173 | 64 | -9,695 | 60 |
Strength Scores
Strength scores (a measure of the 3-Year range of Speculator positions, from 0 to 100 where above 80 is extreme bullish and below 20 is extreme bearish) show that Copper (25.2 percent) leads the metals again this week but is itself in a very weak position (just above the 20 percent extreme bearish level). All the other metals markets are in extreme bearish levels as has been the case for multiple weeks. Platinum (2.2 percent), Palladium (1.7 percent), Gold (0.0 percent) and Silver (0.0 percent) round out the rest of the strength scores.

Strength Statistics:
Gold (0.0 percent) vs Gold previous week (9.0 percent)
Silver (0.0 percent) vs Silver previous week (2.4 percent)
Copper (25.2 percent) vs Copper previous week (23.4 percent)
Platinum (2.2 percent) vs Platinum previous week (0.0 percent)
Palladium (1.7 percent) vs Palladium previous week (7.1 percent)
Strength Trends
Strength Score Trends (or move index, calculates the 6-week changes in strength scores) illustrate how weak the metals category has been as all the metals have negative strength trends over the past six weeks. Gold (-31.0 percent) leads the downside trend scores currently while the next markets with lower trend scores were Silver (-21.0 percent) followed by Copper (-14.5 percent), Platinum (-13.9 percent) and Palladium (-1.6 percent).

Move Statistics:
Gold (-31.0 percent) vs Gold previous week (-21.1 percent)
Silver (-21.0 percent) vs Silver previous week (-14.1 percent)
Copper (-14.5 percent) vs Copper previous week (-6.0 percent)
Platinum (-13.9 percent) vs Platinum previous week (-11.3 percent)
Palladium (-1.6 percent) vs Palladium previous week (1.9 percent)
Individual Markets:
Gold Comex Futures:
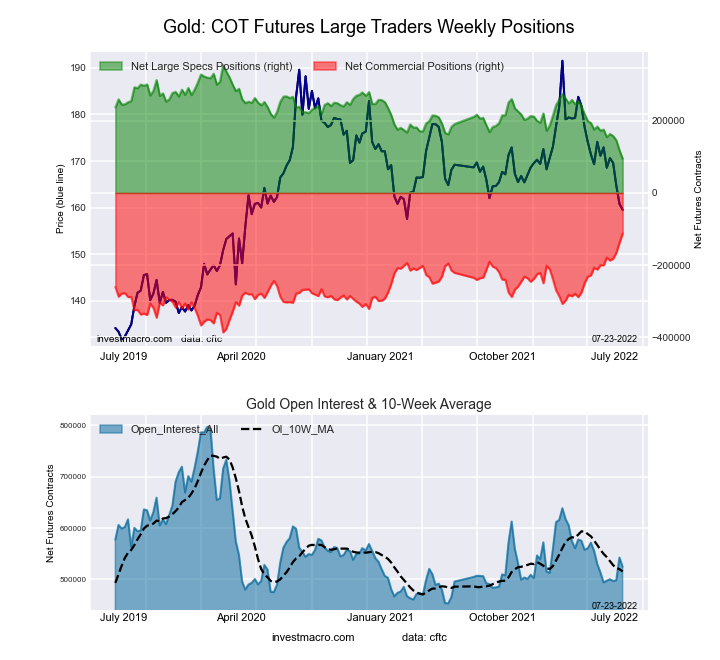 The Gold Comex Futures large speculator standing this week equaled a net position of 94,955 contracts in the data reported through Tuesday. This was a weekly lowering of -23,166 contracts from the previous week which had a total of 118,121 net contracts.
This week’s current strength score (the trader positioning range over the past three years, measured from 0 to 100) shows the speculators are currently Bearish-Extreme with a score of 0.0 percent. The commercials are Bullish-Extreme with a score of 100.0 percent and the small traders (not shown in chart) are Bearish-Extreme with a score of 0.0 percent.
| Gold Futures Statistics | SPECULATORS | COMMERCIALS | SMALL TRADERS |
| – Percent of Open Interest Longs: | 45.9 | 29.0 | 8.2 |
| – Percent of Open Interest Shorts: | 27.8 | 50.4 | 5.0 |
| – Net Position: | 94,955 | -112,262 | 17,307 |
| – Gross Longs: | 241,004 | 152,103 | 43,294 |
| – Gross Shorts: | 146,049 | 264,365 | 25,987 |
| – Long to Short Ratio: | 1.7 to 1 | 0.6 to 1 | 1.7 to 1 |
| NET POSITION TREND: | |||
| – Strength Index Score (3 Year Range Pct): | 0.0 | 100.0 | 0.0 |
| – Strength Index Reading (3 Year Range): | Bearish-Extreme | Bullish-Extreme | Bearish-Extreme |
| NET POSITION MOVEMENT INDEX: | |||
| – 6-Week Change in Strength Index: | -31.0 | 32.1 | -24.0 |
Silver Comex Futures:
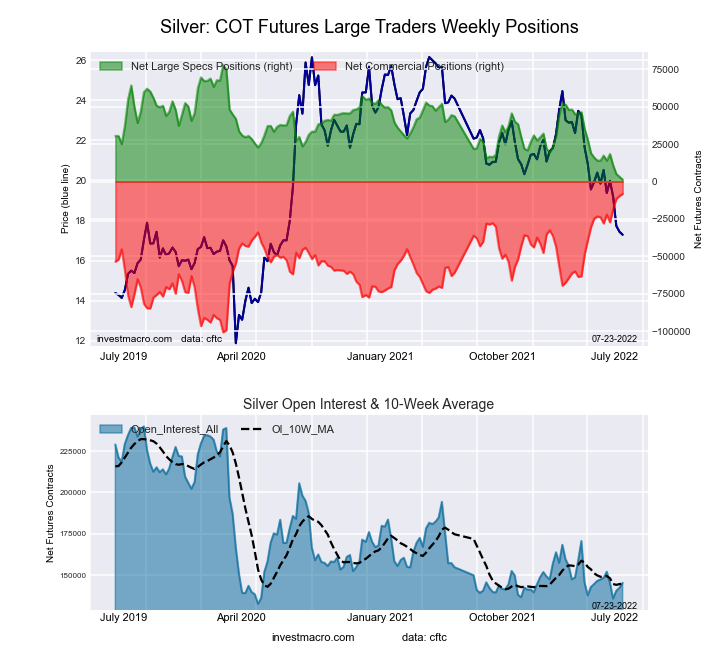 The Silver Comex Futures large speculator standing this week equaled a net position of 1,360 contracts in the data reported through Tuesday. This was a weekly reduction of -1,844 contracts from the previous week which had a total of 3,204 net contracts.
This week’s current strength score (the trader positioning range over the past three years, measured from 0 to 100) shows the speculators are currently Bearish-Extreme with a score of 0.0 percent. The commercials are Bullish-Extreme with a score of 100.0 percent and the small traders (not shown in chart) are Bearish-Extreme with a score of 2.2 percent.
| Silver Futures Statistics | SPECULATORS | COMMERCIALS | SMALL TRADERS |
| – Percent of Open Interest Longs: | 38.7 | 40.2 | 14.8 |
| – Percent of Open Interest Shorts: | 37.7 | 45.9 | 10.1 |
| – Net Position: | 1,360 | -8,213 | 6,853 |
| – Gross Longs: | 56,187 | 58,430 | 21,517 |
| – Gross Shorts: | 54,827 | 66,643 | 14,664 |
| – Long to Short Ratio: | 1.0 to 1 | 0.9 to 1 | 1.5 to 1 |
| NET POSITION TREND: | |||
| – Strength Index Score (3 Year Range Pct): | 0.0 | 100.0 | 2.2 |
| – Strength Index Reading (3 Year Range): | Bearish-Extreme | Bullish-Extreme | Bearish-Extreme |
| NET POSITION MOVEMENT INDEX: | |||
| – 6-Week Change in Strength Index: | -21.0 | 21.4 | -18.1 |
Copper Grade #1 Futures:
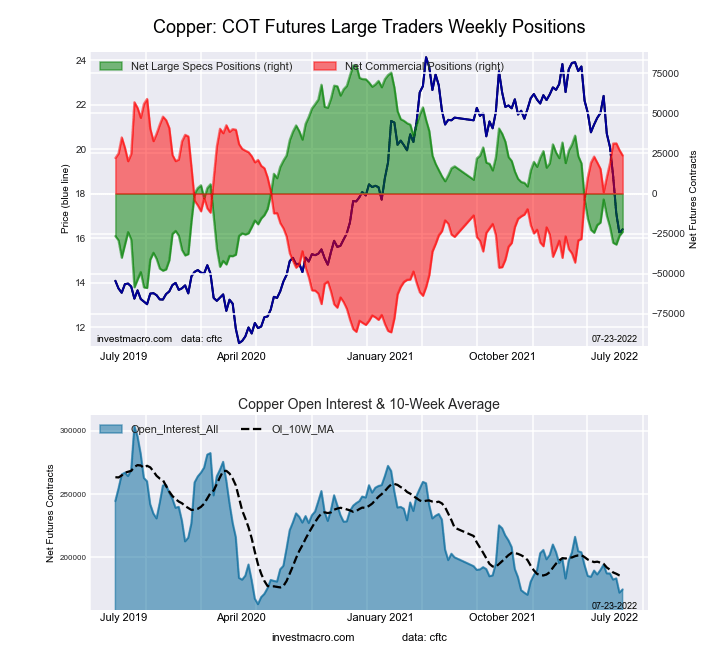 The Copper Grade #1 Futures large speculator standing this week equaled a net position of -23,836 contracts in the data reported through Tuesday. This was a weekly lift of 2,459 contracts from the previous week which had a total of -26,295 net contracts.
This week’s current strength score (the trader positioning range over the past three years, measured from 0 to 100) shows the speculators are currently Bearish with a score of 25.2 percent. The commercials are Bullish with a score of 75.8 percent and the small traders (not shown in chart) are Bearish with a score of 25.8 percent.
| Copper Futures Statistics | SPECULATORS | COMMERCIALS | SMALL TRADERS |
| – Percent of Open Interest Longs: | 29.8 | 49.5 | 8.4 |
| – Percent of Open Interest Shorts: | 43.4 | 35.9 | 8.3 |
| – Net Position: | -23,836 | 23,745 | 91 |
| – Gross Longs: | 52,000 | 86,505 | 14,616 |
| – Gross Shorts: | 75,836 | 62,760 | 14,525 |
| – Long to Short Ratio: | 0.7 to 1 | 1.4 to 1 | 1.0 to 1 |
| NET POSITION TREND: | |||
| – Strength Index Score (3 Year Range Pct): | 25.2 | 75.8 | 25.8 |
| – Strength Index Reading (3 Year Range): | Bearish | Bullish | Bearish |
| NET POSITION MOVEMENT INDEX: | |||
| – 6-Week Change in Strength Index: | -14.5 | 15.7 | -15.9 |
Platinum Futures:
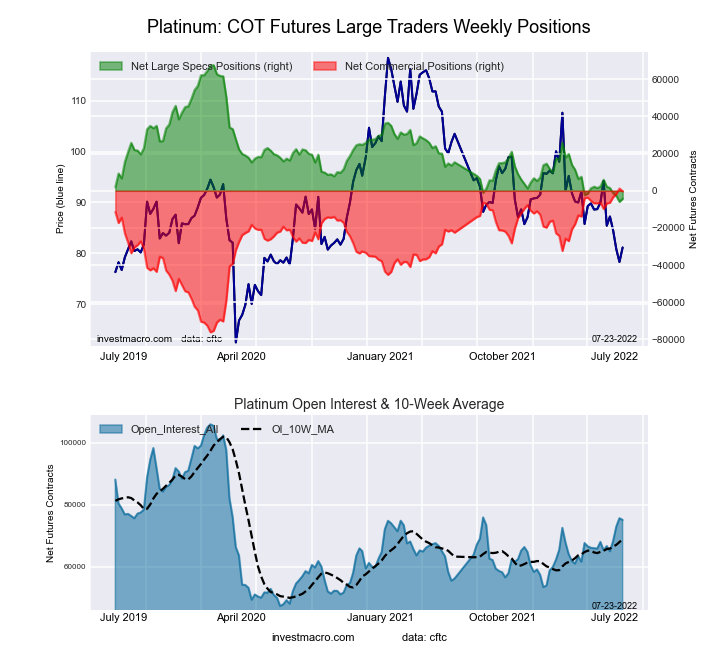
The Platinum Futures large speculator standing this week equaled a net position of -4,282 contracts in the data reported through Tuesday. This was a weekly advance of 1,629 contracts from the previous week which had a total of -5,911 net contracts.
This week’s current strength score (the trader positioning range over the past three years, measured from 0 to 100) shows the speculators are currently Bearish-Extreme with a score of 2.2 percent. The commercials are Bullish-Extreme with a score of 98.1 percent and the small traders (not shown in chart) are Bearish with a score of 25.5 percent.
| Platinum Futures Statistics | SPECULATORS | COMMERCIALS | SMALL TRADERS |
| – Percent of Open Interest Longs: | 43.9 | 37.7 | 11.0 |
| – Percent of Open Interest Shorts: | 49.6 | 38.1 | 4.9 |
| – Net Position: | -4,282 | -273 | 4,555 |
| – Gross Longs: | 32,960 | 28,338 | 8,241 |
| – Gross Shorts: | 37,242 | 28,611 | 3,686 |
| – Long to Short Ratio: | 0.9 to 1 | 1.0 to 1 | 2.2 to 1 |
| NET POSITION TREND: | |||
| – Strength Index Score (3 Year Range Pct): | 2.2 | 98.1 | 25.5 |
| – Strength Index Reading (3 Year Range): | Bearish-Extreme | Bullish-Extreme | Bearish |
| NET POSITION MOVEMENT INDEX: | |||
| – 6-Week Change in Strength Index: | -13.9 | 12.2 | 10.4 |
Palladium Futures:
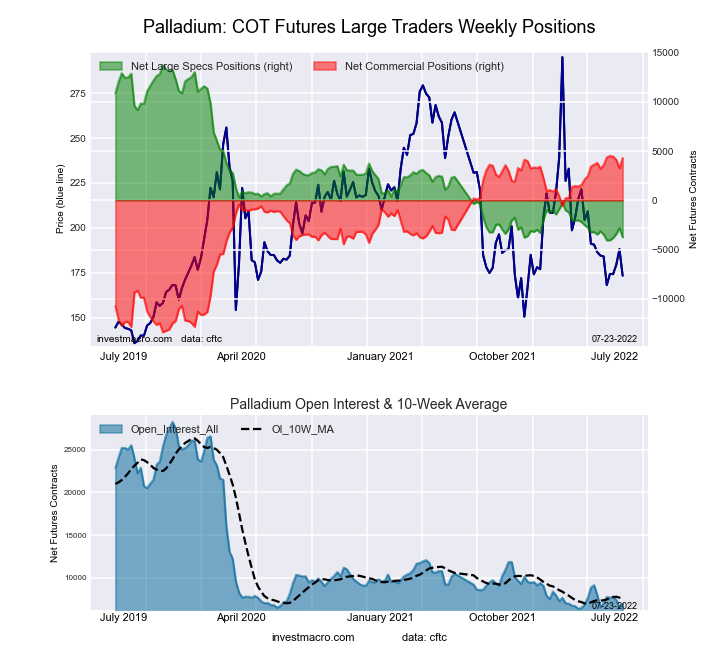 The Palladium Futures large speculator standing this week equaled a net position of -3,751 contracts in the data reported through Tuesday. This was a weekly lowering of -949 contracts from the previous week which had a total of -2,802 net contracts.
This week’s current strength score (the trader positioning range over the past three years, measured from 0 to 100) shows the speculators are currently Bearish-Extreme with a score of 1.7 percent. The commercials are Bullish-Extreme with a score of 98.8 percent and the small traders (not shown in chart) are Bearish-Extreme with a score of 12.0 percent.
| Palladium Futures Statistics | SPECULATORS | COMMERCIALS | SMALL TRADERS |
| – Percent of Open Interest Longs: | 9.8 | 76.5 | 12.7 |
| – Percent of Open Interest Shorts: | 64.0 | 14.3 | 20.6 |
| – Net Position: | -3,751 | 4,302 | -551 |
| – Gross Longs: | 676 | 5,288 | 875 |
| – Gross Shorts: | 4,427 | 986 | 1,426 |
| – Long to Short Ratio: | 0.2 to 1 | 5.4 to 1 | 0.6 to 1 |
| NET POSITION TREND: | |||
| – Strength Index Score (3 Year Range Pct): | 1.7 | 98.8 | 12.0 |
| – Strength Index Reading (3 Year Range): | Bearish-Extreme | Bullish-Extreme | Bearish-Extreme |
| NET POSITION MOVEMENT INDEX: | |||
| – 6-Week Change in Strength Index: | -1.6 | 4.0 | -24.9 |
Article By InvestMacro – Receive our weekly COT Reports by Email
*COT Report: The COT data, released weekly to the public each Friday, is updated through the most recent Tuesday (data is 3 days old) and shows a quick view of how large speculators or non-commercials (for-profit traders) were positioned in the futures markets.
The CFTC categorizes trader positions according to commercial hedgers (traders who use futures contracts for hedging as part of the business), non-commercials (large traders who speculate to realize trading profits) and nonreportable traders (usually small traders/speculators) as well as their open interest (contracts open in the market at time of reporting).See CFTC criteria here.

- COT Metals Charts: Weekly Speculator Bets led by Copper & Steel Jul 18, 2026
- COT Bonds Charts: Weekly Speculator Bets led by 2-Year, SOFR 3M & 5-Year Bonds Jul 18, 2026
- COT Energy Charts: Weekly Speculator Bets led by Brent Oil & Heating Oil Jul 18, 2026
- COT Soft Commodities Charts: Weekly Speculator Bets led by Wheat, Corn & Soybean Meal Jul 18, 2026
- The Bank of Canada kept its interest rate unchanged. Platinum prices reached a three‑week high Jul 16, 2026
- Stock indices rose after the release of US inflation data. China’s GDP slowed sharply Jul 15, 2026
- GBP/USD Awaits Political News: What Will Happen Next Jul 15, 2026
- USD/JPY Holds at Highs: Pressure Lingers on Yen Jul 14, 2026
- Oil prices jumped 4% amid a new wave of escalation between the US and Iran Jul 13, 2026
- EUR/USD: US Inflation Will Determine Everything Jul 13, 2026