
By InvestMacro | COT | Data Tables | COT Leaders | Downloads | COT Newsletter
Here are the latest charts and statistics for the Commitment of Traders (COT) data published by the Commodities Futures Trading Commission (CFTC).
The latest COT data is updated through Tuesday June 28th and shows a quick view of how large traders (for-profit speculators and commercial entities) were positioned in the futures markets.
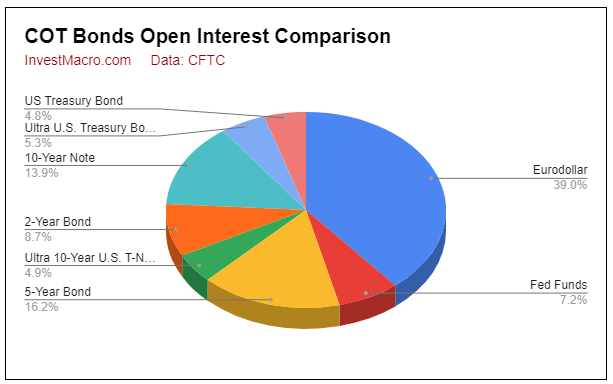
The COT bond market speculator bets were overall mixed this week as four out of the eight bond markets we cover had higher positioning this week while the other four markets had lower contracts.
Leading the gains for the bonds markets was the 10-Year Bond (46,504 contracts) and the Ultra 10-Year Bond (37,626 contracts) with the 2-Year Bond (17,165 contracts) and the Ultra US Bond (7,073 contracts) also having a positive week.
Free Reports:
 Sign Up for Our Stock Market Newsletter – Get updated on News, Charts & Rankings of Public Companies when you join our Stocks Newsletter
 Get our Weekly Commitment of Traders Reports - See where the biggest traders (Hedge Funds and Commercial Hedgers) are positioned in the futures markets on a weekly basis.
Leading the declines in speculator bets this week were the Eurodollar (-158,541 contracts) and the 5-Year Bond (-98,573 contracts) with the Long US Bond (-18,931 contracts) and Fed Funds (-3,839 contracts) also registering lower bets on the week.
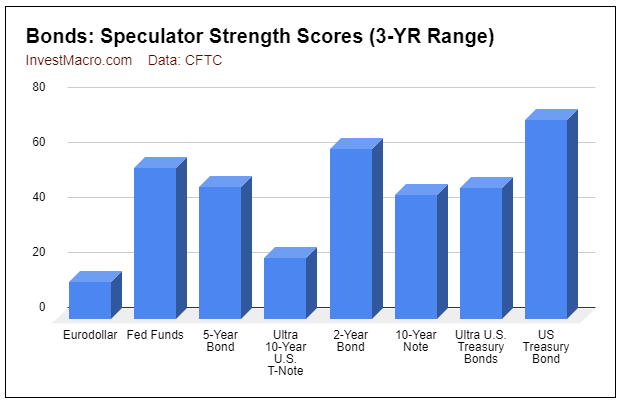
Strength scores (measuring the 3-Year range of Speculator positions, from 0 to 100 where above 80 is extreme bullish and below 20 is extreme bearish) show that the US Treasury Bond (72.1 percent) remains at the highest level of the bonds markets currently while the 2-Year Bond is creeping up at 62 percent. On the lower end of their ranges, the 3-Month Eurodollars (13 percent) is in a bearish-extreme level while the Ultra 10-Year Bonds (22 percent) comes in next lowest but has been risen from around 7 percent last week.
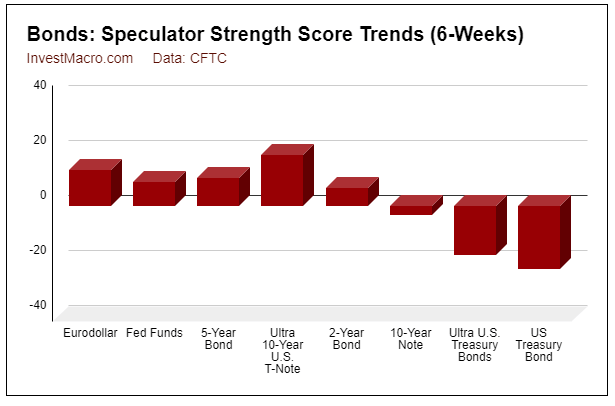 Strength score trends (or move index, that calculate 6-week changes in strength scores) shows that the Ultra 10-Year Bonds (19 percent) are leading the six-week trends with Eurodollars (13 percent) and the 5-Year Bond (10 percent) coming in next. The US Treasury Bond leads the trends on the downside with a -22.9 percent trend change followed by the Ultra US Treasury Bond (-17.7 percent) and the 10-Year Bonds (-3 percent) following next.
| Jun-28-2022 | OI | OI-Index | Spec-Net | Spec-Index | Com-Net | COM-Index | Smalls-Net | Smalls-Index |
|---|---|---|---|---|---|---|---|---|
| Eurodollar | 9,521,916 | 13 | -2,156,430 | 13 | 2,512,425 | 86 | -355,995 | 26 |
| FedFunds | 1,748,855 | 57 | 120,582 | 55 | -111,402 | 46 | -9,180 | 36 |
| 2-Year | 2,118,890 | 15 | -102,118 | 62 | 194,562 | 62 | -92,444 | 10 |
| Long T-Bond | 1,182,840 | 46 | -38,253 | 72 | 37,023 | 24 | 1,230 | 54 |
| 10-Year | 3,403,344 | 23 | -181,680 | 45 | 329,404 | 61 | -147,724 | 45 |
| 5-Year | 3,962,280 | 49 | -202,664 | 48 | 373,431 | 59 | -170,767 | 34 |
3-Month Eurodollars Futures:
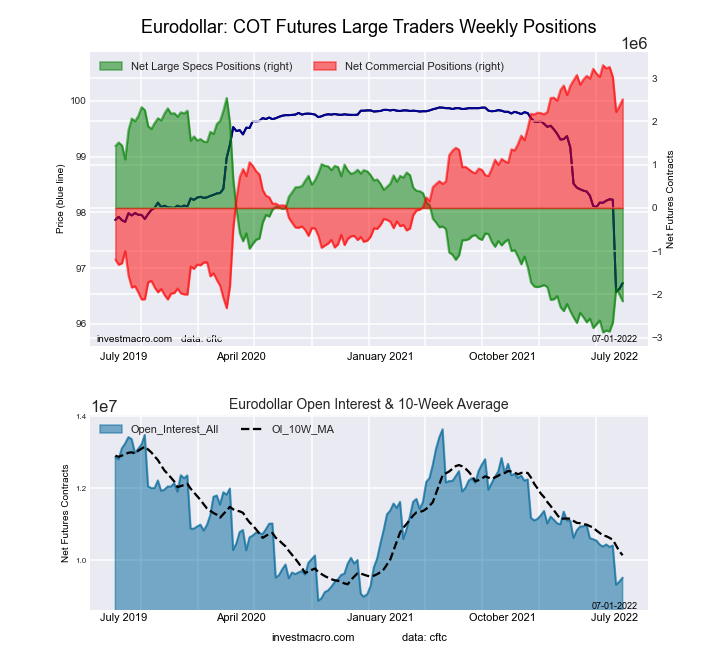 The 3-Month Eurodollars large speculator standing this week reached a net position of -2,156,430 contracts in the data reported through Tuesday. This was a weekly lowering of -158,541 contracts from the previous week which had a total of -1,997,889 net contracts.
This week’s current strength score (the trader positioning range over the past three years, measured from 0 to 100) shows the speculators are currently Bearish-Extreme with a score of 13.3 percent. The commercials are Bullish-Extreme with a score of 86.0 percent and the small traders (not shown in chart) are Bearish with a score of 26.1 percent.
| 3-Month Eurodollars Statistics | SPECULATORS | COMMERCIALS | SMALL TRADERS |
| – Percent of Open Interest Longs: | 6.2 | 70.5 | 4.1 |
| – Percent of Open Interest Shorts: | 28.8 | 44.1 | 7.9 |
| – Net Position: | -2,156,430 | 2,512,425 | -355,995 |
| – Gross Longs: | 588,828 | 6,711,010 | 391,853 |
| – Gross Shorts: | 2,745,258 | 4,198,585 | 747,848 |
| – Long to Short Ratio: | 0.2 to 1 | 1.6 to 1 | 0.5 to 1 |
| NET POSITION TREND: | |||
| – Strength Index Score (3 Year Range Pct): | 13.3 | 86.0 | 26.1 |
| – Strength Index Reading (3 Year Range): | Bearish-Extreme | Bullish-Extreme | Bearish |
| NET POSITION MOVEMENT INDEX: | |||
| – 6-Week Change in Strength Index: | 13.3 | -14.0 | 15.5 |
30-Day Federal Funds Futures:
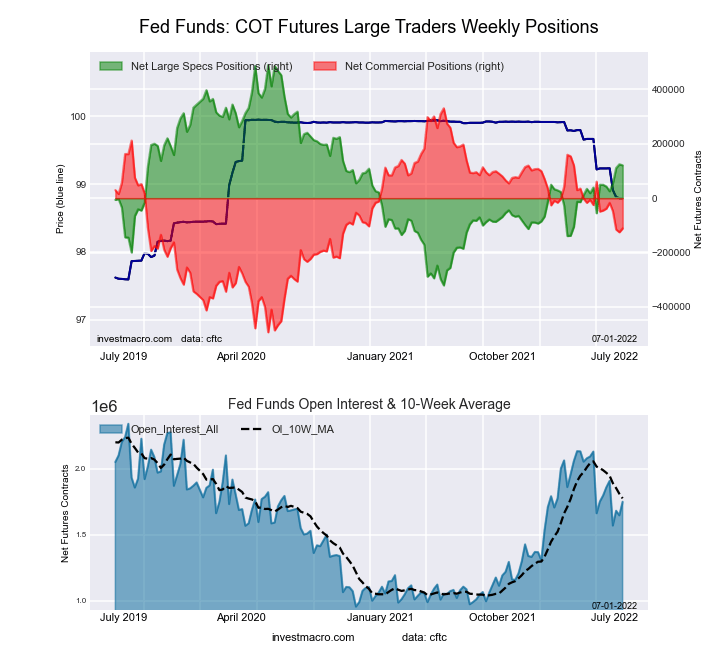
The 30-Day Federal Funds large speculator standing this week reached a net position of 120,582 contracts in the data reported through Tuesday. This was a weekly decline of -3,839 contracts from the previous week which had a total of 124,421 net contracts.
This week’s current strength score (the trader positioning range over the past three years, measured from 0 to 100) shows the speculators are currently Bullish with a score of 54.5 percent. The commercials are Bearish with a score of 46.4 percent and the small traders (not shown in chart) are Bearish with a score of 36.4 percent.
| 30-Day Federal Funds Statistics | SPECULATORS | COMMERCIALS | SMALL TRADERS |
| – Percent of Open Interest Longs: | 13.9 | 70.8 | 2.2 |
| – Percent of Open Interest Shorts: | 7.0 | 77.2 | 2.8 |
| – Net Position: | 120,582 | -111,402 | -9,180 |
| – Gross Longs: | 243,400 | 1,238,618 | 39,186 |
| – Gross Shorts: | 122,818 | 1,350,020 | 48,366 |
| – Long to Short Ratio: | 2.0 to 1 | 0.9 to 1 | 0.8 to 1 |
| NET POSITION TREND: | |||
| – Strength Index Score (3 Year Range Pct): | 54.5 | 46.4 | 36.4 |
| – Strength Index Reading (3 Year Range): | Bullish | Bearish | Bearish |
| NET POSITION MOVEMENT INDEX: | |||
| – 6-Week Change in Strength Index: | 8.8 | -8.0 | -14.4 |
2-Year Treasury Note Futures:
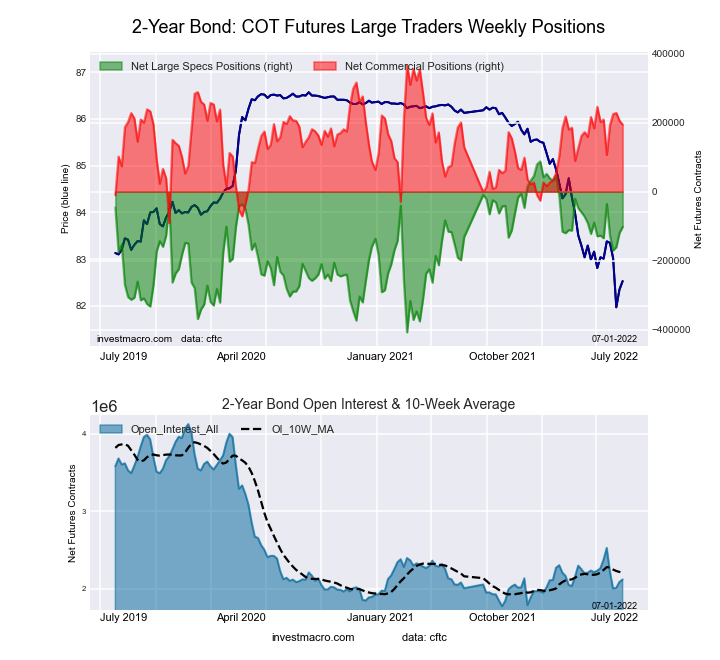 The 2-Year Treasury Note large speculator standing this week reached a net position of -102,118 contracts in the data reported through Tuesday. This was a weekly rise of 17,165 contracts from the previous week which had a total of -119,283 net contracts.
This week’s current strength score (the trader positioning range over the past three years, measured from 0 to 100) shows the speculators are currently Bullish with a score of 61.6 percent. The commercials are Bullish with a score of 62.4 percent and the small traders (not shown in chart) are Bearish-Extreme with a score of 10.1 percent.
| 2-Year Treasury Note Statistics | SPECULATORS | COMMERCIALS | SMALL TRADERS |
| – Percent of Open Interest Longs: | 13.0 | 77.8 | 6.3 |
| – Percent of Open Interest Shorts: | 17.8 | 68.6 | 10.7 |
| – Net Position: | -102,118 | 194,562 | -92,444 |
| – Gross Longs: | 275,428 | 1,647,599 | 134,145 |
| – Gross Shorts: | 377,546 | 1,453,037 | 226,589 |
| – Long to Short Ratio: | 0.7 to 1 | 1.1 to 1 | 0.6 to 1 |
| NET POSITION TREND: | |||
| – Strength Index Score (3 Year Range Pct): | 61.6 | 62.4 | 10.1 |
| – Strength Index Reading (3 Year Range): | Bullish | Bullish | Bearish-Extreme |
| NET POSITION MOVEMENT INDEX: | |||
| – 6-Week Change in Strength Index: | 6.6 | -3.2 | -7.5 |
5-Year Treasury Note Futures:
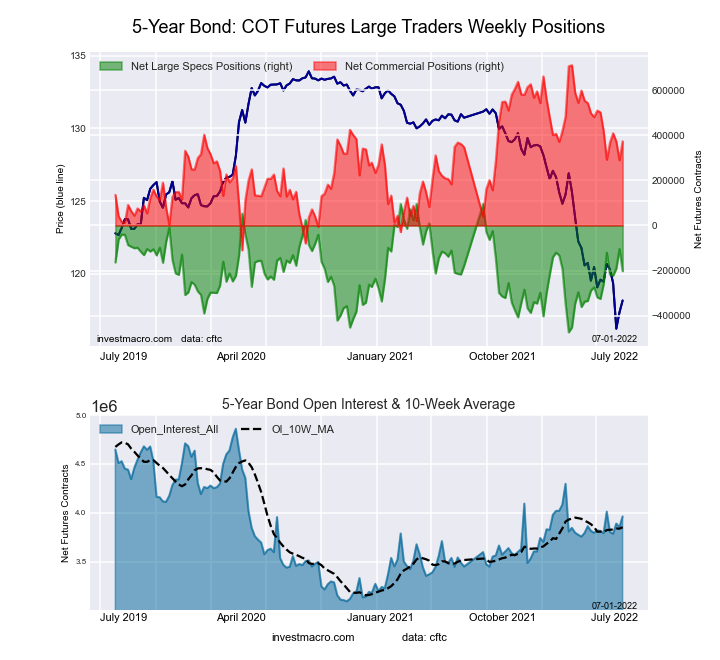 The 5-Year Treasury Note large speculator standing this week reached a net position of -202,664 contracts in the data reported through Tuesday. This was a weekly fall of -98,573 contracts from the previous week which had a total of -104,091 net contracts.
This week’s current strength score (the trader positioning range over the past three years, measured from 0 to 100) shows the speculators are currently Bearish with a score of 47.7 percent. The commercials are Bullish with a score of 58.9 percent and the small traders (not shown in chart) are Bearish with a score of 34.1 percent.
| 5-Year Treasury Note Statistics | SPECULATORS | COMMERCIALS | SMALL TRADERS |
| – Percent of Open Interest Longs: | 8.3 | 83.1 | 7.4 |
| – Percent of Open Interest Shorts: | 13.5 | 73.7 | 11.7 |
| – Net Position: | -202,664 | 373,431 | -170,767 |
| – Gross Longs: | 330,759 | 3,293,540 | 291,486 |
| – Gross Shorts: | 533,423 | 2,920,109 | 462,253 |
| – Long to Short Ratio: | 0.6 to 1 | 1.1 to 1 | 0.6 to 1 |
| NET POSITION TREND: | |||
| – Strength Index Score (3 Year Range Pct): | 47.7 | 58.9 | 34.1 |
| – Strength Index Reading (3 Year Range): | Bearish | Bullish | Bearish |
| NET POSITION MOVEMENT INDEX: | |||
| – 6-Week Change in Strength Index: | 10.1 | -5.4 | -3.7 |
10-Year Treasury Note Futures:
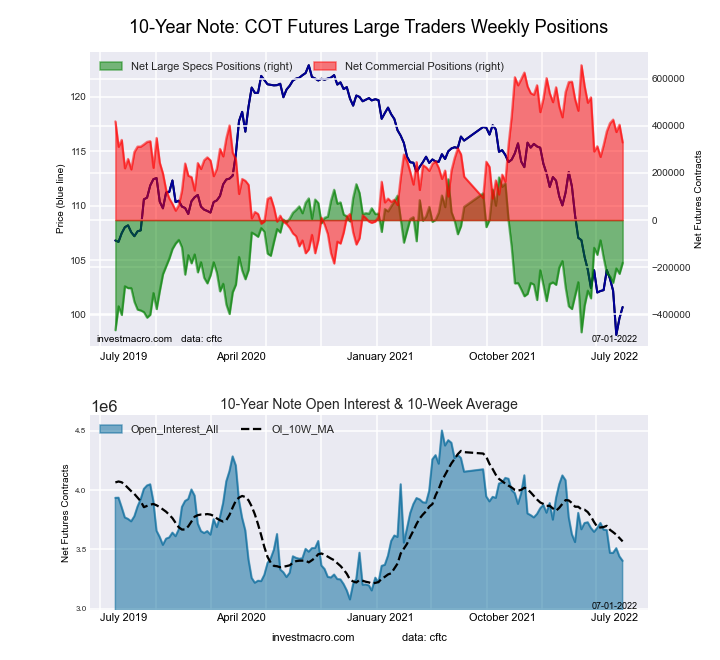 The 10-Year Treasury Note large speculator standing this week reached a net position of -181,680 contracts in the data reported through Tuesday. This was a weekly lift of 46,504 contracts from the previous week which had a total of -228,184 net contracts.
This week’s current strength score (the trader positioning range over the past three years, measured from 0 to 100) shows the speculators are currently Bearish with a score of 44.8 percent. The commercials are Bullish with a score of 61.0 percent and the small traders (not shown in chart) are Bearish with a score of 44.7 percent.
| 10-Year Treasury Note Statistics | SPECULATORS | COMMERCIALS | SMALL TRADERS |
| – Percent of Open Interest Longs: | 8.1 | 80.0 | 9.2 |
| – Percent of Open Interest Shorts: | 13.4 | 70.4 | 13.5 |
| – Net Position: | -181,680 | 329,404 | -147,724 |
| – Gross Longs: | 274,858 | 2,724,138 | 312,558 |
| – Gross Shorts: | 456,538 | 2,394,734 | 460,282 |
| – Long to Short Ratio: | 0.6 to 1 | 1.1 to 1 | 0.7 to 1 |
| NET POSITION TREND: | |||
| – Strength Index Score (3 Year Range Pct): | 44.8 | 61.0 | 44.7 |
| – Strength Index Reading (3 Year Range): | Bearish | Bullish | Bearish |
| NET POSITION MOVEMENT INDEX: | |||
| – 6-Week Change in Strength Index: | -3.3 | 1.3 | 2.5 |
Ultra 10-Year Notes Futures:
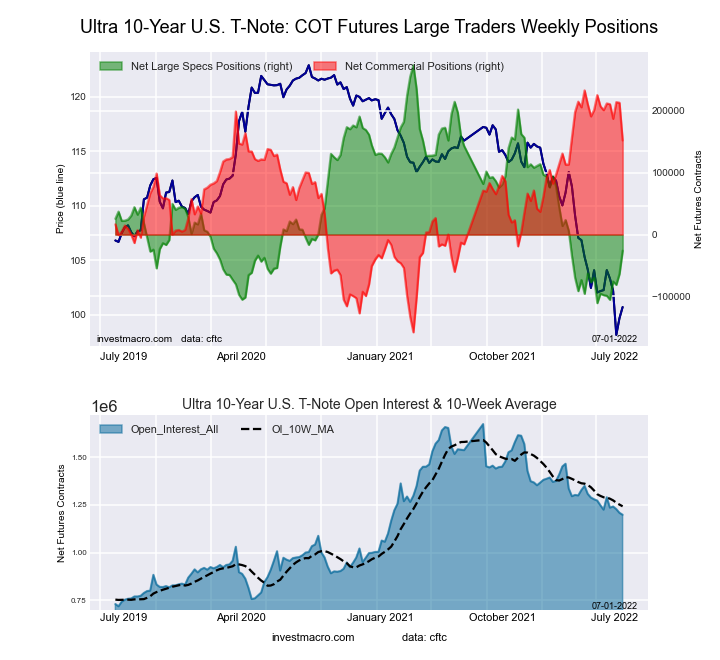 The Ultra 10-Year Notes large speculator standing this week reached a net position of -26,080 contracts in the data reported through Tuesday. This was a weekly gain of 37,626 contracts from the previous week which had a total of -63,706 net contracts.
This week’s current strength score (the trader positioning range over the past three years, measured from 0 to 100) shows the speculators are currently Bearish with a score of 22.0 percent. The commercials are Bullish with a score of 79.3 percent and the small traders (not shown in chart) are Bearish with a score of 40.9 percent.
| Ultra 10-Year Notes Statistics | SPECULATORS | COMMERCIALS | SMALL TRADERS |
| – Percent of Open Interest Longs: | 5.2 | 83.3 | 11.0 |
| – Percent of Open Interest Shorts: | 7.3 | 70.6 | 21.5 |
| – Net Position: | -26,080 | 152,060 | -125,980 |
| – Gross Longs: | 61,919 | 998,346 | 131,429 |
| – Gross Shorts: | 87,999 | 846,286 | 257,409 |
| – Long to Short Ratio: | 0.7 to 1 | 1.2 to 1 | 0.5 to 1 |
| NET POSITION TREND: | |||
| – Strength Index Score (3 Year Range Pct): | 22.0 | 79.3 | 40.9 |
| – Strength Index Reading (3 Year Range): | Bearish | Bullish | Bearish |
| NET POSITION MOVEMENT INDEX: | |||
| – 6-Week Change in Strength Index: | 18.7 | -12.5 | -14.1 |
US Treasury Bonds Futures:
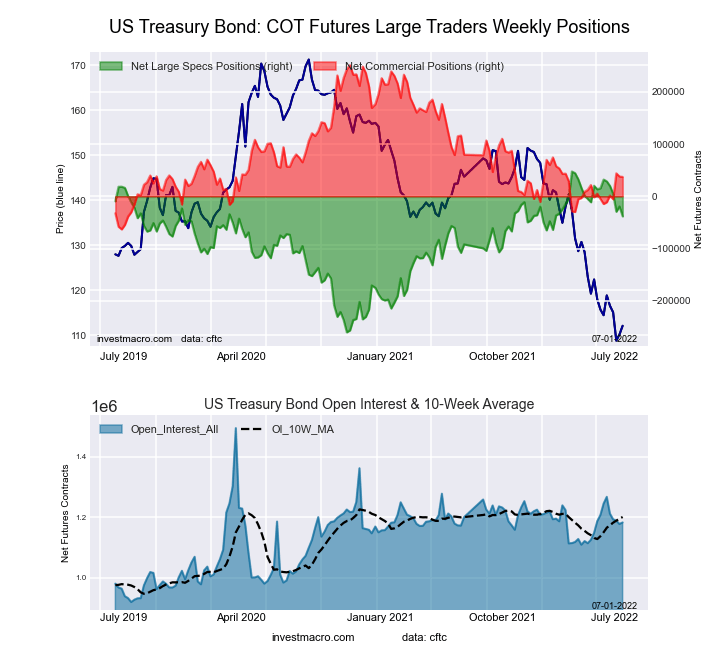 The US Treasury Bonds large speculator standing this week reached a net position of -38,253 contracts in the data reported through Tuesday. This was a weekly decline of -18,931 contracts from the previous week which had a total of -19,322 net contracts.
This week’s current strength score (the trader positioning range over the past three years, measured from 0 to 100) shows the speculators are currently Bullish with a score of 72.1 percent. The commercials are Bearish with a score of 24.0 percent and the small traders (not shown in chart) are Bullish with a score of 53.6 percent.
| US Treasury Bonds Statistics | SPECULATORS | COMMERCIALS | SMALL TRADERS |
| – Percent of Open Interest Longs: | 6.8 | 78.8 | 13.9 |
| – Percent of Open Interest Shorts: | 10.0 | 75.6 | 13.8 |
| – Net Position: | -38,253 | 37,023 | 1,230 |
| – Gross Longs: | 80,552 | 931,822 | 164,556 |
| – Gross Shorts: | 118,805 | 894,799 | 163,326 |
| – Long to Short Ratio: | 0.7 to 1 | 1.0 to 1 | 1.0 to 1 |
| NET POSITION TREND: | |||
| – Strength Index Score (3 Year Range Pct): | 72.1 | 24.0 | 53.6 |
| – Strength Index Reading (3 Year Range): | Bullish | Bearish | Bullish |
| NET POSITION MOVEMENT INDEX: | |||
| – 6-Week Change in Strength Index: | -22.9 | 18.4 | 14.8 |
Ultra US Treasury Bonds Futures:
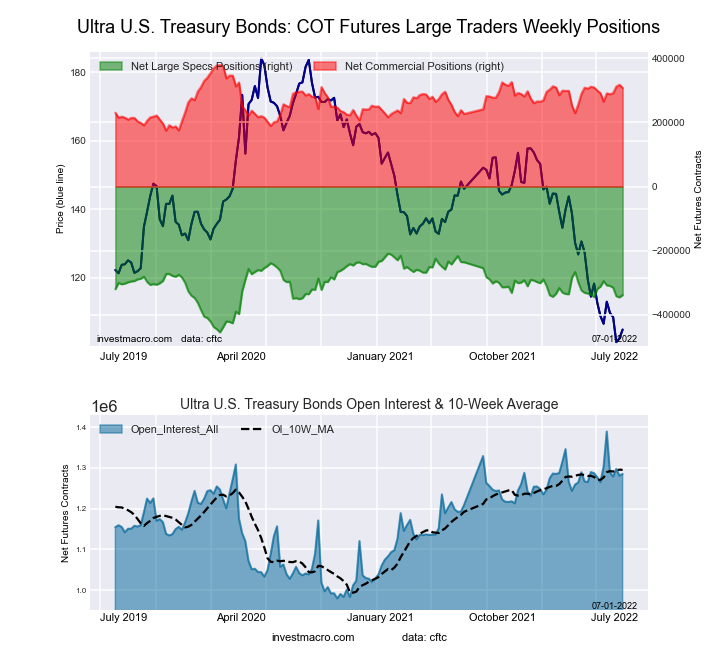 The Ultra US Treasury Bonds large speculator standing this week reached a net position of -337,983 contracts in the data reported through Tuesday. This was a weekly rise of 7,073 contracts from the previous week which had a total of -345,056 net contracts.
This week’s current strength score (the trader positioning range over the past three years, measured from 0 to 100) shows the speculators are currently Bearish with a score of 47.3 percent. The commercials are Bullish with a score of 65.4 percent and the small traders (not shown in chart) are Bullish with a score of 50.3 percent.
| Ultra US Treasury Bonds Statistics | SPECULATORS | COMMERCIALS | SMALL TRADERS |
| – Percent of Open Interest Longs: | 3.3 | 85.0 | 11.5 |
| – Percent of Open Interest Shorts: | 29.6 | 61.1 | 9.1 |
| – Net Position: | -337,983 | 307,346 | 30,637 |
| – Gross Longs: | 42,179 | 1,092,416 | 148,217 |
| – Gross Shorts: | 380,162 | 785,070 | 117,580 |
| – Long to Short Ratio: | 0.1 to 1 | 1.4 to 1 | 1.3 to 1 |
| NET POSITION TREND: | |||
| – Strength Index Score (3 Year Range Pct): | 47.3 | 65.4 | 50.3 |
| – Strength Index Reading (3 Year Range): | Bearish | Bullish | Bullish |
| NET POSITION MOVEMENT INDEX: | |||
| – 6-Week Change in Strength Index: | -17.7 | 21.2 | 0.2 |
Article By InvestMacro – Receive our weekly COT Reports by Email
*COT Report: The COT data, released weekly to the public each Friday, is updated through the most recent Tuesday (data is 3 days old) and shows a quick view of how large speculators or non-commercials (for-profit traders) were positioned in the futures markets.
The CFTC categorizes trader positions according to commercial hedgers (traders who use futures contracts for hedging as part of the business), non-commercials (large traders who speculate to realize trading profits) and nonreportable traders (usually small traders/speculators) as well as their open interest (contracts open in the market at time of reporting).See CFTC criteria here.

- Geopolitical and macroeconomic conditions continue to pressure market sentiment Jul 20, 2026
- USD/JPY Poised to Continue Gains as Expensive Oil and Lack of Support Weigh on Yen Jul 20, 2026
- COT Metals Charts: Weekly Speculator Bets led by Copper & Steel Jul 18, 2026
- COT Bonds Charts: Weekly Speculator Bets led by 2-Year, SOFR 3M & 5-Year Bonds Jul 18, 2026
- COT Energy Charts: Weekly Speculator Bets led by Brent Oil & Heating Oil Jul 18, 2026
- COT Soft Commodities Charts: Weekly Speculator Bets led by Wheat, Corn & Soybean Meal Jul 18, 2026
- The Bank of Canada kept its interest rate unchanged. Platinum prices reached a three‑week high Jul 16, 2026
- Stock indices rose after the release of US inflation data. China’s GDP slowed sharply Jul 15, 2026
- GBP/USD Awaits Political News: What Will Happen Next Jul 15, 2026
- USD/JPY Holds at Highs: Pressure Lingers on Yen Jul 14, 2026