
By InvestMacro | COT | Data Tables | COT Leaders | Downloads | COT Newsletter
Here are the latest charts and statistics for the Commitment of Traders (COT) data published by the Commodities Futures Trading Commission (CFTC).
The latest COT data is updated through Tuesday June 28th and shows a quick view of how large traders (for-profit speculators and commercial entities) were positioned in the futures markets.
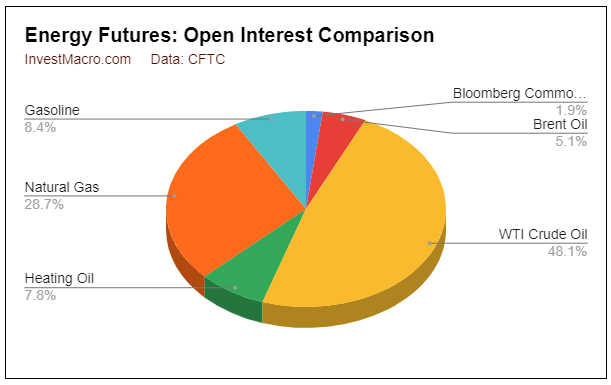
Energy market speculator bets were mostly higher this week as four out of the six energy markets we cover had higher positioning this week while two markets had lower contracts.
Leading the gains for energy markets was WTI Crude Oil (10,190 contracts) and Natural Gas (1,450 contracts) with the Bloomberg Commodity Index (703 contracts) and Gasoline (692 contracts) also showing a positive week. Meanwhile, leading the declines in speculator bets this week was Brent Crude Oil (-4,667 contracts) with Heating Oil (-2,056 contracts) also registering lower bets on the week.
Free Reports:
 Get our Weekly Commitment of Traders Reports - See where the biggest traders (Hedge Funds and Commercial Hedgers) are positioned in the futures markets on a weekly basis.
 Sign Up for Our Stock Market Newsletter – Get updated on News, Charts & Rankings of Public Companies when you join our Stocks Newsletter
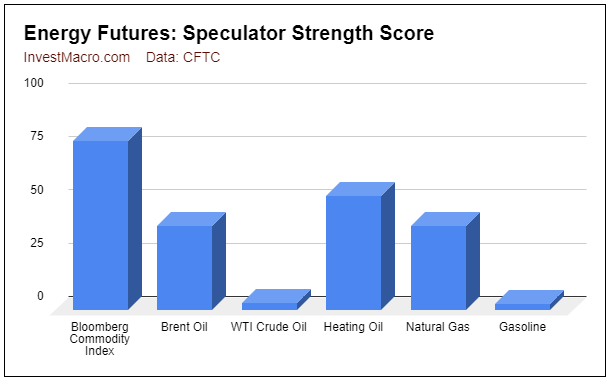
Strength scores (measuring the 3-Year range of Speculator positions, from 0 to 100 where above 80 percent is extreme bullish and below 20 percent is extreme bearish) show that the Bloomberg Commodity Index (79 percent) and Heating Oil (54 percent) are above the midpoint for the past 3 years while all the other markets are below the 50 percent level. Gasoline and WTI Crude are in extreme bearish positions as each come in at 3 percent currently.
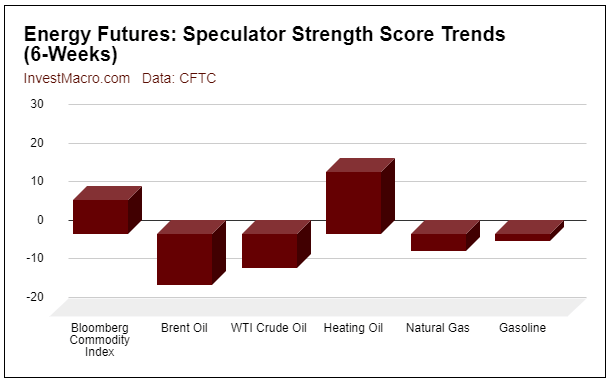
Strength score trends (or move index, that calculate 6-week changes in strength scores) shows that Heating Oil (16 percent) and the Bloomberg Commodity Index (9 percent) are also the only markets that have rising trend scores currently. Brent Crude Oil (-13 percent) and WTI Crude (-9 percent) are leading the downside trends.
| Jun-28-2022 | OI | OI-Index | Spec-Net | Spec-Index | Com-Net | COM-Index | Smalls-Net | Smalls-Index |
|---|---|---|---|---|---|---|---|---|
| WTI Crude | 1,651,566 | 0 | 299,692 | 3 | -327,938 | 99 | 28,246 | 55 |
| Gold | 497,005 | 13 | 157,693 | 2 | -182,007 | 98 | 24,314 | 16 |
| Silver | 135,775 | 3 | 10,891 | 0 | -18,485 | 100 | 7,594 | 0 |
| Copper | 182,352 | 14 | -30,696 | 20 | 31,197 | 81 | -501 | 22 |
| Palladium | 7,765 | 6 | -3,825 | 1 | 4,441 | 100 | -616 | 8 |
| Platinum | 68,232 | 36 | -1,306 | 2 | -3,381 | 100 | 4,687 | 27 |
| Natural Gas | 987,740 | 0 | -129,419 | 40 | 90,840 | 60 | 38,579 | 71 |
| Brent | 173,920 | 19 | -42,677 | 40 | 41,434 | 62 | 1,243 | 26 |
| Heating Oil | 269,168 | 23 | 7,508 | 53 | -25,743 | 44 | 18,235 | 62 |
| Soybeans | 653,337 | 11 | 137,193 | 56 | -106,705 | 52 | -30,488 | 20 |
| Corn | 1,338,054 | 0 | 328,102 | 72 | -274,110 | 33 | -53,992 | 12 |
| Coffee | 194,896 | 2 | 45,200 | 78 | -47,147 | 26 | 1,947 | 9 |
| Sugar | 734,324 | 0 | 122,709 | 62 | -132,877 | 43 | 10,168 | 20 |
| Wheat | 291,041 | 0 | 7,679 | 29 | -1,871 | 57 | -5,808 | 80 |
WTI Crude Oil Futures:
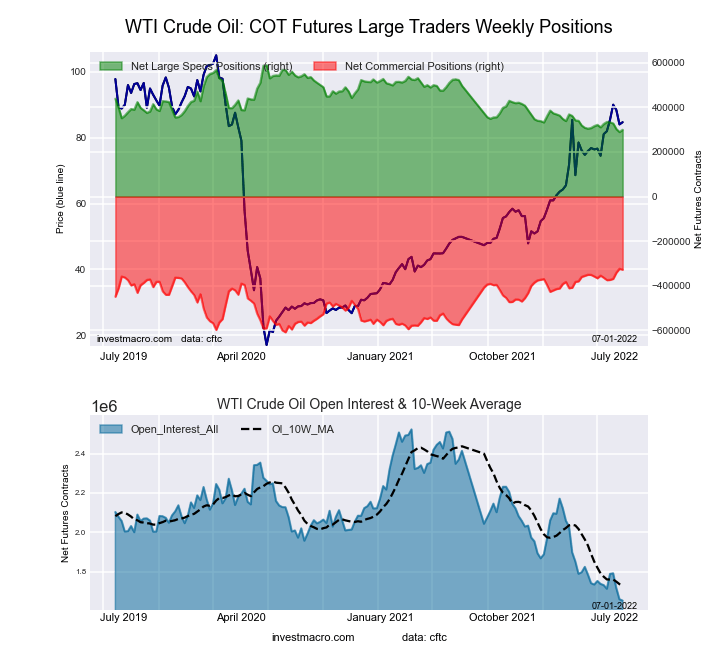 The WTI Crude Oil Futures large speculator standing this week resulted in a net position of 299,692 contracts in the data reported through Tuesday. This was a weekly advance of 10,190 contracts from the previous week which had a total of 289,502 net contracts.
This week’s current strength score (the trader positioning range over the past three years, measured from 0 to 100) shows the speculators are currently Bearish-Extreme with a score of 3.4 percent. The commercials are Bullish-Extreme with a score of 98.6 percent and the small traders (not shown in chart) are Bullish with a score of 54.8 percent.
| WTI Crude Oil Futures Statistics | SPECULATORS | COMMERCIALS | SMALL TRADERS |
| – Percent of Open Interest Longs: | 24.0 | 36.3 | 4.9 |
| – Percent of Open Interest Shorts: | 5.8 | 56.2 | 3.2 |
| – Net Position: | 299,692 | -327,938 | 28,246 |
| – Gross Longs: | 396,046 | 599,957 | 80,880 |
| – Gross Shorts: | 96,354 | 927,895 | 52,634 |
| – Long to Short Ratio: | 4.1 to 1 | 0.6 to 1 | 1.5 to 1 |
| NET POSITION TREND: | |||
| – Strength Index Score (3 Year Range Pct): | 3.4 | 98.6 | 54.8 |
| – Strength Index Reading (3 Year Range): | Bearish-Extreme | Bullish-Extreme | Bullish |
| NET POSITION MOVEMENT INDEX: | |||
| – 6-Week Change in Strength Index: | -8.7 | 12.6 | -14.1 |
Brent Crude Oil Futures:
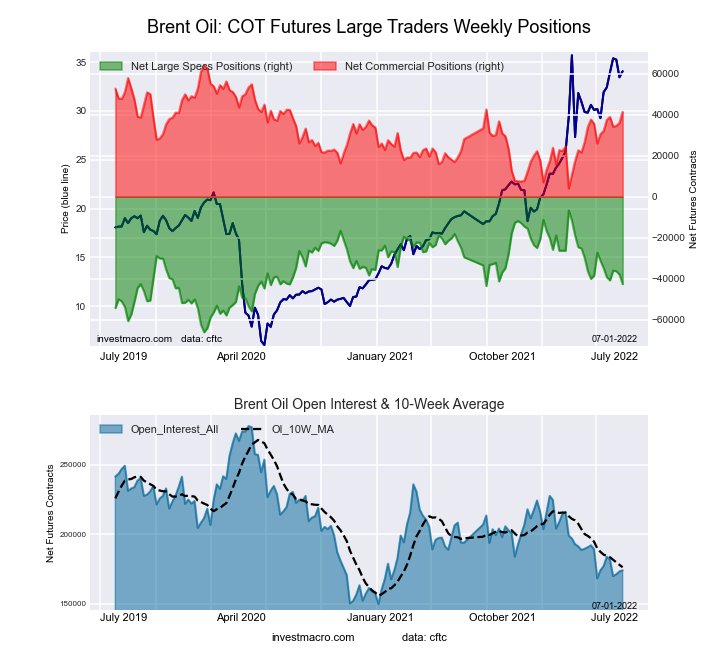 The Brent Crude Oil Futures large speculator standing this week resulted in a net position of -42,677 contracts in the data reported through Tuesday. This was a weekly decline of -4,667 contracts from the previous week which had a total of -38,010 net contracts.
This week’s current strength score (the trader positioning range over the past three years, measured from 0 to 100) shows the speculators are currently Bearish with a score of 39.6 percent. The commercials are Bullish with a score of 62.2 percent and the small traders (not shown in chart) are Bearish with a score of 26.0 percent.
| Brent Crude Oil Futures Statistics | SPECULATORS | COMMERCIALS | SMALL TRADERS |
| – Percent of Open Interest Longs: | 14.8 | 53.8 | 3.6 |
| – Percent of Open Interest Shorts: | 39.3 | 30.0 | 2.9 |
| – Net Position: | -42,677 | 41,434 | 1,243 |
| – Gross Longs: | 25,712 | 93,538 | 6,241 |
| – Gross Shorts: | 68,389 | 52,104 | 4,998 |
| – Long to Short Ratio: | 0.4 to 1 | 1.8 to 1 | 1.2 to 1 |
| NET POSITION TREND: | |||
| – Strength Index Score (3 Year Range Pct): | 39.6 | 62.2 | 26.0 |
| – Strength Index Reading (3 Year Range): | Bearish | Bullish | Bearish |
| NET POSITION MOVEMENT INDEX: | |||
| – 6-Week Change in Strength Index: | -13.1 | 15.5 | -20.3 |
Natural Gas Futures:
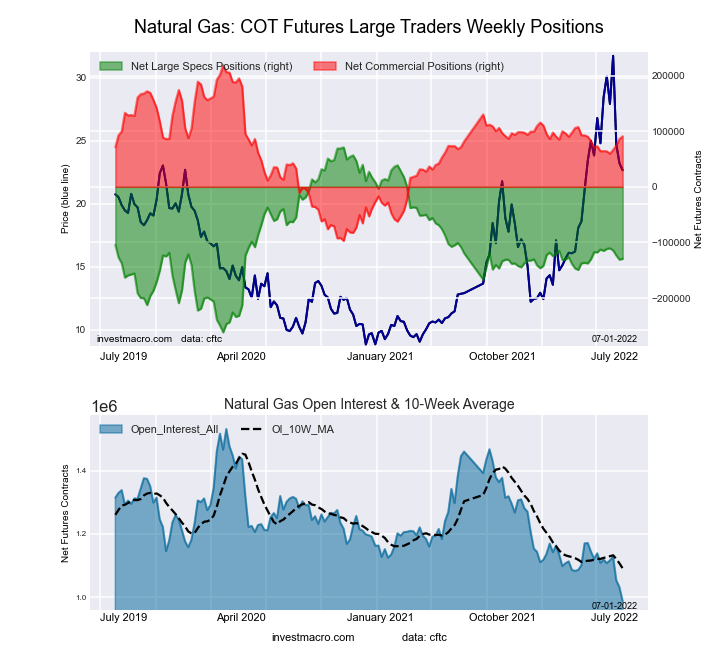 The Natural Gas Futures large speculator standing this week resulted in a net position of -129,419 contracts in the data reported through Tuesday. This was a weekly advance of 1,450 contracts from the previous week which had a total of -130,869 net contracts.
This week’s current strength score (the trader positioning range over the past three years, measured from 0 to 100) shows the speculators are currently Bearish with a score of 39.7 percent. The commercials are Bullish with a score of 59.5 percent and the small traders (not shown in chart) are Bullish with a score of 71.5 percent.
| Natural Gas Futures Statistics | SPECULATORS | COMMERCIALS | SMALL TRADERS |
| – Percent of Open Interest Longs: | 20.6 | 40.8 | 6.3 |
| – Percent of Open Interest Shorts: | 33.7 | 31.6 | 2.4 |
| – Net Position: | -129,419 | 90,840 | 38,579 |
| – Gross Longs: | 203,204 | 402,705 | 62,574 |
| – Gross Shorts: | 332,623 | 311,865 | 23,995 |
| – Long to Short Ratio: | 0.6 to 1 | 1.3 to 1 | 2.6 to 1 |
| NET POSITION TREND: | |||
| – Strength Index Score (3 Year Range Pct): | 39.7 | 59.5 | 71.5 |
| – Strength Index Reading (3 Year Range): | Bearish | Bullish | Bullish |
| NET POSITION MOVEMENT INDEX: | |||
| – 6-Week Change in Strength Index: | -4.3 | 8.4 | -28.5 |
Gasoline Blendstock Futures:
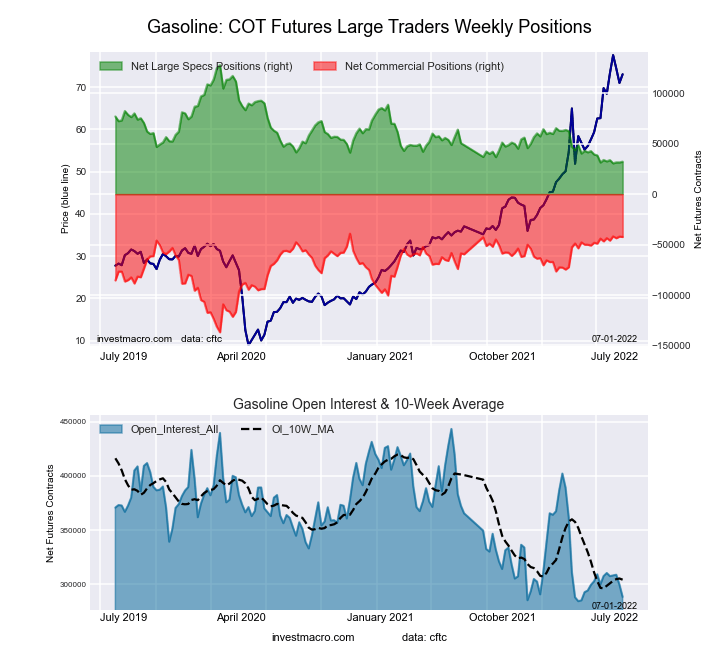 The Gasoline Blendstock Futures large speculator standing this week resulted in a net position of 32,099 contracts in the data reported through Tuesday. This was a weekly advance of 692 contracts from the previous week which had a total of 31,407 net contracts.
This week’s current strength score (the trader positioning range over the past three years, measured from 0 to 100) shows the speculators are currently Bearish-Extreme with a score of 2.8 percent. The commercials are Bullish-Extreme with a score of 94.6 percent and the small traders (not shown in chart) are Bullish-Extreme with a score of 81.7 percent.
| Nasdaq Mini Futures Statistics | SPECULATORS | COMMERCIALS | SMALL TRADERS |
| – Percent of Open Interest Longs: | 26.6 | 53.7 | 8.0 |
| – Percent of Open Interest Shorts: | 15.4 | 68.4 | 4.4 |
| – Net Position: | 32,099 | -42,454 | 10,355 |
| – Gross Longs: | 76,657 | 154,967 | 23,177 |
| – Gross Shorts: | 44,558 | 197,421 | 12,822 |
| – Long to Short Ratio: | 1.7 to 1 | 0.8 to 1 | 1.8 to 1 |
| NET POSITION TREND: | |||
| – Strength Index Score (3 Year Range Pct): | 2.8 | 94.6 | 81.7 |
| – Strength Index Reading (3 Year Range): | Bearish-Extreme | Bullish-Extreme | Bullish-Extreme |
| NET POSITION MOVEMENT INDEX: | |||
| – 6-Week Change in Strength Index: | -1.7 | 4.3 | -17.4 |
#2 Heating Oil NY-Harbor Futures:
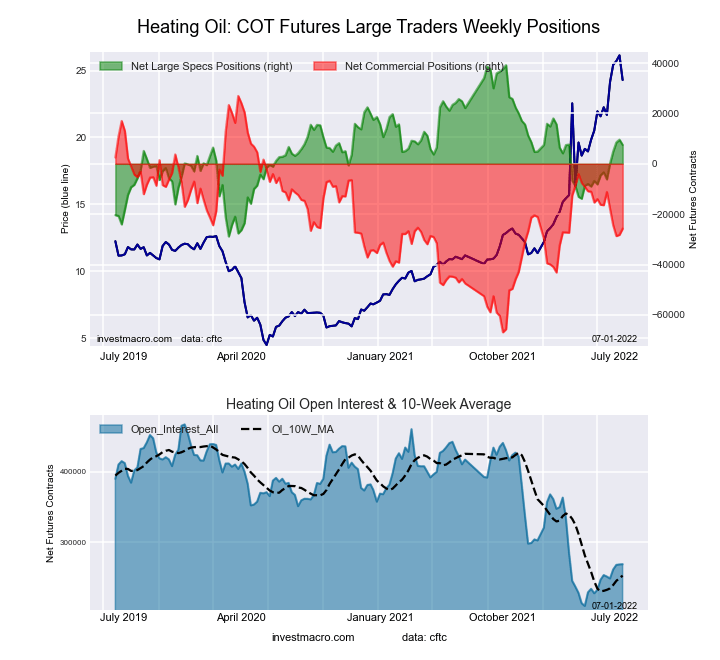 The #2 Heating Oil NY-Harbor Futures large speculator standing this week resulted in a net position of 7,508 contracts in the data reported through Tuesday. This was a weekly fall of -2,056 contracts from the previous week which had a total of 9,564 net contracts.
This week’s current strength score (the trader positioning range over the past three years, measured from 0 to 100) shows the speculators are currently Bullish with a score of 53.5 percent. The commercials are Bearish with a score of 43.9 percent and the small traders (not shown in chart) are Bullish with a score of 61.5 percent.
| Heating Oil Futures Statistics | SPECULATORS | COMMERCIALS | SMALL TRADERS |
| – Percent of Open Interest Longs: | 16.5 | 52.6 | 14.9 |
| – Percent of Open Interest Shorts: | 13.7 | 62.1 | 8.2 |
| – Net Position: | 7,508 | -25,743 | 18,235 |
| – Gross Longs: | 44,423 | 141,515 | 40,222 |
| – Gross Shorts: | 36,915 | 167,258 | 21,987 |
| – Long to Short Ratio: | 1.2 to 1 | 0.8 to 1 | 1.8 to 1 |
| NET POSITION TREND: | |||
| – Strength Index Score (3 Year Range Pct): | 53.5 | 43.9 | 61.5 |
| – Strength Index Reading (3 Year Range): | Bullish | Bearish | Bullish |
| NET POSITION MOVEMENT INDEX: | |||
| – 6-Week Change in Strength Index: | 16.0 | -9.9 | -5.4 |
Bloomberg Commodity Index Futures:
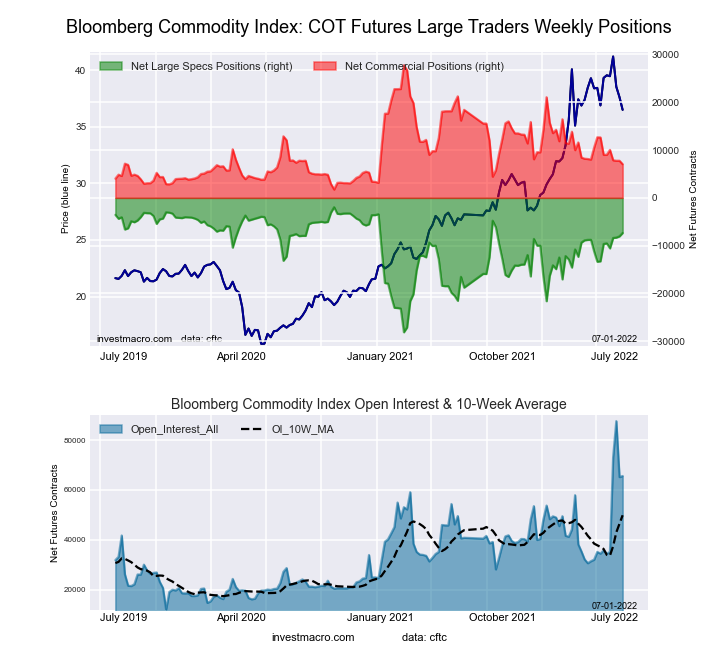 The Bloomberg Commodity Index Futures large speculator standing this week resulted in a net position of -7,349 contracts in the data reported through Tuesday. This was a weekly gain of 703 contracts from the previous week which had a total of -8,052 net contracts.
This week’s current strength score (the trader positioning range over the past three years, measured from 0 to 100) shows the speculators are currently Bullish with a score of 79.4 percent. The commercials are Bearish with a score of 20.4 percent and the small traders (not shown in chart) are Bearish with a score of 21.6 percent.
| Bloomberg Index Futures Statistics | SPECULATORS | COMMERCIALS | SMALL TRADERS |
| – Percent of Open Interest Longs: | 27.6 | 68.6 | 0.7 |
| – Percent of Open Interest Shorts: | 38.8 | 57.9 | 0.2 |
| – Net Position: | -7,349 | 7,041 | 308 |
| – Gross Longs: | 18,077 | 45,029 | 456 |
| – Gross Shorts: | 25,426 | 37,988 | 148 |
| – Long to Short Ratio: | 0.7 to 1 | 1.2 to 1 | 3.1 to 1 |
| NET POSITION TREND: | |||
| – Strength Index Score (3 Year Range Pct): | 79.4 | 20.4 | 21.6 |
| – Strength Index Reading (3 Year Range): | Bullish | Bearish | Bearish |
| NET POSITION MOVEMENT INDEX: | |||
| – 6-Week Change in Strength Index: | 8.8 | -7.5 | -13.1 |
Article By InvestMacro – Receive our weekly COT Reports by Email
*COT Report: The COT data, released weekly to the public each Friday, is updated through the most recent Tuesday (data is 3 days old) and shows a quick view of how large speculators or non-commercials (for-profit traders) were positioned in the futures markets.
The CFTC categorizes trader positions according to commercial hedgers (traders who use futures contracts for hedging as part of the business), non-commercials (large traders who speculate to realize trading profits) and nonreportable traders (usually small traders/speculators) as well as their open interest (contracts open in the market at time of reporting).See CFTC criteria here.

- Geopolitical and macroeconomic conditions continue to pressure market sentiment Jul 20, 2026
- USD/JPY Poised to Continue Gains as Expensive Oil and Lack of Support Weigh on Yen Jul 20, 2026
- COT Metals Charts: Weekly Speculator Bets led by Copper & Steel Jul 18, 2026
- COT Bonds Charts: Weekly Speculator Bets led by 2-Year, SOFR 3M & 5-Year Bonds Jul 18, 2026
- COT Energy Charts: Weekly Speculator Bets led by Brent Oil & Heating Oil Jul 18, 2026
- COT Soft Commodities Charts: Weekly Speculator Bets led by Wheat, Corn & Soybean Meal Jul 18, 2026
- The Bank of Canada kept its interest rate unchanged. Platinum prices reached a three‑week high Jul 16, 2026
- Stock indices rose after the release of US inflation data. China’s GDP slowed sharply Jul 15, 2026
- GBP/USD Awaits Political News: What Will Happen Next Jul 15, 2026
- USD/JPY Holds at Highs: Pressure Lingers on Yen Jul 14, 2026