By InvestMacro | COT | Data Tables | COT Leaders | Downloads | COT Newsletter
Here are the latest charts and statistics for the Commitment of Traders (COT) data published by the Commodities Futures Trading Commission (CFTC).
The latest COT data is updated through Tuesday June 21st and shows a quick view of how large traders (for-profit speculators and commercial entities) were positioned in the futures markets.
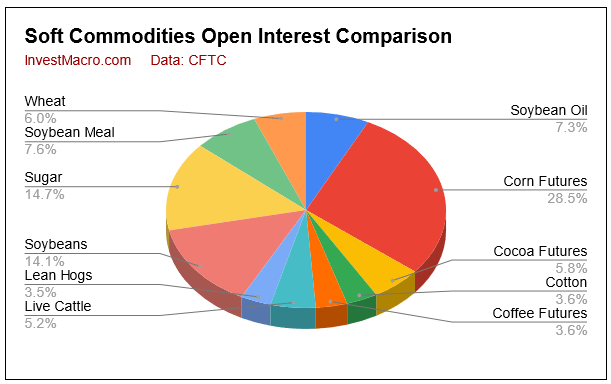
The soft commodities market speculator bets were mostly lower this week as six out of the eleven soft commodities markets we cover had higher positioning this week while five markets had lower contracts.
Leading the gains for soft commodities markets was Live Cattle (7,378 contracts) and Cocoa (6,674 contracts) with Soybean Meal (6,540 contracts), Lean Hogs (4,673 contracts) and Coffee (2,486 contracts) also showing positive speculator contract changes for the week. Meanwhile, leading the declines in speculator bets this week were Corn (-19,606 contracts) and Sugar (-7,372 contracts) with Soybean Oil (-5,868 contracts), Soybeans (-4,288 contracts), Wheat (-1,368 contracts) and Cotton (-210 contracts) also registering lower bets on the week.
Free Reports:
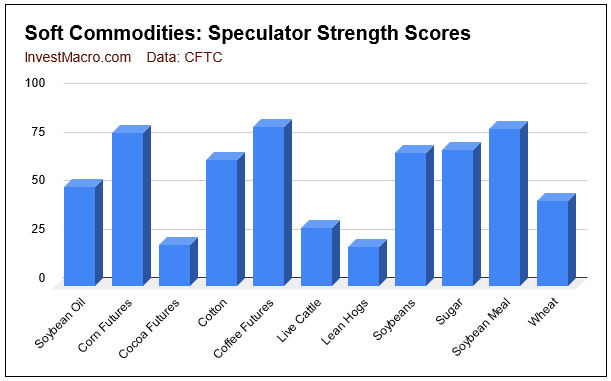
Strength scores (3-Year range of Speculator positions, from 0 to 100 where above 80 is extreme bullish and below 20 is extreme bearish) show that Coffee (81 percent) and Soybean Meal (80.6 percent) are in extreme bullish positions as of the latest data release. On the downside for strength scores is Lean Hogs (19.9 percent) which is just on the edge of being in a bearish extreme position and then Cocoa (20.9 percent) which is the next lowest.
Strength score trends (or move index, that calculate 6-week changes in strength scores) shows that Coffee (14.5 percent) and Soybean Meal (6.3 percent) have the highest trends as of the latest data. The overall effect of this chart shows how most of the soft commodities markets have really cooled off after really strong speculator sentiment since the start of the year.
| Jun-21-2022 | OI | OI-Index | Spec-Net | Spec-Index | Com-Net | COM-Index | Smalls-Net | Smalls-Index |
|---|---|---|---|---|---|---|---|---|
| WTI Crude | 1,658,636 | 0 | 289,502 | 0 | -323,915 | 100 | 34,413 | 64 |
| Gold | 500,276 | 14 | 163,287 | 4 | -186,929 | 96 | 23,642 | 14 |
| Silver | 145,356 | 12 | 18,419 | 7 | -27,250 | 93 | 8,831 | 4 |
| Copper | 187,170 | 17 | -20,938 | 27 | 18,928 | 72 | 2,010 | 37 |
| Palladium | 7,641 | 6 | -4,046 | 0 | 4,511 | 100 | -465 | 17 |
| Platinum | 64,946 | 30 | 1,491 | 6 | -6,397 | 96 | 4,906 | 30 |
| Natural Gas | 1,030,971 | 0 | -130,869 | 39 | 85,977 | 58 | 44,892 | 86 |
| Brent | 173,098 | 18 | -38,010 | 47 | 36,052 | 53 | 1,958 | 36 |
| Heating Oil | 268,818 | 23 | 9,564 | 56 | -28,204 | 41 | 18,640 | 63 |
| Soybeans | 745,494 | 32 | 178,379 | 68 | -152,968 | 38 | -25,411 | 28 |
| Corn | 1,512,152 | 23 | 380,169 | 79 | -326,474 | 25 | -53,695 | 12 |
| Coffee | 192,832 | 0 | 49,371 | 81 | -52,348 | 22 | 2,977 | 20 |
| Sugar | 779,773 | 0 | 163,111 | 70 | -181,280 | 34 | 18,169 | 30 |
| Wheat | 320,326 | 6 | 19,067 | 44 | -15,407 | 38 | -3,660 | 91 |
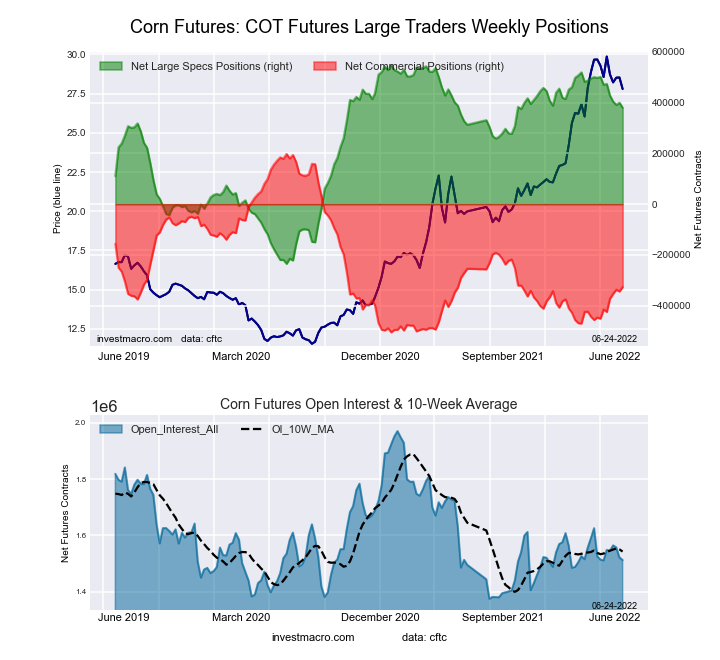
This week’s current strength score (the trader positioning range over the past three years, measured from 0 to 100) shows the speculators are currently Bullish with a score of 78.6 percent. The commercials are Bearish with a score of 25.4 percent and the small traders (not shown in chart) are Bearish-Extreme with a score of 12.1 percent.
| CORN Futures Statistics | SPECULATORS | COMMERCIALS | SMALL TRADERS |
| – Percent of Open Interest Longs: | 33.3 | 44.7 | 9.3 |
| – Percent of Open Interest Shorts: | 8.2 | 66.3 | 12.9 |
| – Net Position: | 380,169 | -326,474 | -53,695 |
| – Gross Longs: | 504,174 | 675,580 | 140,912 |
| – Gross Shorts: | 124,005 | 1,002,054 | 194,607 |
| – Long to Short Ratio: | 4.1 to 1 | 0.7 to 1 | 0.7 to 1 |
| NET POSITION TREND: | |||
| – Strength Index Score (3 Year Range Pct): | 78.6 | 25.4 | 12.1 |
| – Strength Index Reading (3 Year Range): | Bullish | Bearish | Bearish-Extreme |
| NET POSITION MOVEMENT INDEX: | |||
| – 6-Week Change in Strength Index: | -11.6 | 12.6 | 1.1 |
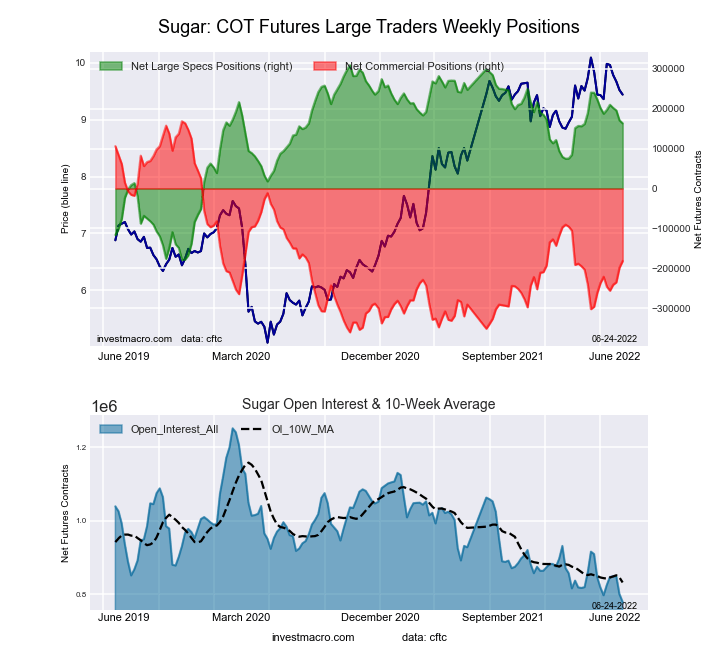
This week’s current strength score (the trader positioning range over the past three years, measured from 0 to 100) shows the speculators are currently Bullish with a score of 70.1 percent. The commercials are Bearish with a score of 33.8 percent and the small traders (not shown in chart) are Bearish with a score of 30.3 percent.
| SUGAR Futures Statistics | SPECULATORS | COMMERCIALS | SMALL TRADERS |
| – Percent of Open Interest Longs: | 29.1 | 49.2 | 9.0 |
| – Percent of Open Interest Shorts: | 8.2 | 72.4 | 6.7 |
| – Net Position: | 163,111 | -181,280 | 18,169 |
| – Gross Longs: | 227,142 | 383,646 | 70,240 |
| – Gross Shorts: | 64,031 | 564,926 | 52,071 |
| – Long to Short Ratio: | 3.5 to 1 | 0.7 to 1 | 1.3 to 1 |
| NET POSITION TREND: | |||
| – Strength Index Score (3 Year Range Pct): | 70.1 | 33.8 | 30.3 |
| – Strength Index Reading (3 Year Range): | Bullish | Bearish | Bearish |
| NET POSITION MOVEMENT INDEX: | |||
| – 6-Week Change in Strength Index: | -4.9 | 7.5 | -18.9 |
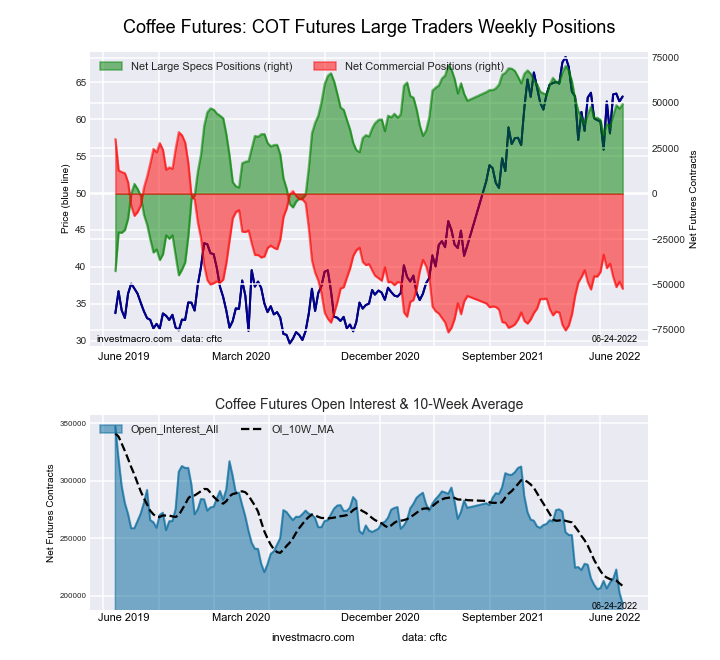
This week’s current strength score (the trader positioning range over the past three years, measured from 0 to 100) shows the speculators are currently Bullish-Extreme with a score of 81.5 percent. The commercials are Bearish with a score of 21.7 percent and the small traders (not shown in chart) are Bearish-Extreme with a score of 19.8 percent.
| COFFEE Futures Statistics | SPECULATORS | COMMERCIALS | SMALL TRADERS |
| – Percent of Open Interest Longs: | 30.3 | 47.6 | 4.4 |
| – Percent of Open Interest Shorts: | 4.7 | 74.7 | 2.8 |
| – Net Position: | 49,371 | -52,348 | 2,977 |
| – Gross Longs: | 58,442 | 91,789 | 8,425 |
| – Gross Shorts: | 9,071 | 144,137 | 5,448 |
| – Long to Short Ratio: | 6.4 to 1 | 0.6 to 1 | 1.5 to 1 |
| NET POSITION TREND: | |||
| – Strength Index Score (3 Year Range Pct): | 81.5 | 21.7 | 19.8 |
| – Strength Index Reading (3 Year Range): | Bullish-Extreme | Bearish | Bearish-Extreme |
| NET POSITION MOVEMENT INDEX: | |||
| – 6-Week Change in Strength Index: | 14.5 | -17.0 | 19.8 |
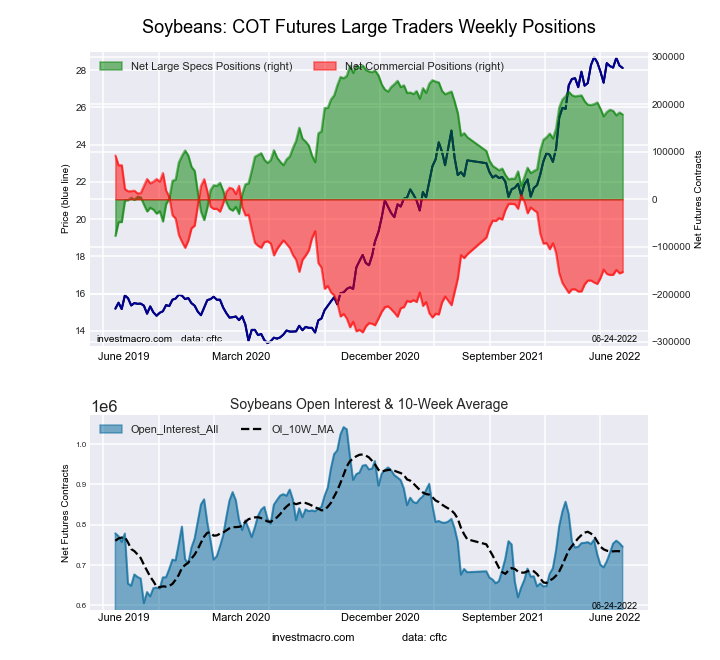
This week’s current strength score (the trader positioning range over the past three years, measured from 0 to 100) shows the speculators are currently Bullish with a score of 68.5 percent. The commercials are Bearish with a score of 37.9 percent and the small traders (not shown in chart) are Bearish with a score of 28.1 percent.
| SOYBEANS Futures Statistics | SPECULATORS | COMMERCIALS | SMALL TRADERS |
| – Percent of Open Interest Longs: | 30.3 | 50.5 | 6.6 |
| – Percent of Open Interest Shorts: | 6.4 | 71.0 | 10.0 |
| – Net Position: | 178,379 | -152,968 | -25,411 |
| – Gross Longs: | 226,191 | 376,155 | 49,215 |
| – Gross Shorts: | 47,812 | 529,123 | 74,626 |
| – Long to Short Ratio: | 4.7 to 1 | 0.7 to 1 | 0.7 to 1 |
| NET POSITION TREND: | |||
| – Strength Index Score (3 Year Range Pct): | 68.5 | 37.9 | 28.1 |
| – Strength Index Reading (3 Year Range): | Bullish | Bearish | Bearish |
| NET POSITION MOVEMENT INDEX: | |||
| – 6-Week Change in Strength Index: | 1.1 | -1.6 | 2.5 |
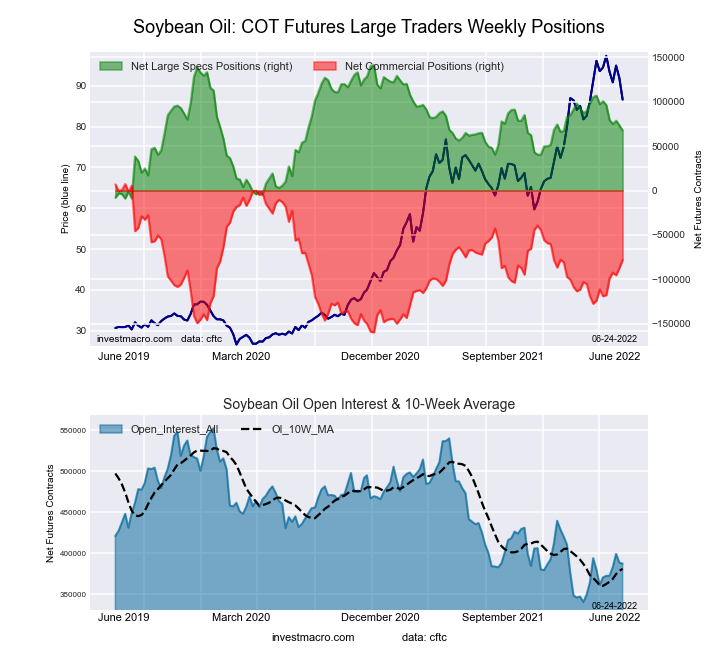
This week’s current strength score (the trader positioning range over the past three years, measured from 0 to 100) shows the speculators are currently Bullish with a score of 50.9 percent. The commercials are Bearish with a score of 48.9 percent and the small traders (not shown in chart) are Bullish with a score of 52.0 percent.
| SOYBEAN OIL Futures Statistics | SPECULATORS | COMMERCIALS | SMALL TRADERS |
| – Percent of Open Interest Longs: | 25.0 | 52.9 | 8.4 |
| – Percent of Open Interest Shorts: | 7.6 | 73.0 | 5.7 |
| – Net Position: | 67,530 | -77,869 | 10,339 |
| – Gross Longs: | 96,861 | 205,007 | 32,564 |
| – Gross Shorts: | 29,331 | 282,876 | 22,225 |
| – Long to Short Ratio: | 3.3 to 1 | 0.7 to 1 | 1.5 to 1 |
| NET POSITION TREND: | |||
| – Strength Index Score (3 Year Range Pct): | 50.9 | 48.9 | 52.0 |
| – Strength Index Reading (3 Year Range): | Bullish | Bearish | Bullish |
| NET POSITION MOVEMENT INDEX: | |||
| – 6-Week Change in Strength Index: | -22.0 | 24.5 | -29.5 |
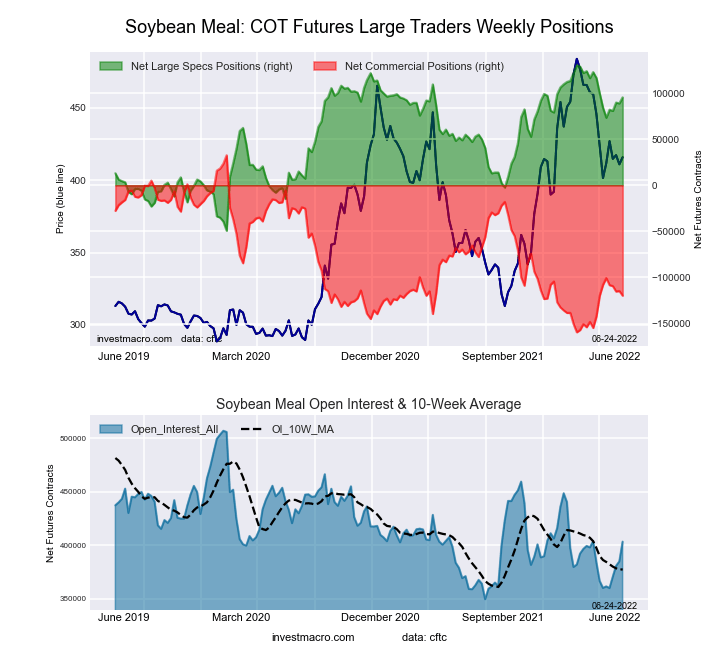
This week’s current strength score (the trader positioning range over the past three years, measured from 0 to 100) shows the speculators are currently Bullish-Extreme with a score of 80.6 percent. The commercials are Bearish with a score of 20.7 percent and the small traders (not shown in chart) are Bullish with a score of 60.0 percent.
| SOYBEAN MEAL Futures Statistics | SPECULATORS | COMMERCIALS | SMALL TRADERS |
| – Percent of Open Interest Longs: | 27.5 | 42.8 | 11.8 |
| – Percent of Open Interest Shorts: | 3.9 | 72.6 | 5.7 |
| – Net Position: | 95,371 | -119,799 | 24,428 |
| – Gross Longs: | 110,934 | 172,823 | 47,533 |
| – Gross Shorts: | 15,563 | 292,622 | 23,105 |
| – Long to Short Ratio: | 7.1 to 1 | 0.6 to 1 | 2.1 to 1 |
| NET POSITION TREND: | |||
| – Strength Index Score (3 Year Range Pct): | 80.6 | 20.7 | 60.0 |
| – Strength Index Reading (3 Year Range): | Bullish-Extreme | Bearish | Bullish |
| NET POSITION MOVEMENT INDEX: | |||
| – 6-Week Change in Strength Index: | 6.3 | -6.1 | 2.6 |
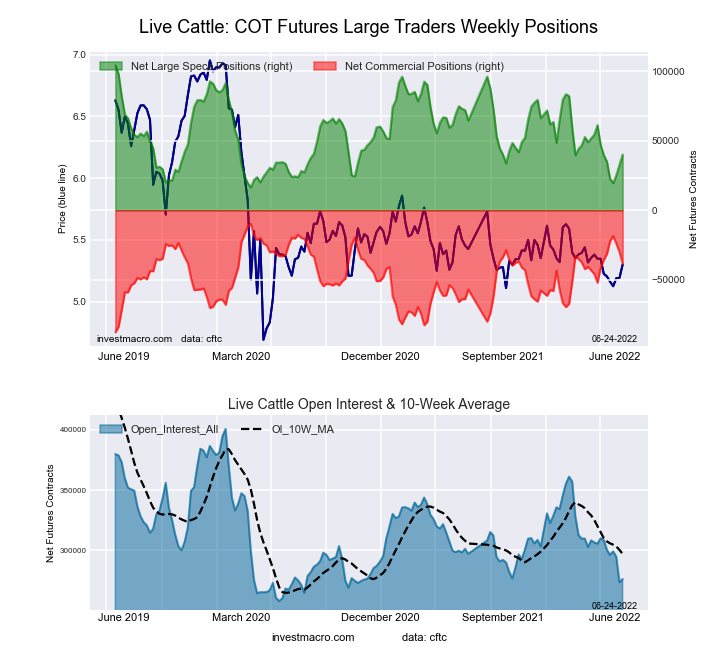
This week’s current strength score (the trader positioning range over the past three years, measured from 0 to 100) shows the speculators are currently Bearish with a score of 29.7 percent. The commercials are Bullish with a score of 60.4 percent and the small traders (not shown in chart) are Bullish with a score of 76.7 percent.
| LIVE CATTLE Futures Statistics | SPECULATORS | COMMERCIALS | SMALL TRADERS |
| – Percent of Open Interest Longs: | 37.1 | 39.7 | 11.4 |
| – Percent of Open Interest Shorts: | 22.6 | 53.6 | 12.0 |
| – Net Position: | 40,122 | -38,641 | -1,481 |
| – Gross Longs: | 102,557 | 109,561 | 31,589 |
| – Gross Shorts: | 62,435 | 148,202 | 33,070 |
| – Long to Short Ratio: | 1.6 to 1 | 0.7 to 1 | 1.0 to 1 |
| NET POSITION TREND: | |||
| – Strength Index Score (3 Year Range Pct): | 29.7 | 60.4 | 76.7 |
| – Strength Index Reading (3 Year Range): | Bearish | Bullish | Bullish |
| NET POSITION MOVEMENT INDEX: | |||
| – 6-Week Change in Strength Index: | 0.4 | -3.9 | 8.8 |
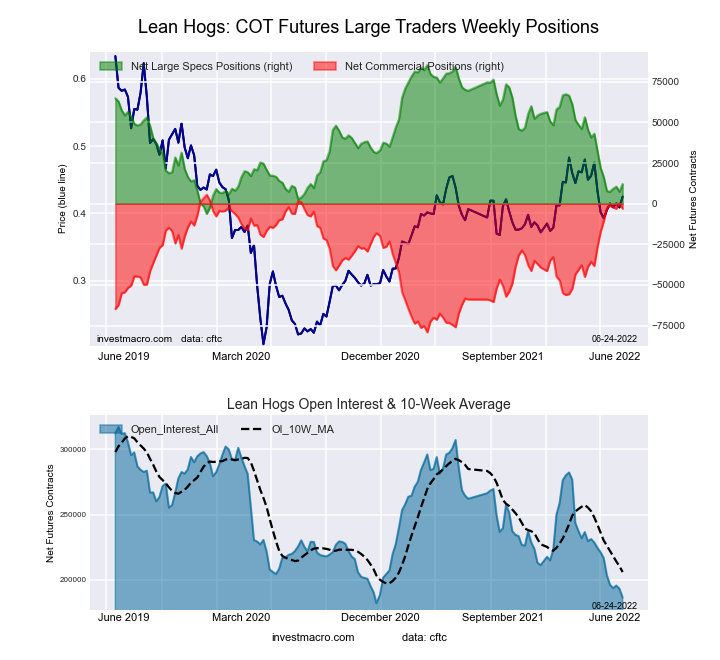
This week’s current strength score (the trader positioning range over the past three years, measured from 0 to 100) shows the speculators are currently Bearish-Extreme with a score of 19.9 percent. The commercials are Bullish-Extreme with a score of 89.9 percent and the small traders (not shown in chart) are Bearish with a score of 49.7 percent.
| LEAN HOGS Futures Statistics | SPECULATORS | COMMERCIALS | SMALL TRADERS |
| – Percent of Open Interest Longs: | 31.6 | 43.4 | 10.2 |
| – Percent of Open Interest Shorts: | 25.2 | 45.0 | 15.0 |
| – Net Position: | 12,059 | -3,041 | -9,018 |
| – Gross Longs: | 59,031 | 80,955 | 18,981 |
| – Gross Shorts: | 46,972 | 83,996 | 27,999 |
| – Long to Short Ratio: | 1.3 to 1 | 1.0 to 1 | 0.7 to 1 |
| NET POSITION TREND: | |||
| – Strength Index Score (3 Year Range Pct): | 19.9 | 89.9 | 49.7 |
| – Strength Index Reading (3 Year Range): | Bearish-Extreme | Bullish-Extreme | Bearish |
| NET POSITION MOVEMENT INDEX: | |||
| – 6-Week Change in Strength Index: | -4.7 | 9.2 | -18.1 |
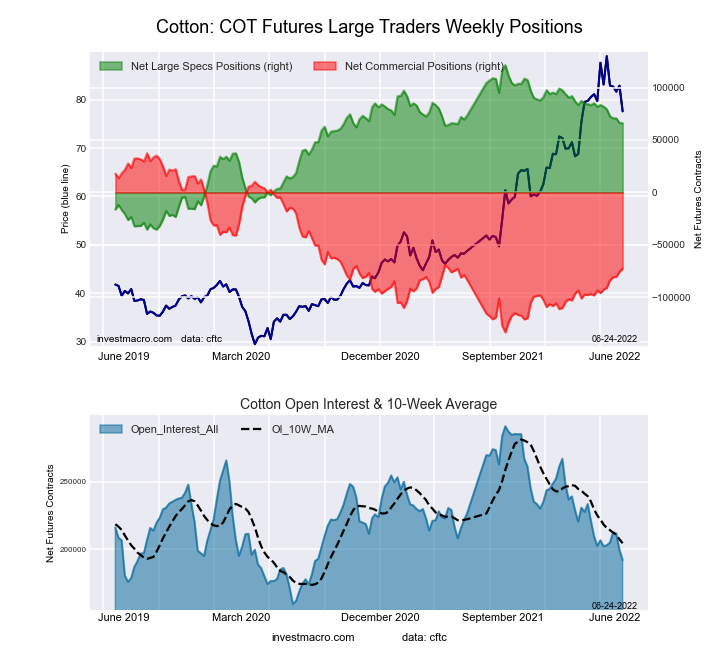
This week’s current strength score (the trader positioning range over the past three years, measured from 0 to 100) shows the speculators are currently Bullish with a score of 64.7 percent. The commercials are Bearish with a score of 35.5 percent and the small traders (not shown in chart) are Bullish with a score of 54.2 percent.
| COTTON Futures Statistics | SPECULATORS | COMMERCIALS | SMALL TRADERS |
| – Percent of Open Interest Longs: | 42.4 | 39.7 | 8.3 |
| – Percent of Open Interest Shorts: | 8.0 | 77.6 | 4.8 |
| – Net Position: | 66,045 | -72,681 | 6,636 |
| – Gross Longs: | 81,410 | 76,251 | 15,830 |
| – Gross Shorts: | 15,365 | 148,932 | 9,194 |
| – Long to Short Ratio: | 5.3 to 1 | 0.5 to 1 | 1.7 to 1 |
| NET POSITION TREND: | |||
| – Strength Index Score (3 Year Range Pct): | 64.7 | 35.5 | 54.2 |
| – Strength Index Reading (3 Year Range): | Bullish | Bearish | Bullish |
| NET POSITION MOVEMENT INDEX: | |||
| – 6-Week Change in Strength Index: | -10.0 | 11.7 | -26.7 |
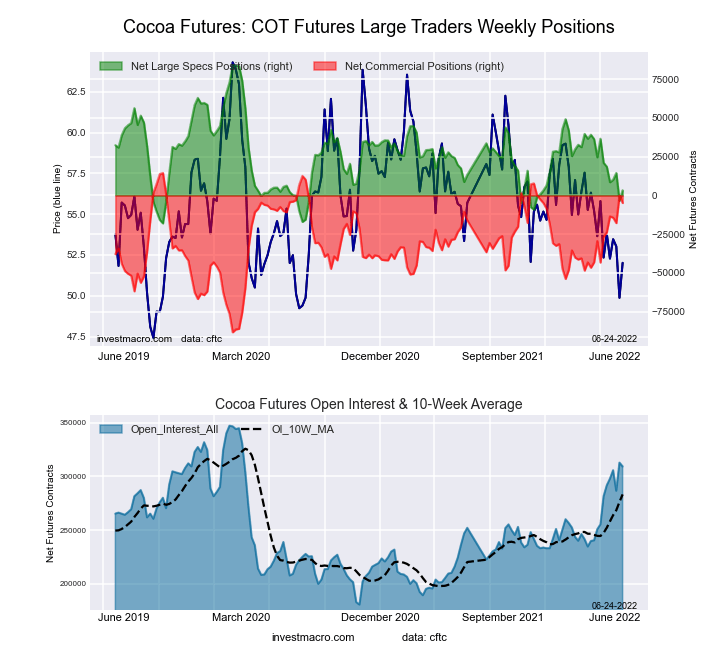
This week’s current strength score (the trader positioning range over the past three years, measured from 0 to 100) shows the speculators are currently Bearish with a score of 20.9 percent. The commercials are Bullish-Extreme with a score of 81.2 percent and the small traders (not shown in chart) are Bearish-Extreme with a score of 12.0 percent.
| COCOA Futures Statistics | SPECULATORS | COMMERCIALS | SMALL TRADERS |
| – Percent of Open Interest Longs: | 30.3 | 43.9 | 4.2 |
| – Percent of Open Interest Shorts: | 29.2 | 45.5 | 3.7 |
| – Net Position: | 3,305 | -4,856 | 1,551 |
| – Gross Longs: | 93,606 | 135,958 | 12,977 |
| – Gross Shorts: | 90,301 | 140,814 | 11,426 |
| – Long to Short Ratio: | 1.0 to 1 | 1.0 to 1 | 1.1 to 1 |
| NET POSITION TREND: | |||
| – Strength Index Score (3 Year Range Pct): | 20.9 | 81.2 | 12.0 |
| – Strength Index Reading (3 Year Range): | Bearish | Bullish-Extreme | Bearish-Extreme |
| NET POSITION MOVEMENT INDEX: | |||
| – 6-Week Change in Strength Index: | -17.4 | 21.3 | -41.9 |
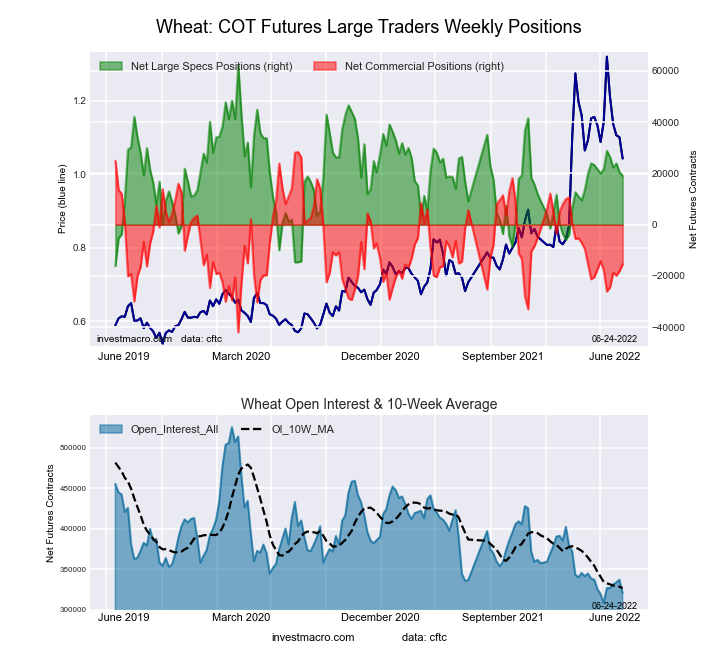
This week’s current strength score (the trader positioning range over the past three years, measured from 0 to 100) shows the speculators are currently Bearish with a score of 43.9 percent. The commercials are Bearish with a score of 37.8 percent and the small traders (not shown in chart) are Bullish-Extreme with a score of 91.4 percent.
| WHEAT Futures Statistics | SPECULATORS | COMMERCIALS | SMALL TRADERS |
| – Percent of Open Interest Longs: | 32.1 | 39.1 | 10.4 |
| – Percent of Open Interest Shorts: | 26.2 | 44.0 | 11.5 |
| – Net Position: | 19,067 | -15,407 | -3,660 |
| – Gross Longs: | 102,924 | 125,399 | 33,167 |
| – Gross Shorts: | 83,857 | 140,806 | 36,827 |
| – Long to Short Ratio: | 1.2 to 1 | 0.9 to 1 | 0.9 to 1 |
| NET POSITION TREND: | |||
| – Strength Index Score (3 Year Range Pct): | 43.9 | 37.8 | 91.4 |
| – Strength Index Reading (3 Year Range): | Bearish | Bearish | Bullish-Extreme |
| NET POSITION MOVEMENT INDEX: | |||
| – 6-Week Change in Strength Index: | -3.4 | 3.4 | 1.3 |
Article By InvestMacro – Receive our weekly COT Reports by Email
*COT Report: The COT data, released weekly to the public each Friday, is updated through the most recent Tuesday (data is 3 days old) and shows a quick view of how large speculators or non-commercials (for-profit traders) were positioned in the futures markets.
The CFTC categorizes trader positions according to commercial hedgers (traders who use futures contracts for hedging as part of the business), non-commercials (large traders who speculate to realize trading profits) and nonreportable traders (usually small traders/speculators) as well as their open interest (contracts open in the market at time of reporting).See CFTC criteria here.
By JustMarkets The US stock indices started the week on a downbeat note. By the…
By Analytical Department RoboForex GBP/USD fell to 1.3437 on Tuesday as investors assessed the appointment…
By JustMarkets The US stock indices ended Friday’s session in the red. By the end…
By Analytical Department RoboForex USD/JPY opens the week at 162.36 on Monday. The Japanese yen…
By InvestMacro Here are the latest charts and statistics for the Commitment of Traders (COT)…
By InvestMacro The latest update for the weekly Commitment of Traders (COT) report was released…
This website uses cookies.