
By InvestMacro | COT | Data Tables | COT Leaders | Downloads | COT Newsletter
Here are the latest charts and statistics for the Commitment of Traders (COT) data published by the Commodities Futures Trading Commission (CFTC).
The latest COT data is updated through Tuesday May 24th and shows a quick view of how large traders (for-profit speculators and commercial entities) were positioned in the futures markets.
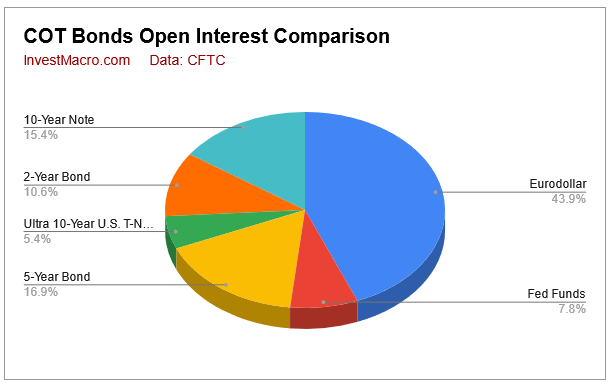
COT bonds market speculator bets were mostly lower this week as only three out of the eight bond markets we cover had higher positioning this week while five markets saw lower positions. Leading the gains for bonds was the 5-Year Bond (139,697 contracts) and the 2-Year Bond (99,344 contracts) with the Eurodollar (41,671 contracts) also showing a positive week. Meanwhile, leading the declines in speculator bets this week were the 10-Year Bond (-65,033 contracts) and the Ultra US Bond (-13,336 contracts) with the Ultra 10-Year (-1,088 contracts), Long US Bond (-3,505 contracts) and the Fed Funds (-6,524 contracts) also coming in with lower bets on the week.
Free Reports:
 Download Our Metatrader 4 Indicators – Put Our Free MetaTrader 4 Custom Indicators on your charts when you join our Weekly Newsletter
 Get our Weekly Commitment of Traders Reports - See where the biggest traders (Hedge Funds and Commercial Hedgers) are positioned in the futures markets on a weekly basis.
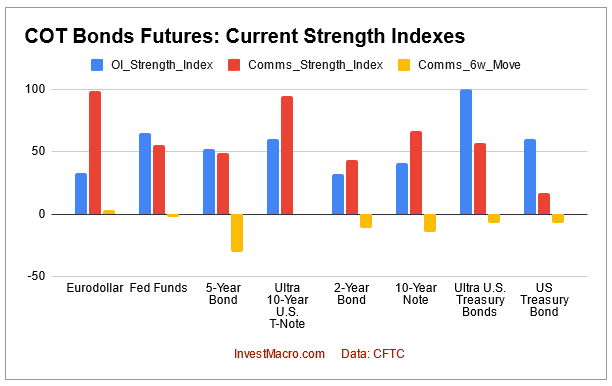
Speculator strength standings for each Bond Market where strength index is current net position compared to past three years, above 80 is bullish extreme, below 20 is bearish extreme
- OI Strength = Current Open Interest level compared to last 3 years range
- Spec Strength = Current Net Speculator level compared to last 3 years range
- Strength Move = Six week change of Spec Strength
| May-24-2022 | OI | OI-Index | Spec-Net | Spec-Index | Com-Net | COM-Index | Smalls-Net | Smalls-Index |
|---|---|---|---|---|---|---|---|---|
| Eurodollar | 10,441,566 | 33 | -2,832,780 | 1 | 3,227,860 | 99 | -395,080 | 17 |
| FedFunds | 1,859,067 | 65 | 42,491 | 45 | -38,493 | 55 | -3,998 | 50 |
| 2-Year | 2,526,000 | 32 | -35,293 | 75 | 106,854 | 43 | -71,561 | 19 |
| Long T-Bond | 1,267,244 | 60 | 28,502 | 94 | -11,224 | 17 | -17,278 | 39 |
| 10-Year | 3,662,628 | 41 | -225,124 | 38 | 376,665 | 67 | -151,541 | 44 |
| 5-Year | 4,011,412 | 52 | -120,527 | 62 | 292,048 | 49 | -171,521 | 34 |
3-Month Eurodollars Futures:
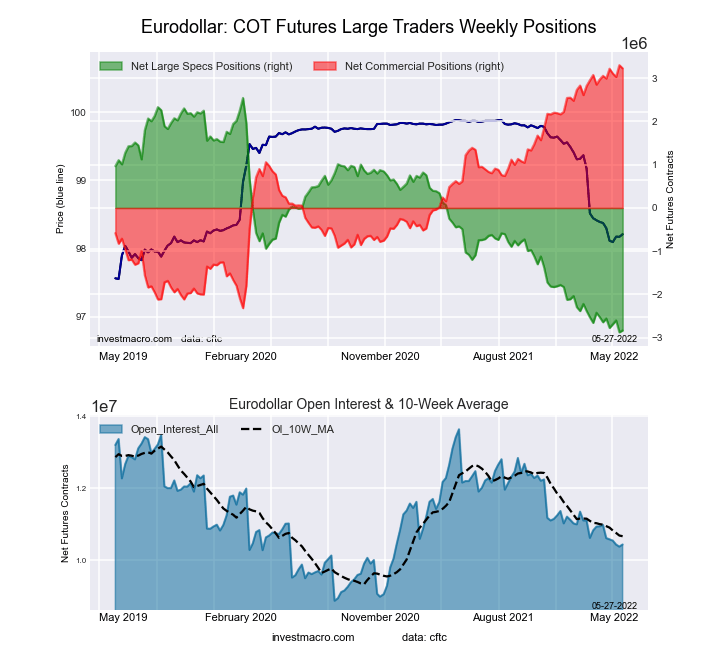 The 3-Month Eurodollars large speculator standing this week resulted in a net position of -2,832,780 contracts in the data reported through Tuesday. This was a weekly increase of 41,671 contracts from the previous week which had a total of -2,874,451 net contracts.
This week’s current strength score (the trader positioning range over the past three years, measured from 0 to 100) shows the speculators are currently Bearish-Extreme with a score of 0.8 percent. The commercials are Bullish-Extreme with a score of 98.7 percent and the small traders (not shown in chart) are Bearish-Extreme with a score of 17.5 percent.
| 3-Month Eurodollars Statistics | SPECULATORS | COMMERCIALS | SMALL TRADERS |
| – Percent of Open Interest Longs: | 3.4 | 75.4 | 3.7 |
| – Percent of Open Interest Shorts: | 30.5 | 44.5 | 7.5 |
| – Net Position: | -2,832,780 | 3,227,860 | -395,080 |
| – Gross Longs: | 351,909 | 7,877,754 | 384,474 |
| – Gross Shorts: | 3,184,689 | 4,649,894 | 779,554 |
| – Long to Short Ratio: | 0.1 to 1 | 1.7 to 1 | 0.5 to 1 |
| NET POSITION TREND: | |||
| – Strength Index Score (3 Year Range Pct): | 0.8 | 98.7 | 17.5 |
| – Strength Index Reading (3 Year Range): | Bearish-Extreme | Bullish-Extreme | Bearish-Extreme |
| NET POSITION MOVEMENT INDEX: | |||
| – 6-Week Change in Strength Index: | -3.5 | 3.1 | 3.7 |
30-Day Federal Funds Futures:
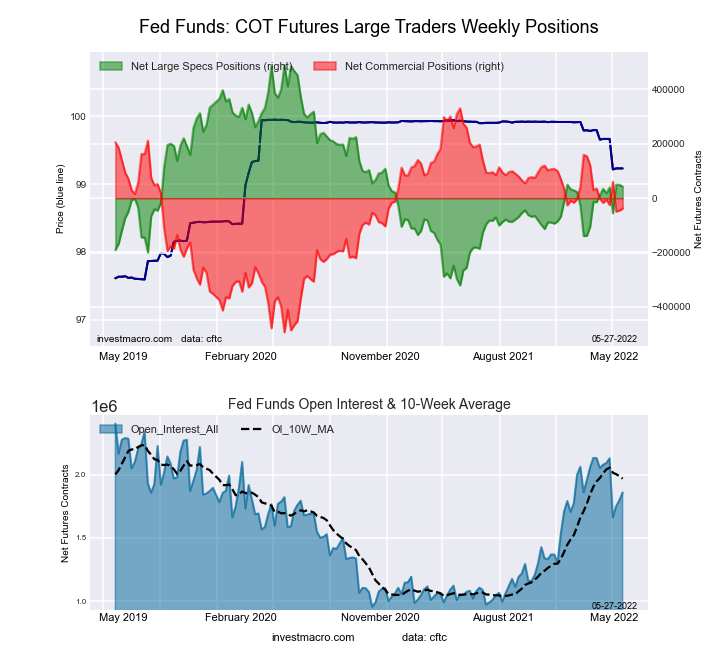 The 30-Day Federal Funds large speculator standing this week resulted in a net position of 42,491 contracts in the data reported through Tuesday. This was a weekly fall of -6,524 contracts from the previous week which had a total of 49,015 net contracts.
This week’s current strength score (the trader positioning range over the past three years, measured from 0 to 100) shows the speculators are currently Bearish with a score of 44.9 percent. The commercials are Bullish with a score of 55.2 percent and the small traders (not shown in chart) are Bearish with a score of 49.5 percent.
| 30-Day Federal Funds Statistics | SPECULATORS | COMMERCIALS | SMALL TRADERS |
| – Percent of Open Interest Longs: | 6.4 | 75.5 | 2.1 |
| – Percent of Open Interest Shorts: | 4.1 | 77.5 | 2.3 |
| – Net Position: | 42,491 | -38,493 | -3,998 |
| – Gross Longs: | 119,202 | 1,403,144 | 39,289 |
| – Gross Shorts: | 76,711 | 1,441,637 | 43,287 |
| – Long to Short Ratio: | 1.6 to 1 | 1.0 to 1 | 0.9 to 1 |
| NET POSITION TREND: | |||
| – Strength Index Score (3 Year Range Pct): | 44.9 | 55.2 | 49.5 |
| – Strength Index Reading (3 Year Range): | Bearish | Bullish | Bearish |
| NET POSITION MOVEMENT INDEX: | |||
| – 6-Week Change in Strength Index: | 1.0 | -2.6 | 33.5 |
2-Year Treasury Note Futures:
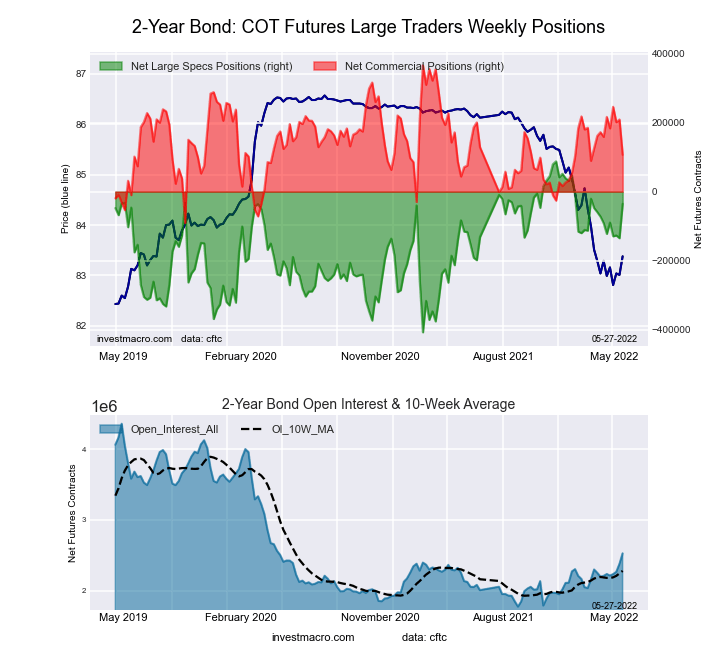 The 2-Year Treasury Note large speculator standing this week resulted in a net position of -35,293 contracts in the data reported through Tuesday. This was a weekly boost of 99,344 contracts from the previous week which had a total of -134,637 net contracts.
This week’s current strength score (the trader positioning range over the past three years, measured from 0 to 100) shows the speculators are currently Bullish with a score of 75.1 percent. The commercials are Bearish with a score of 43.2 percent and the small traders (not shown in chart) are Bearish-Extreme with a score of 18.8 percent.
| 2-Year Treasury Note Statistics | SPECULATORS | COMMERCIALS | SMALL TRADERS |
| – Percent of Open Interest Longs: | 14.3 | 73.0 | 5.8 |
| – Percent of Open Interest Shorts: | 15.7 | 68.8 | 8.7 |
| – Net Position: | -35,293 | 106,854 | -71,561 |
| – Gross Longs: | 361,614 | 1,845,029 | 147,143 |
| – Gross Shorts: | 396,907 | 1,738,175 | 218,704 |
| – Long to Short Ratio: | 0.9 to 1 | 1.1 to 1 | 0.7 to 1 |
| NET POSITION TREND: | |||
| – Strength Index Score (3 Year Range Pct): | 75.1 | 43.2 | 18.8 |
| – Strength Index Reading (3 Year Range): | Bullish | Bearish | Bearish-Extreme |
| NET POSITION MOVEMENT INDEX: | |||
| – 6-Week Change in Strength Index: | 11.2 | -11.4 | -1.5 |
5-Year Treasury Note Futures:
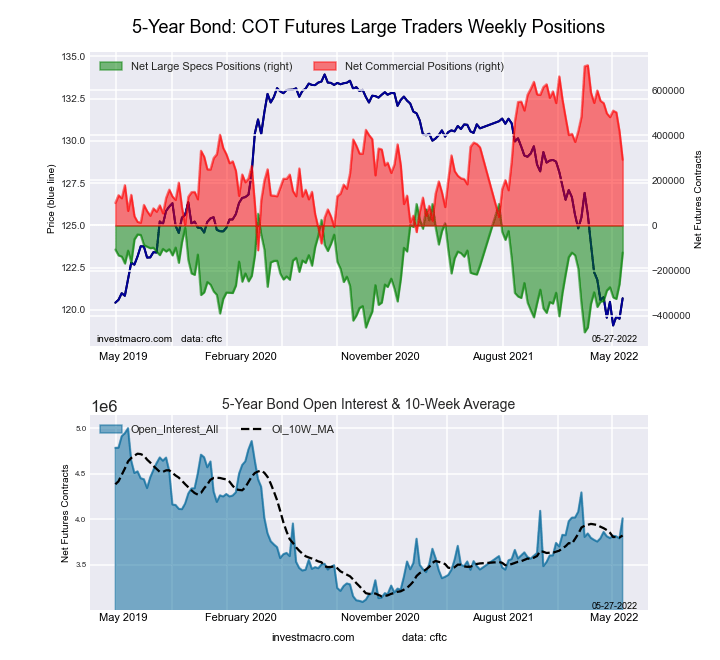 The 5-Year Treasury Note large speculator standing this week resulted in a net position of -120,527 contracts in the data reported through Tuesday. This was a weekly rise of 139,697 contracts from the previous week which had a total of -260,224 net contracts.
This week’s current strength score (the trader positioning range over the past three years, measured from 0 to 100) shows the speculators are currently Bullish with a score of 62.1 percent. The commercials are Bearish with a score of 48.9 percent and the small traders (not shown in chart) are Bearish with a score of 33.9 percent.
| 5-Year Treasury Note Statistics | SPECULATORS | COMMERCIALS | SMALL TRADERS |
| – Percent of Open Interest Longs: | 10.1 | 77.1 | 9.7 |
| – Percent of Open Interest Shorts: | 13.1 | 69.8 | 14.0 |
| – Net Position: | -120,527 | 292,048 | -171,521 |
| – Gross Longs: | 405,475 | 3,093,412 | 388,207 |
| – Gross Shorts: | 526,002 | 2,801,364 | 559,728 |
| – Long to Short Ratio: | 0.8 to 1 | 1.1 to 1 | 0.7 to 1 |
| NET POSITION TREND: | |||
| – Strength Index Score (3 Year Range Pct): | 62.1 | 48.9 | 33.9 |
| – Strength Index Reading (3 Year Range): | Bullish | Bearish | Bearish |
| NET POSITION MOVEMENT INDEX: | |||
| – 6-Week Change in Strength Index: | 37.6 | -30.6 | 10.2 |
10-Year Treasury Note Futures:
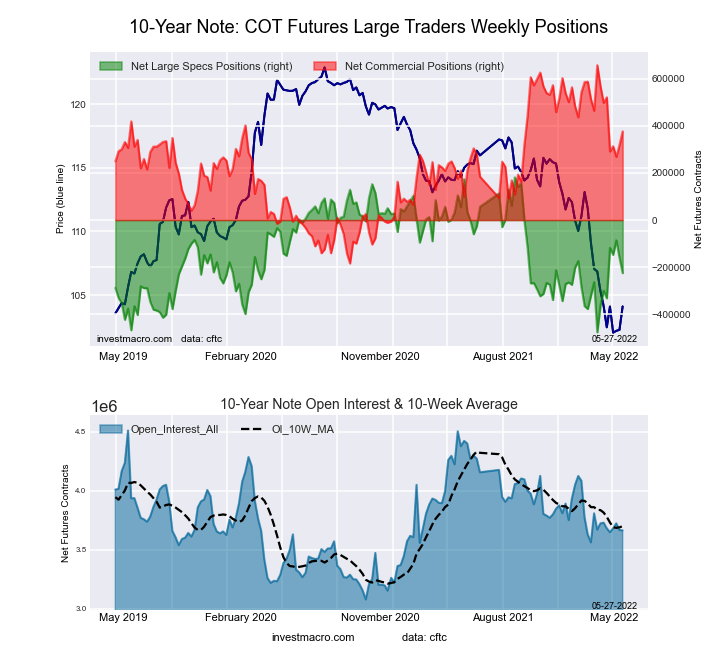 The 10-Year Treasury Note large speculator standing this week resulted in a net position of -225,124 contracts in the data reported through Tuesday. This was a weekly decrease of -65,033 contracts from the previous week which had a total of -160,091 net contracts.
This week’s current strength score (the trader positioning range over the past three years, measured from 0 to 100) shows the speculators are currently Bearish with a score of 38.2 percent. The commercials are Bullish with a score of 66.6 percent and the small traders (not shown in chart) are Bearish with a score of 43.8 percent.
| 10-Year Treasury Note Statistics | SPECULATORS | COMMERCIALS | SMALL TRADERS |
| – Percent of Open Interest Longs: | 7.5 | 77.4 | 9.7 |
| – Percent of Open Interest Shorts: | 13.6 | 67.1 | 13.8 |
| – Net Position: | -225,124 | 376,665 | -151,541 |
| – Gross Longs: | 273,667 | 2,834,111 | 354,203 |
| – Gross Shorts: | 498,791 | 2,457,446 | 505,744 |
| – Long to Short Ratio: | 0.5 to 1 | 1.2 to 1 | 0.7 to 1 |
| NET POSITION TREND: | |||
| – Strength Index Score (3 Year Range Pct): | 38.2 | 66.6 | 43.8 |
| – Strength Index Reading (3 Year Range): | Bearish | Bullish | Bearish |
| NET POSITION MOVEMENT INDEX: | |||
| – 6-Week Change in Strength Index: | 11.4 | -14.4 | 11.0 |
Ultra 10-Year Notes Futures:
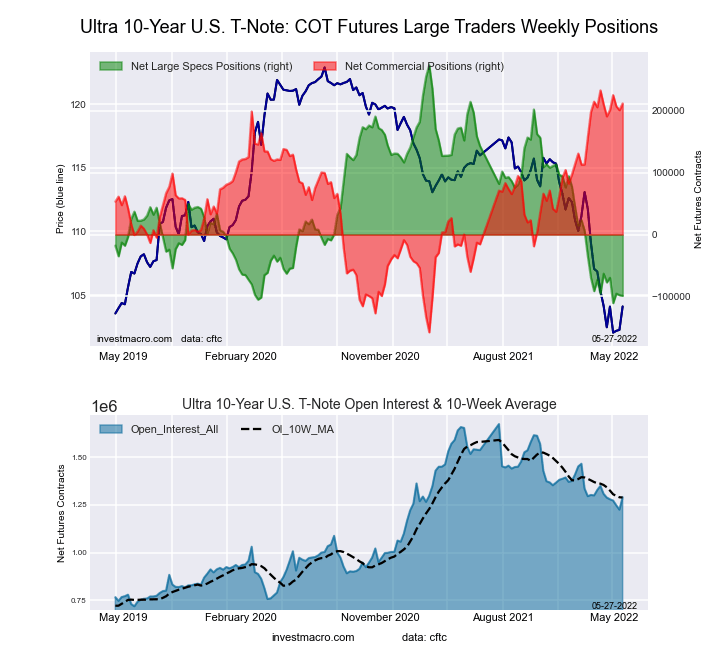 The Ultra 10-Year Notes large speculator standing this week resulted in a net position of -98,925 contracts in the data reported through Tuesday. This was a weekly fall of -1,088 contracts from the previous week which had a total of -97,837 net contracts.
This week’s current strength score (the trader positioning range over the past three years, measured from 0 to 100) shows the speculators are currently Bearish-Extreme with a score of 3.1 percent. The commercials are Bullish-Extreme with a score of 94.6 percent and the small traders (not shown in chart) are Bearish with a score of 47.9 percent.
| Ultra 10-Year Notes Statistics | SPECULATORS | COMMERCIALS | SMALL TRADERS |
| – Percent of Open Interest Longs: | 5.3 | 80.9 | 11.9 |
| – Percent of Open Interest Shorts: | 13.0 | 64.5 | 20.7 |
| – Net Position: | -98,925 | 211,834 | -112,909 |
| – Gross Longs: | 68,305 | 1,044,490 | 153,665 |
| – Gross Shorts: | 167,230 | 832,656 | 266,574 |
| – Long to Short Ratio: | 0.4 to 1 | 1.3 to 1 | 0.6 to 1 |
| NET POSITION TREND: | |||
| – Strength Index Score (3 Year Range Pct): | 3.1 | 94.6 | 47.9 |
| – Strength Index Reading (3 Year Range): | Bearish-Extreme | Bullish-Extreme | Bearish |
| NET POSITION MOVEMENT INDEX: | |||
| – 6-Week Change in Strength Index: | -9.3 | 0.3 | 20.8 |
US Treasury Bonds Futures:
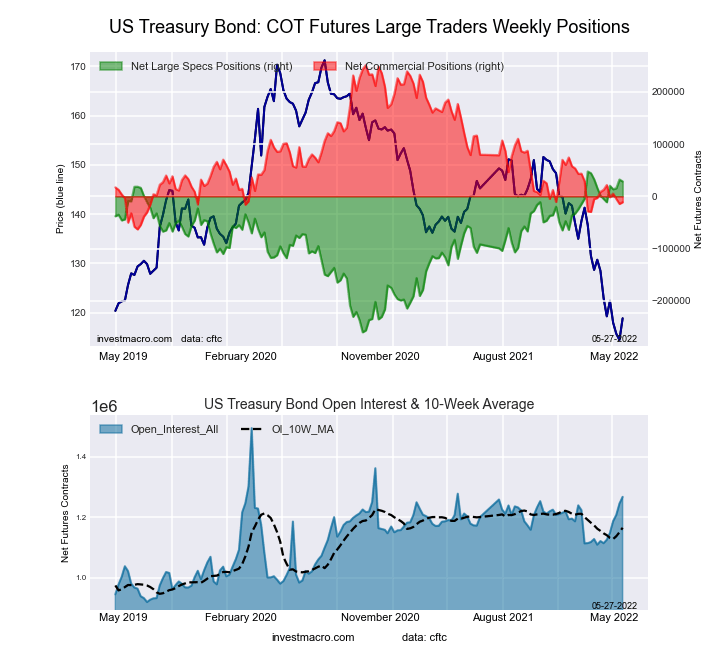 The US Treasury Bonds large speculator standing this week resulted in a net position of 28,502 contracts in the data reported through Tuesday. This was a weekly fall of -3,505 contracts from the previous week which had a total of 32,007 net contracts.
This week’s current strength score (the trader positioning range over the past three years, measured from 0 to 100) shows the speculators are currently Bullish-Extreme with a score of 93.9 percent. The commercials are Bearish-Extreme with a score of 16.6 percent and the small traders (not shown in chart) are Bearish with a score of 38.9 percent.
| US Treasury Bonds Statistics | SPECULATORS | COMMERCIALS | SMALL TRADERS |
| – Percent of Open Interest Longs: | 11.2 | 72.8 | 14.0 |
| – Percent of Open Interest Shorts: | 8.9 | 73.7 | 15.4 |
| – Net Position: | 28,502 | -11,224 | -17,278 |
| – Gross Longs: | 141,452 | 922,729 | 177,518 |
| – Gross Shorts: | 112,950 | 933,953 | 194,796 |
| – Long to Short Ratio: | 1.3 to 1 | 1.0 to 1 | 0.9 to 1 |
| NET POSITION TREND: | |||
| – Strength Index Score (3 Year Range Pct): | 93.9 | 16.6 | 38.9 |
| – Strength Index Reading (3 Year Range): | Bullish-Extreme | Bearish-Extreme | Bearish |
| NET POSITION MOVEMENT INDEX: | |||
| – 6-Week Change in Strength Index: | 11.0 | -7.5 | -7.9 |
Ultra US Treasury Bonds Futures:
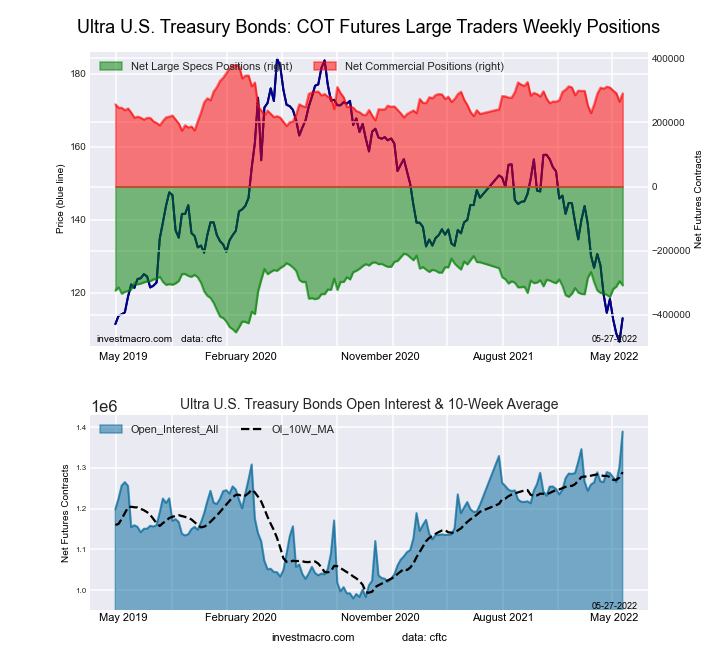 The Ultra US Treasury Bonds large speculator standing this week resulted in a net position of -307,895 contracts in the data reported through Tuesday. This was a weekly fall of -13,336 contracts from the previous week which had a total of -294,559 net contracts.
This week’s current strength score (the trader positioning range over the past three years, measured from 0 to 100) shows the speculators are currently Bullish with a score of 59.6 percent. The commercials are Bullish with a score of 57.0 percent and the small traders (not shown in chart) are Bearish with a score of 40.9 percent.
| Ultra US Treasury Bonds Statistics | SPECULATORS | COMMERCIALS | SMALL TRADERS |
| – Percent of Open Interest Longs: | 3.6 | 81.8 | 11.6 |
| – Percent of Open Interest Shorts: | 25.8 | 60.9 | 10.3 |
| – Net Position: | -307,895 | 290,252 | 17,643 |
| – Gross Longs: | 50,153 | 1,136,228 | 161,147 |
| – Gross Shorts: | 358,048 | 845,976 | 143,504 |
| – Long to Short Ratio: | 0.1 to 1 | 1.3 to 1 | 1.1 to 1 |
| NET POSITION TREND: | |||
| – Strength Index Score (3 Year Range Pct): | 59.6 | 57.0 | 40.9 |
| – Strength Index Reading (3 Year Range): | Bullish | Bullish | Bearish |
| NET POSITION MOVEMENT INDEX: | |||
| – 6-Week Change in Strength Index: | 10.2 | -7.2 | -7.3 |
Article By InvestMacro – Receive our weekly COT Reports by Email
*COT Report: The COT data, released weekly to the public each Friday, is updated through the most recent Tuesday (data is 3 days old) and shows a quick view of how large speculators or non-commercials (for-profit traders) were positioned in the futures markets.
The CFTC categorizes trader positions according to commercial hedgers (traders who use futures contracts for hedging as part of the business), non-commercials (large traders who speculate to realize trading profits) and nonreportable traders (usually small traders/speculators) as well as their open interest (contracts open in the market at time of reporting).See CFTC criteria here.

- Geopolitical and macroeconomic conditions continue to pressure market sentiment Jul 20, 2026
- USD/JPY Poised to Continue Gains as Expensive Oil and Lack of Support Weigh on Yen Jul 20, 2026
- COT Metals Charts: Weekly Speculator Bets led by Copper & Steel Jul 18, 2026
- COT Bonds Charts: Weekly Speculator Bets led by 2-Year, SOFR 3M & 5-Year Bonds Jul 18, 2026
- COT Energy Charts: Weekly Speculator Bets led by Brent Oil & Heating Oil Jul 18, 2026
- COT Soft Commodities Charts: Weekly Speculator Bets led by Wheat, Corn & Soybean Meal Jul 18, 2026
- The Bank of Canada kept its interest rate unchanged. Platinum prices reached a three‑week high Jul 16, 2026
- Stock indices rose after the release of US inflation data. China’s GDP slowed sharply Jul 15, 2026
- GBP/USD Awaits Political News: What Will Happen Next Jul 15, 2026
- USD/JPY Holds at Highs: Pressure Lingers on Yen Jul 14, 2026