
By InvestMacro | COT | Data Tables | COT Leaders | Downloads | COT Newsletter
Here are the latest charts and statistics for the Commitment of Traders (COT) data published by the Commodities Futures Trading Commission (CFTC).
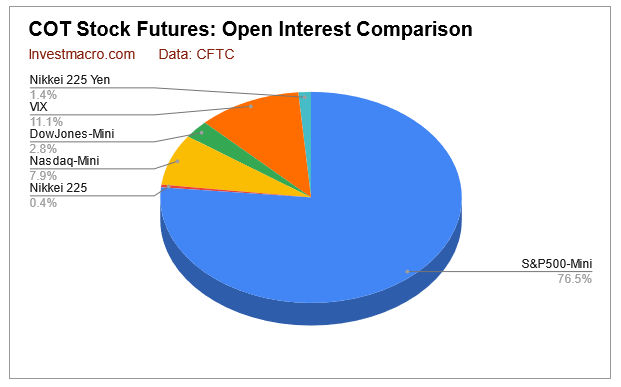
The latest COT data is updated through Tuesday May 3rd 2022 and shows a quick view of how large traders (for-profit speculators and commercial entities) were positioned in the futures markets.
The stock markets that saw higher speculator bets this week were VIX (10,496 contracts), Dow Jones Industrial Average Mini (2,604 contracts), Nasdaq Mini (259 contracts) and the MSCI EAFE Mini (6,851 contracts). The markets with lower speculator bets this week were S&P500 Mini (-70,543 contracts), Russell 2000 Mini (-538 contracts), Nikkei 225 USD (-4,249 contracts) and the MSCI Emerging Markets Mini (-12,388 contracts).
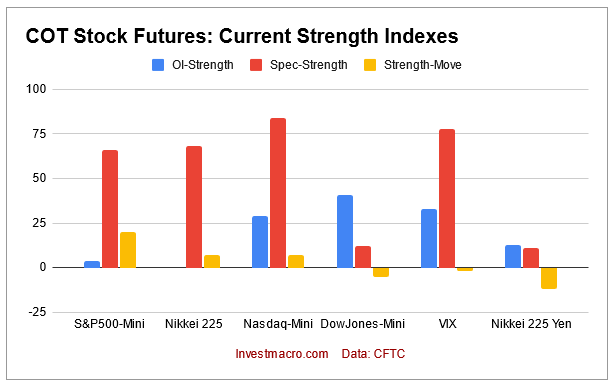
Speculator strength standings for each Stock Market where strength index is current net position compared to past three years, above 80 is bullish extreme, below 20 is bearish extreme OI Strength = Current Open Interest level compared to last 3 years range Spec Strength = Current Net Speculator level compared to last 3 years range Strength Move = Six week change of Spec Strength
Free Reports:
 Download Our Metatrader 4 Indicators – Put Our Free MetaTrader 4 Custom Indicators on your charts when you join our Weekly Newsletter
 Get our Weekly Commitment of Traders Reports - See where the biggest traders (Hedge Funds and Commercial Hedgers) are positioned in the futures markets on a weekly basis.
| May-03-2022 | OI | OI-Index | Spec-Net | Spec-Index | Com-Net | COM-Index | Smalls-Net | Smalls-Index |
|---|---|---|---|---|---|---|---|---|
| S&P500-Mini | 2,208,674 | 4 | 52,207 | 66 | -58,797 | 55 | 6,590 | 28 |
| Nikkei 225 | 11,749 | 0 | -1,925 | 68 | 4,181 | 51 | -2,256 | 0 |
| Nasdaq-Mini | 226,722 | 29 | 16,092 | 84 | -6,367 | 23 | -9,725 | 28 |
| DowJones-Mini | 79,448 | 41 | -19,181 | 12 | 19,042 | 86 | 139 | 39 |
| VIX | 320,512 | 33 | -61,729 | 78 | 69,674 | 23 | -7,945 | 53 |
| Nikkei 225 Yen | 39,065 | 13 | -4,440 | 11 | 21,337 | 81 | -16,897 | 40 |
VIX Volatility Futures:
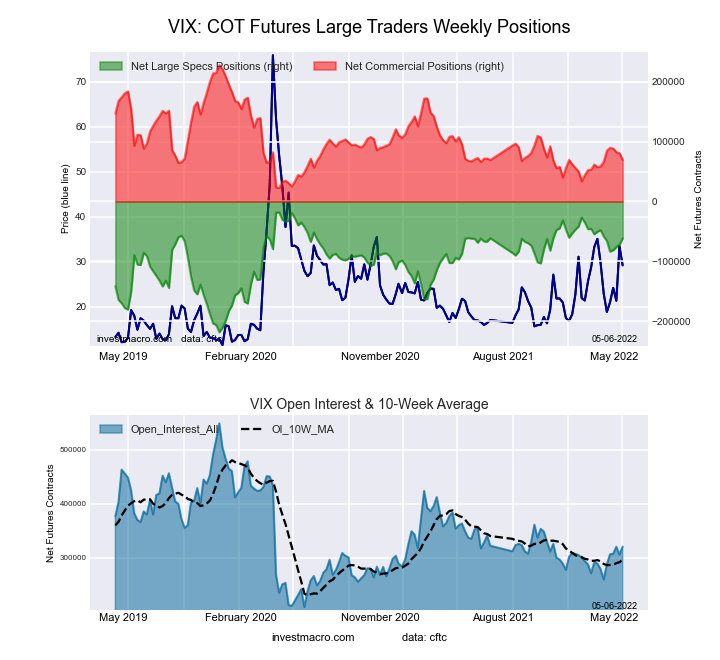 The VIX Volatility large speculator standing this week came in at a net position of -61,729 contracts in the data reported through Tuesday. This was a weekly gain of 10,496 contracts from the previous week which had a total of -72,225 net contracts.
This week’s current strength score (the trader positioning range over the past three years, measured from 0 to 100) shows the speculators are currently Bullish with a score of 78.3 percent. The commercials are Bearish with a score of 23.0 percent and the small traders (not shown in chart) are Bullish with a score of 52.8 percent.
| VIX Volatility Futures Statistics | SPECULATORS | COMMERCIALS | SMALL TRADERS |
| – Percent of Open Interest Longs: | 18.0 | 53.4 | 7.4 |
| – Percent of Open Interest Shorts: | 37.2 | 31.7 | 9.9 |
| – Net Position: | -61,729 | 69,674 | -7,945 |
| – Gross Longs: | 57,620 | 171,272 | 23,726 |
| – Gross Shorts: | 119,349 | 101,598 | 31,671 |
| – Long to Short Ratio: | 0.5 to 1 | 1.7 to 1 | 0.7 to 1 |
| NET POSITION TREND: | |||
| – Strength Index Score (3 Year Range Pct): | 78.3 | 23.0 | 52.8 |
| – Strength Index Reading (3 Year Range): | Bullish | Bearish | Bullish |
| NET POSITION MOVEMENT INDEX: | |||
| – 6-Week Change in Strength Index: | -1.7 | 1.6 | 0.5 |
S&P500 Mini Futures:
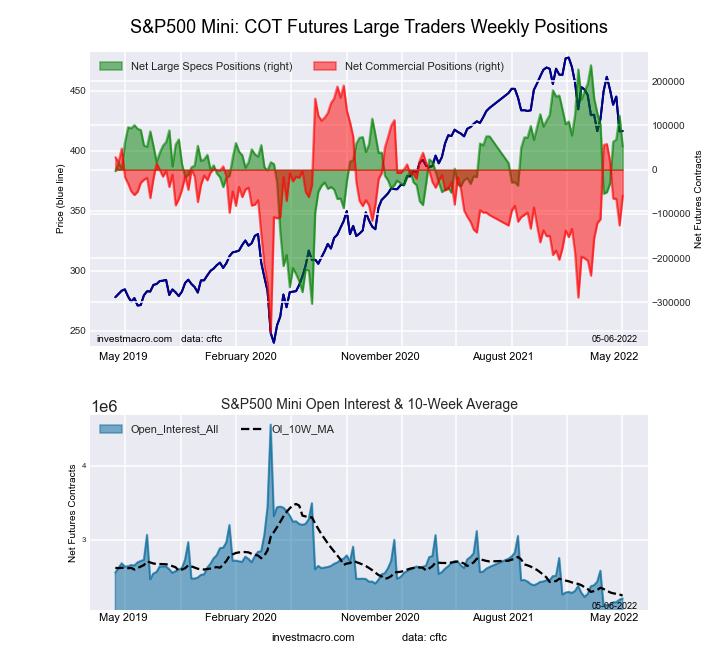 The S&P500 Mini large speculator standing this week came in at a net position of 52,207 contracts in the data reported through Tuesday. This was a weekly decrease of -70,543 contracts from the previous week which had a total of 122,750 net contracts.
This week’s current strength score (the trader positioning range over the past three years, measured from 0 to 100) shows the speculators are currently Bullish with a score of 65.9 percent. The commercials are Bullish with a score of 55.4 percent and the small traders (not shown in chart) are Bearish with a score of 27.7 percent.
| S&P500 Mini Futures Statistics | SPECULATORS | COMMERCIALS | SMALL TRADERS |
| – Percent of Open Interest Longs: | 16.3 | 69.9 | 11.1 |
| – Percent of Open Interest Shorts: | 14.0 | 72.5 | 10.8 |
| – Net Position: | 52,207 | -58,797 | 6,590 |
| – Gross Longs: | 360,949 | 1,543,020 | 245,017 |
| – Gross Shorts: | 308,742 | 1,601,817 | 238,427 |
| – Long to Short Ratio: | 1.2 to 1 | 1.0 to 1 | 1.0 to 1 |
| NET POSITION TREND: | |||
| – Strength Index Score (3 Year Range Pct): | 65.9 | 55.4 | 27.7 |
| – Strength Index Reading (3 Year Range): | Bullish | Bullish | Bearish |
| NET POSITION MOVEMENT INDEX: | |||
| – 6-Week Change in Strength Index: | 19.7 | -20.5 | 1.7 |
Dow Jones Mini Futures:
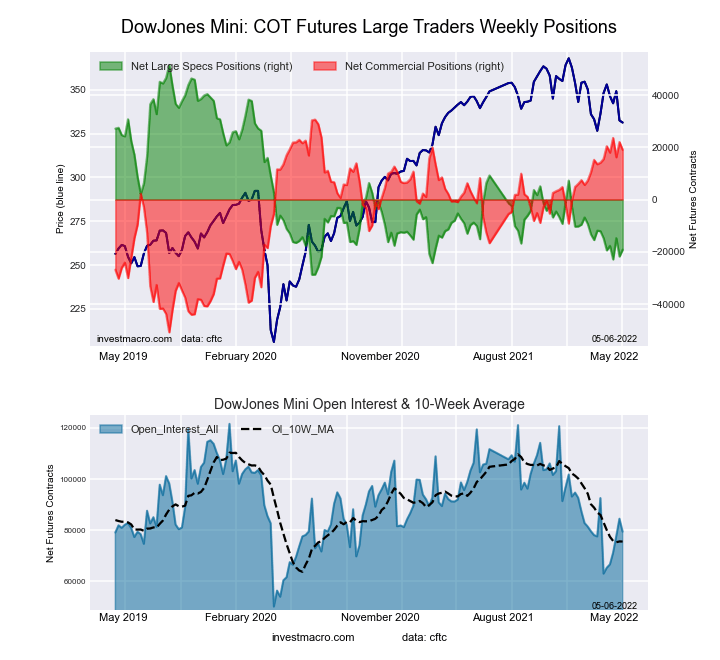 The Dow Jones Mini large speculator standing this week came in at a net position of -19,181 contracts in the data reported through Tuesday. This was a weekly rise of 2,604 contracts from the previous week which had a total of -21,785 net contracts.
This week’s current strength score (the trader positioning range over the past three years, measured from 0 to 100) shows the speculators are currently Bearish-Extreme with a score of 11.9 percent. The commercials are Bullish-Extreme with a score of 85.8 percent and the small traders (not shown in chart) are Bearish with a score of 39.2 percent.
| Dow Jones Mini Futures Statistics | SPECULATORS | COMMERCIALS | SMALL TRADERS |
| – Percent of Open Interest Longs: | 16.4 | 66.1 | 16.0 |
| – Percent of Open Interest Shorts: | 40.6 | 42.1 | 15.8 |
| – Net Position: | -19,181 | 19,042 | 139 |
| – Gross Longs: | 13,061 | 52,518 | 12,717 |
| – Gross Shorts: | 32,242 | 33,476 | 12,578 |
| – Long to Short Ratio: | 0.4 to 1 | 1.6 to 1 | 1.0 to 1 |
| NET POSITION TREND: | |||
| – Strength Index Score (3 Year Range Pct): | 11.9 | 85.8 | 39.2 |
| – Strength Index Reading (3 Year Range): | Bearish-Extreme | Bullish-Extreme | Bearish |
| NET POSITION MOVEMENT INDEX: | |||
| – 6-Week Change in Strength Index: | -5.4 | 4.3 | 4.3 |
Nasdaq Mini Futures:
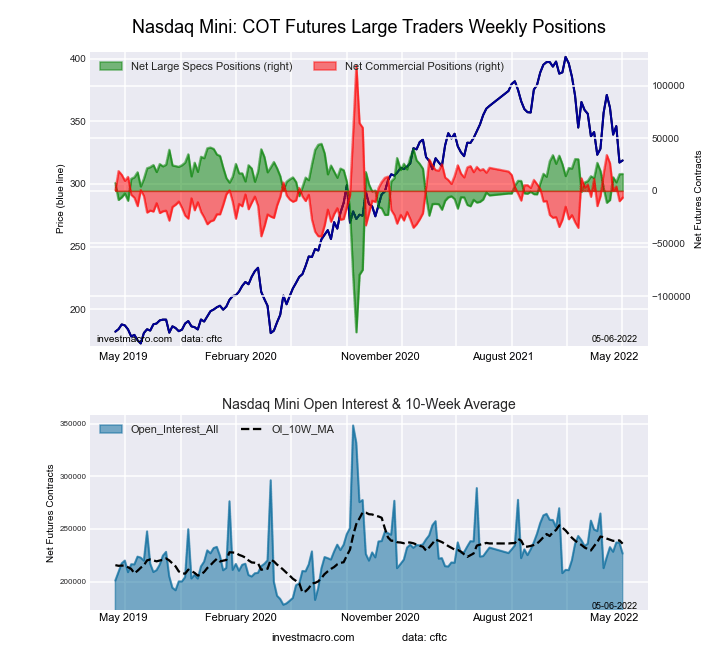 The Nasdaq Mini large speculator standing this week came in at a net position of 16,092 contracts in the data reported through Tuesday. This was a weekly boost of 259 contracts from the previous week which had a total of 15,833 net contracts.
This week’s current strength score (the trader positioning range over the past three years, measured from 0 to 100) shows the speculators are currently Bullish-Extreme with a score of 84.0 percent. The commercials are Bearish with a score of 22.6 percent and the small traders (not shown in chart) are Bearish with a score of 28.5 percent.
| Nasdaq Mini Futures Statistics | SPECULATORS | COMMERCIALS | SMALL TRADERS |
| – Percent of Open Interest Longs: | 29.6 | 54.6 | 14.2 |
| – Percent of Open Interest Shorts: | 22.5 | 57.4 | 18.5 |
| – Net Position: | 16,092 | -6,367 | -9,725 |
| – Gross Longs: | 67,077 | 123,791 | 32,176 |
| – Gross Shorts: | 50,985 | 130,158 | 41,901 |
| – Long to Short Ratio: | 1.3 to 1 | 1.0 to 1 | 0.8 to 1 |
| NET POSITION TREND: | |||
| – Strength Index Score (3 Year Range Pct): | 84.0 | 22.6 | 28.5 |
| – Strength Index Reading (3 Year Range): | Bullish-Extreme | Bearish | Bearish |
| NET POSITION MOVEMENT INDEX: | |||
| – 6-Week Change in Strength Index: | 7.4 | -14.2 | 20.1 |
Russell 2000 Mini Futures:
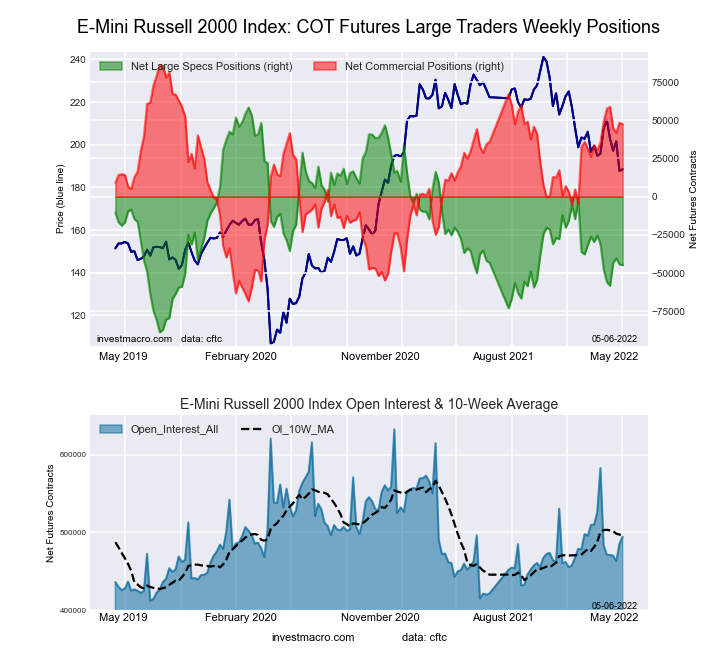 The Russell 2000 Mini large speculator standing this week came in at a net position of -44,795 contracts in the data reported through Tuesday. This was a weekly decline of -538 contracts from the previous week which had a total of -44,257 net contracts.
This week’s current strength score (the trader positioning range over the past three years, measured from 0 to 100) shows the speculators are currently Bearish with a score of 29.9 percent. The commercials are Bullish with a score of 75.0 percent and the small traders (not shown in chart) are Bearish with a score of 25.7 percent.
| Russell 2000 Mini Futures Statistics | SPECULATORS | COMMERCIALS | SMALL TRADERS |
| – Percent of Open Interest Longs: | 10.8 | 83.6 | 4.3 |
| – Percent of Open Interest Shorts: | 19.9 | 74.0 | 4.9 |
| – Net Position: | -44,795 | 47,415 | -2,620 |
| – Gross Longs: | 53,619 | 413,078 | 21,398 |
| – Gross Shorts: | 98,414 | 365,663 | 24,018 |
| – Long to Short Ratio: | 0.5 to 1 | 1.1 to 1 | 0.9 to 1 |
| NET POSITION TREND: | |||
| – Strength Index Score (3 Year Range Pct): | 29.9 | 75.0 | 25.7 |
| – Strength Index Reading (3 Year Range): | Bearish | Bullish | Bearish |
| NET POSITION MOVEMENT INDEX: | |||
| – 6-Week Change in Strength Index: | 1.8 | -0.9 | -3.6 |
Nikkei Stock Average (USD) Futures:
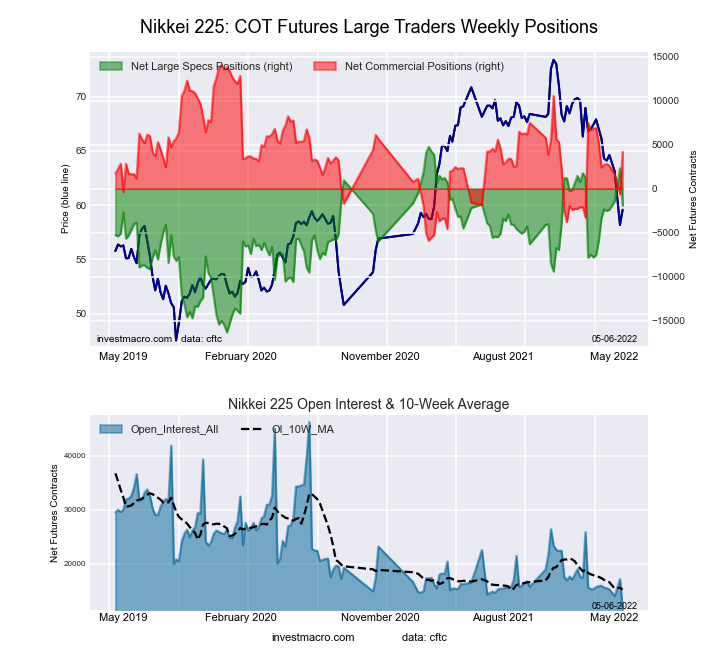 The Nikkei Stock Average (USD) large speculator standing this week came in at a net position of -1,925 contracts in the data reported through Tuesday. This was a weekly lowering of -4,249 contracts from the previous week which had a total of 2,324 net contracts.
This week’s current strength score (the trader positioning range over the past three years, measured from 0 to 100) shows the speculators are currently Bullish with a score of 68.3 percent. The commercials are Bullish with a score of 50.6 percent and the small traders (not shown in chart) are Bearish-Extreme with a score of 0.0 percent.
| Nikkei Stock Average Futures Statistics | SPECULATORS | COMMERCIALS | SMALL TRADERS |
| – Percent of Open Interest Longs: | 7.5 | 71.3 | 20.7 |
| – Percent of Open Interest Shorts: | 23.8 | 35.7 | 39.9 |
| – Net Position: | -1,925 | 4,181 | -2,256 |
| – Gross Longs: | 877 | 8,372 | 2,436 |
| – Gross Shorts: | 2,802 | 4,191 | 4,692 |
| – Long to Short Ratio: | 0.3 to 1 | 2.0 to 1 | 0.5 to 1 |
| NET POSITION TREND: | |||
| – Strength Index Score (3 Year Range Pct): | 68.3 | 50.6 | 0.0 |
| – Strength Index Reading (3 Year Range): | Bullish | Bullish | Bearish-Extreme |
| NET POSITION MOVEMENT INDEX: | |||
| – 6-Week Change in Strength Index: | 6.9 | 8.9 | -40.4 |
MSCI EAFE Mini Futures:
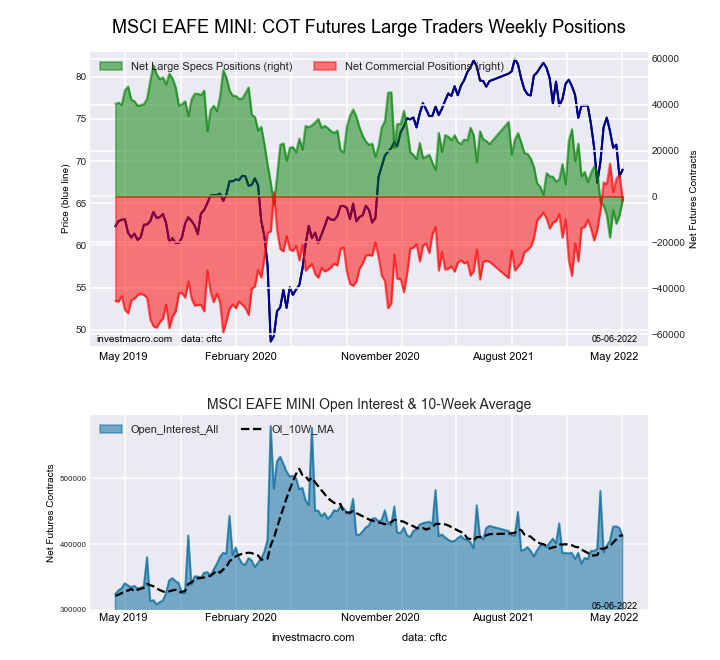 The MSCI EAFE Mini large speculator standing this week came in at a net position of -1,409 contracts in the data reported through Tuesday. This was a weekly rise of 6,851 contracts from the previous week which had a total of -8,260 net contracts.
This week’s current strength score (the trader positioning range over the past three years, measured from 0 to 100) shows the speculators are currently Bearish with a score of 21.9 percent. The commercials are Bullish with a score of 78.4 percent and the small traders (not shown in chart) are Bearish with a score of 45.3 percent.
| MSCI EAFE Mini Futures Statistics | SPECULATORS | COMMERCIALS | SMALL TRADERS |
| – Percent of Open Interest Longs: | 4.8 | 92.0 | 2.4 |
| – Percent of Open Interest Shorts: | 5.2 | 92.4 | 1.7 |
| – Net Position: | -1,409 | -1,604 | 3,013 |
| – Gross Longs: | 19,862 | 378,067 | 9,917 |
| – Gross Shorts: | 21,271 | 379,671 | 6,904 |
| – Long to Short Ratio: | 0.9 to 1 | 1.0 to 1 | 1.4 to 1 |
| NET POSITION TREND: | |||
| – Strength Index Score (3 Year Range Pct): | 21.9 | 78.4 | 45.3 |
| – Strength Index Reading (3 Year Range): | Bearish | Bullish | Bearish |
| NET POSITION MOVEMENT INDEX: | |||
| – 6-Week Change in Strength Index: | 3.4 | -10.5 | 45.3 |
Article By InvestMacro – Receive our weekly COT Reports by Email
*COT Report: The COT data, released weekly to the public each Friday, is updated through the most recent Tuesday (data is 3 days old) and shows a quick view of how large speculators or non-commercials (for-profit traders) were positioned in the futures markets.
The CFTC categorizes trader positions according to commercial hedgers (traders who use futures contracts for hedging as part of the business), non-commercials (large traders who speculate to realize trading profits) and nonreportable traders (usually small traders/speculators) as well as their open interest (contracts open in the market at time of reporting).See CFTC criteria here.

- Bitcoin rose to $66,000. The New Zealand dollar continues to strengthen Jul 22, 2026
- Inflationary pressure is easing in Canada. In New Zealand, on the contrary, inflation is rising Jul 21, 2026
- GBP/USD Falls After Cabinet Changes Jul 21, 2026
- Geopolitical and macroeconomic conditions continue to pressure market sentiment Jul 20, 2026
- USD/JPY Poised to Continue Gains as Expensive Oil and Lack of Support Weigh on Yen Jul 20, 2026
- COT Metals Charts: Weekly Speculator Bets led by Copper & Steel Jul 18, 2026
- COT Bonds Charts: Weekly Speculator Bets led by 2-Year, SOFR 3M & 5-Year Bonds Jul 18, 2026
- COT Energy Charts: Weekly Speculator Bets led by Brent Oil & Heating Oil Jul 18, 2026
- COT Soft Commodities Charts: Weekly Speculator Bets led by Wheat, Corn & Soybean Meal Jul 18, 2026
- The Bank of Canada kept its interest rate unchanged. Platinum prices reached a three‑week high Jul 16, 2026