
By InvestMacro | COT | Data Tables | COT Leaders | Downloads | COT Newsletter
Here are the latest charts and statistics for the Commitment of Traders (COT) data published by the Commodities Futures Trading Commission (CFTC).
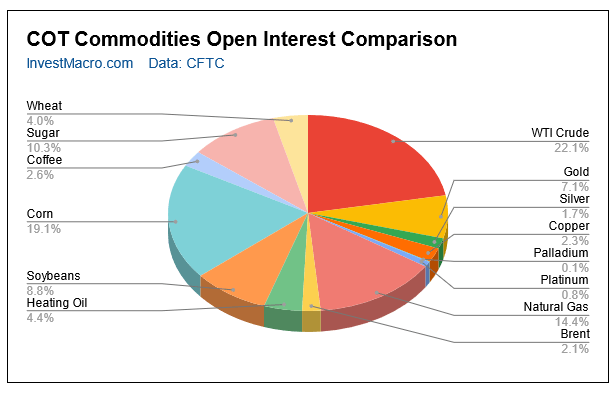
The latest COT data is updated through Tuesday May 3rd 2022 and shows a quick view of how large traders (for-profit speculators and commercial entities) were positioned in the futures markets.
The soft commodities that saw higher bets this week were Corn (4,240 contracts), Cotton (1,688 contracts) and Cocoa (11,905 contracts) while lower bets were seen in Sugar (-20,957 contracts), Coffee (-1,140 contracts), Soybeans (-13,404 contracts), Soybean Oil (-9,667 contracts), Soybean Meal (-16,734 contracts), Live Cattle (-14,313 contracts), Lean Hogs (-10,305 contracts) and Wheat (-1,638 contracts).
Free Reports:
 Download Our Metatrader 4 Indicators – Put Our Free MetaTrader 4 Custom Indicators on your charts when you join our Weekly Newsletter
 Get our Weekly Commitment of Traders Reports - See where the biggest traders (Hedge Funds and Commercial Hedgers) are positioned in the futures markets on a weekly basis.
| May-03-2022 | OI | OI-Index | Spec-Net | Spec-Index | Com-Net | COM-Index | Smalls-Net | Smalls-Index |
|---|---|---|---|---|---|---|---|---|
| WTI Crude | 1,751,564 | 2 | 321,701 | 6 | -366,213 | 94 | 44,512 | 78 |
| Gold | 560,441 | 31 | 199,168 | 42 | -231,852 | 55 | 32,684 | 57 |
| Silver | 137,692 | 5 | 28,068 | 50 | -39,317 | 60 | 11,249 | 8 |
| Copper | 185,255 | 16 | -15,623 | 31 | 10,080 | 66 | 5,543 | 57 |
| Palladium | 7,638 | 6 | -2,752 | 6 | 2,455 | 90 | 297 | 61 |
| Platinum | 66,545 | 33 | -1,541 | 1 | -3,667 | 100 | 5,208 | 35 |
| Natural Gas | 1,138,319 | 12 | -117,706 | 43 | 72,861 | 54 | 44,845 | 92 |
| Brent | 168,128 | 14 | -27,318 | 65 | 26,014 | 37 | 1,304 | 27 |
| Heating Oil | 349,618 | 31 | 6,455 | 52 | -32,434 | 37 | 25,979 | 88 |
| Soybeans | 700,856 | 22 | 190,402 | 77 | -165,353 | 27 | -25,049 | 29 |
| Corn | 1,513,880 | 23 | 501,865 | 94 | -451,210 | 8 | -50,655 | 14 |
| Coffee | 206,337 | 1 | 40,697 | 77 | -43,007 | 28 | 2,310 | 5 |
| Sugar | 818,627 | 1 | 201,592 | 78 | -236,394 | 23 | 34,802 | 51 |
| Wheat | 319,233 | 0 | 20,012 | 60 | -14,225 | 30 | -5,787 | 82 |
CORN Futures:
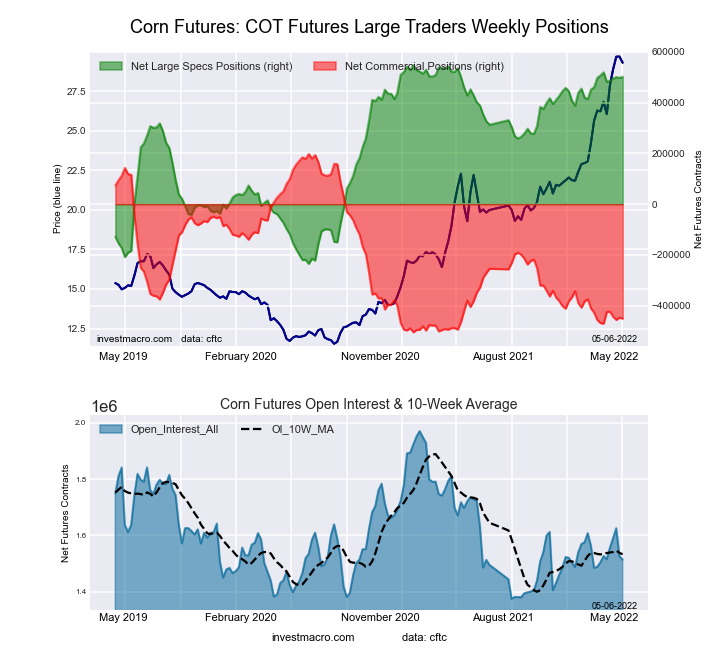 The CORN large speculator standing this week recorded a net position of 501,865 contracts in the data reported through Tuesday. This was a weekly advance of 4,240 contracts from the previous week which had a total of 497,625 net contracts.
This week’s current strength score (the trader positioning range over the past three years, measured from 0 to 100) shows the speculators are currently Bullish-Extreme with a score of 94.1 percent. The commercials are Bearish-Extreme with a score of 7.7 percent and the small traders (not shown in chart) are Bearish-Extreme with a score of 13.9 percent.
| CORN Futures Statistics | SPECULATORS | COMMERCIALS | SMALL TRADERS |
| – Percent of Open Interest Longs: | 39.0 | 42.5 | 9.3 |
| – Percent of Open Interest Shorts: | 5.8 | 72.3 | 12.6 |
| – Net Position: | 501,865 | -451,210 | -50,655 |
| – Gross Longs: | 589,856 | 642,906 | 140,438 |
| – Gross Shorts: | 87,991 | 1,094,116 | 191,093 |
| – Long to Short Ratio: | 6.7 to 1 | 0.6 to 1 | 0.7 to 1 |
| NET POSITION TREND: | |||
| – Strength Index Score (3 Year Range Pct): | 94.1 | 7.7 | 13.9 |
| – Strength Index Reading (3 Year Range): | Bullish-Extreme | Bearish-Extreme | Bearish-Extreme |
| NET POSITION MOVEMENT INDEX: | |||
| – 6-Week Change in Strength Index: | -2.2 | 2.8 | -1.2 |
SUGAR Futures:
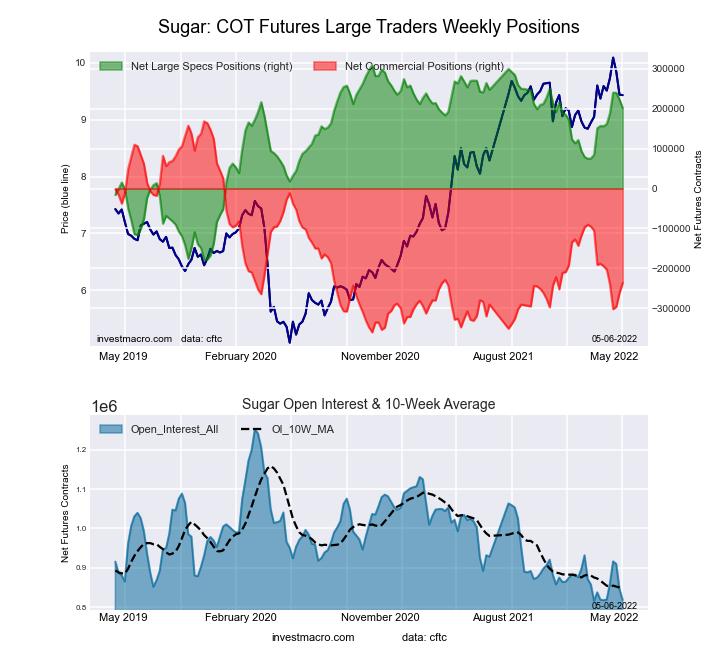 The SUGAR large speculator standing this week recorded a net position of 201,592 contracts in the data reported through Tuesday. This was a weekly lowering of -20,957 contracts from the previous week which had a total of 222,549 net contracts.
This week’s current strength score (the trader positioning range over the past three years, measured from 0 to 100) shows the speculators are currently Bullish with a score of 78.0 percent. The commercials are Bearish with a score of 23.3 percent and the small traders (not shown in chart) are Bullish with a score of 50.9 percent.
| SUGAR Futures Statistics | SPECULATORS | COMMERCIALS | SMALL TRADERS |
| – Percent of Open Interest Longs: | 32.4 | 44.8 | 10.4 |
| – Percent of Open Interest Shorts: | 7.7 | 73.7 | 6.1 |
| – Net Position: | 201,592 | -236,394 | 34,802 |
| – Gross Longs: | 264,899 | 366,584 | 85,022 |
| – Gross Shorts: | 63,307 | 602,978 | 50,220 |
| – Long to Short Ratio: | 4.2 to 1 | 0.6 to 1 | 1.7 to 1 |
| NET POSITION TREND: | |||
| – Strength Index Score (3 Year Range Pct): | 78.0 | 23.3 | 50.9 |
| – Strength Index Reading (3 Year Range): | Bullish | Bearish | Bullish |
| NET POSITION MOVEMENT INDEX: | |||
| – 6-Week Change in Strength Index: | 9.4 | -8.0 | -4.6 |
COFFEE Futures:
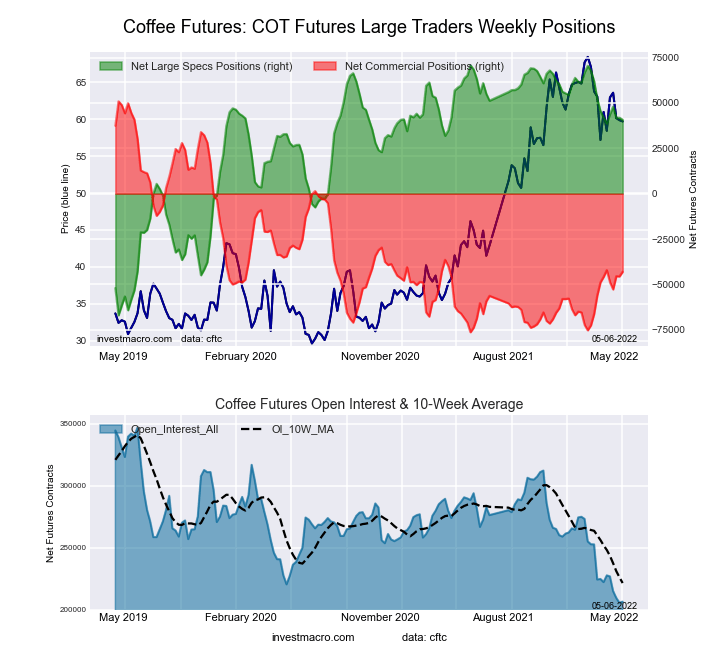 The COFFEE large speculator standing this week recorded a net position of 40,697 contracts in the data reported through Tuesday. This was a weekly fall of -1,140 contracts from the previous week which had a total of 41,837 net contracts.
This week’s current strength score (the trader positioning range over the past three years, measured from 0 to 100) shows the speculators are currently Bullish with a score of 76.7 percent. The commercials are Bearish with a score of 27.6 percent and the small traders (not shown in chart) are Bearish-Extreme with a score of 5.1 percent.
| COFFEE Futures Statistics | SPECULATORS | COMMERCIALS | SMALL TRADERS |
| – Percent of Open Interest Longs: | 25.6 | 54.1 | 4.4 |
| – Percent of Open Interest Shorts: | 5.9 | 74.9 | 3.3 |
| – Net Position: | 40,697 | -43,007 | 2,310 |
| – Gross Longs: | 52,804 | 111,613 | 9,017 |
| – Gross Shorts: | 12,107 | 154,620 | 6,707 |
| – Long to Short Ratio: | 4.4 to 1 | 0.7 to 1 | 1.3 to 1 |
| NET POSITION TREND: | |||
| – Strength Index Score (3 Year Range Pct): | 76.7 | 27.6 | 5.1 |
| – Strength Index Reading (3 Year Range): | Bullish | Bearish | Bearish-Extreme |
| NET POSITION MOVEMENT INDEX: | |||
| – 6-Week Change in Strength Index: | -0.9 | 2.3 | -13.6 |
SOYBEANS Futures:
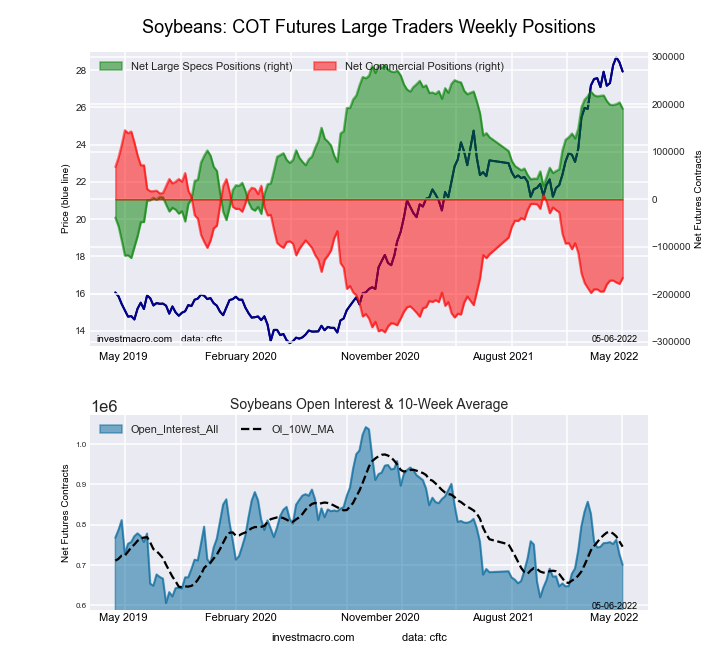 The SOYBEANS large speculator standing this week recorded a net position of 190,402 contracts in the data reported through Tuesday. This was a weekly fall of -13,404 contracts from the previous week which had a total of 203,806 net contracts.
This week’s current strength score (the trader positioning range over the past three years, measured from 0 to 100) shows the speculators are currently Bullish with a score of 77.4 percent. The commercials are Bearish with a score of 27.1 percent and the small traders (not shown in chart) are Bearish with a score of 28.7 percent.
| SOYBEANS Futures Statistics | SPECULATORS | COMMERCIALS | SMALL TRADERS |
| – Percent of Open Interest Longs: | 34.2 | 46.5 | 7.3 |
| – Percent of Open Interest Shorts: | 7.0 | 70.1 | 10.9 |
| – Net Position: | 190,402 | -165,353 | -25,049 |
| – Gross Longs: | 239,355 | 325,746 | 51,469 |
| – Gross Shorts: | 48,953 | 491,099 | 76,518 |
| – Long to Short Ratio: | 4.9 to 1 | 0.7 to 1 | 0.7 to 1 |
| NET POSITION TREND: | |||
| – Strength Index Score (3 Year Range Pct): | 77.4 | 27.1 | 28.7 |
| – Strength Index Reading (3 Year Range): | Bullish | Bearish | Bearish |
| NET POSITION MOVEMENT INDEX: | |||
| – 6-Week Change in Strength Index: | -7.0 | 6.7 | -0.1 |
SOYBEAN OIL Futures:
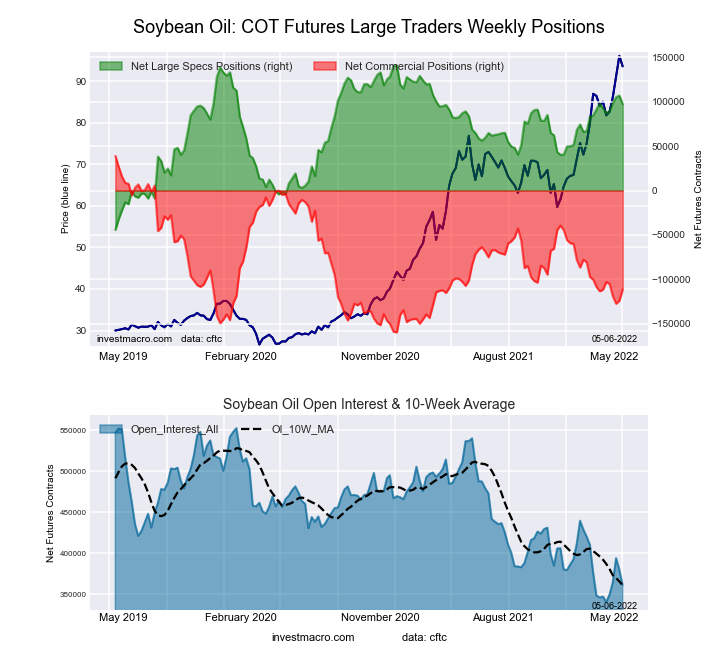 The SOYBEAN OIL large speculator standing this week recorded a net position of 97,291 contracts in the data reported through Tuesday. This was a weekly reduction of -9,667 contracts from the previous week which had a total of 106,958 net contracts.
This week’s current strength score (the trader positioning range over the past three years, measured from 0 to 100) shows the speculators are currently Bullish with a score of 76.3 percent. The commercials are Bearish with a score of 24.3 percent and the small traders (not shown in chart) are Bullish with a score of 65.6 percent.
| SOYBEAN OIL Futures Statistics | SPECULATORS | COMMERCIALS | SMALL TRADERS |
| – Percent of Open Interest Longs: | 32.1 | 46.6 | 9.8 |
| – Percent of Open Interest Shorts: | 5.2 | 77.4 | 5.9 |
| – Net Position: | 97,291 | -111,267 | 13,976 |
| – Gross Longs: | 116,132 | 168,590 | 35,309 |
| – Gross Shorts: | 18,841 | 279,857 | 21,333 |
| – Long to Short Ratio: | 6.2 to 1 | 0.6 to 1 | 1.7 to 1 |
| NET POSITION TREND: | |||
| – Strength Index Score (3 Year Range Pct): | 76.3 | 24.3 | 65.6 |
| – Strength Index Reading (3 Year Range): | Bullish | Bearish | Bullish |
| NET POSITION MOVEMENT INDEX: | |||
| – 6-Week Change in Strength Index: | 2.5 | 0.1 | -18.5 |
SOYBEAN MEAL Futures:
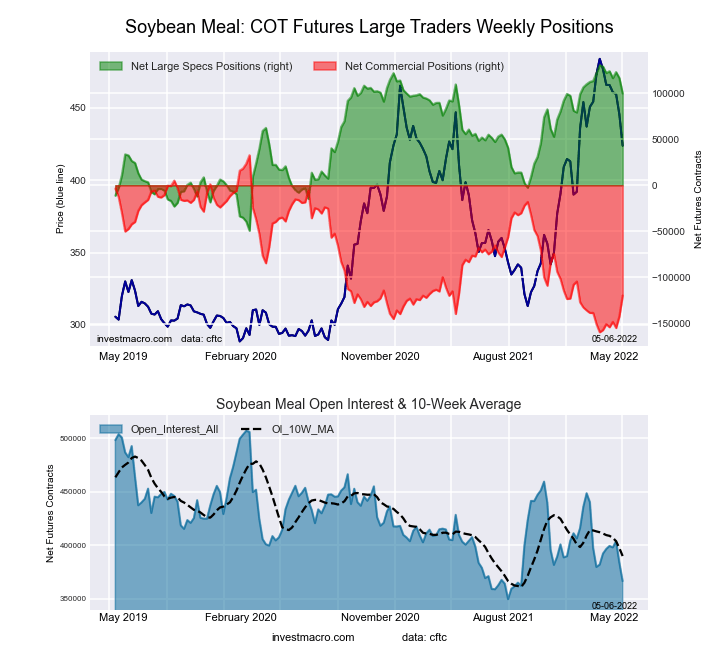 The SOYBEAN MEAL large speculator standing this week recorded a net position of 99,561 contracts in the data reported through Tuesday. This was a weekly lowering of -16,734 contracts from the previous week which had a total of 116,295 net contracts.
This week’s current strength score (the trader positioning range over the past three years, measured from 0 to 100) shows the speculators are currently Bullish-Extreme with a score of 82.9 percent. The commercials are Bearish with a score of 20.7 percent and the small traders (not shown in chart) are Bearish with a score of 38.3 percent.
| SOYBEAN MEAL Futures Statistics | SPECULATORS | COMMERCIALS | SMALL TRADERS |
| – Percent of Open Interest Longs: | 32.7 | 46.1 | 12.0 |
| – Percent of Open Interest Shorts: | 5.6 | 78.7 | 6.5 |
| – Net Position: | 99,561 | -119,714 | 20,153 |
| – Gross Longs: | 119,912 | 168,901 | 44,077 |
| – Gross Shorts: | 20,351 | 288,615 | 23,924 |
| – Long to Short Ratio: | 5.9 to 1 | 0.6 to 1 | 1.8 to 1 |
| NET POSITION TREND: | |||
| – Strength Index Score (3 Year Range Pct): | 82.9 | 20.7 | 38.3 |
| – Strength Index Reading (3 Year Range): | Bullish-Extreme | Bearish | Bearish |
| NET POSITION MOVEMENT INDEX: | |||
| – 6-Week Change in Strength Index: | -16.3 | 19.4 | -41.3 |
LIVE CATTLE Futures:

The LIVE CATTLE large speculator standing this week recorded a net position of 47,036 contracts in the data reported through Tuesday. This was a weekly reduction of -14,313 contracts from the previous week which had a total of 61,349 net contracts.
This week’s current strength score (the trader positioning range over the past three years, measured from 0 to 100) shows the speculators are currently Bearish with a score of 31.2 percent. The commercials are Bullish with a score of 64.2 percent and the small traders (not shown in chart) are Bullish with a score of 62.2 percent.
| LIVE CATTLE Futures Statistics | SPECULATORS | COMMERCIALS | SMALL TRADERS |
| – Percent of Open Interest Longs: | 36.8 | 38.5 | 9.6 |
| – Percent of Open Interest Shorts: | 21.7 | 51.9 | 11.5 |
| – Net Position: | 47,036 | -41,382 | -5,654 |
| – Gross Longs: | 114,213 | 119,484 | 29,911 |
| – Gross Shorts: | 67,177 | 160,866 | 35,565 |
| – Long to Short Ratio: | 1.7 to 1 | 0.7 to 1 | 0.8 to 1 |
| NET POSITION TREND: | |||
| – Strength Index Score (3 Year Range Pct): | 31.2 | 64.2 | 62.2 |
| – Strength Index Reading (3 Year Range): | Bearish | Bullish | Bullish |
| NET POSITION MOVEMENT INDEX: | |||
| – 6-Week Change in Strength Index: | 0.3 | -4.5 | 12.6 |
LEAN HOGS Futures:
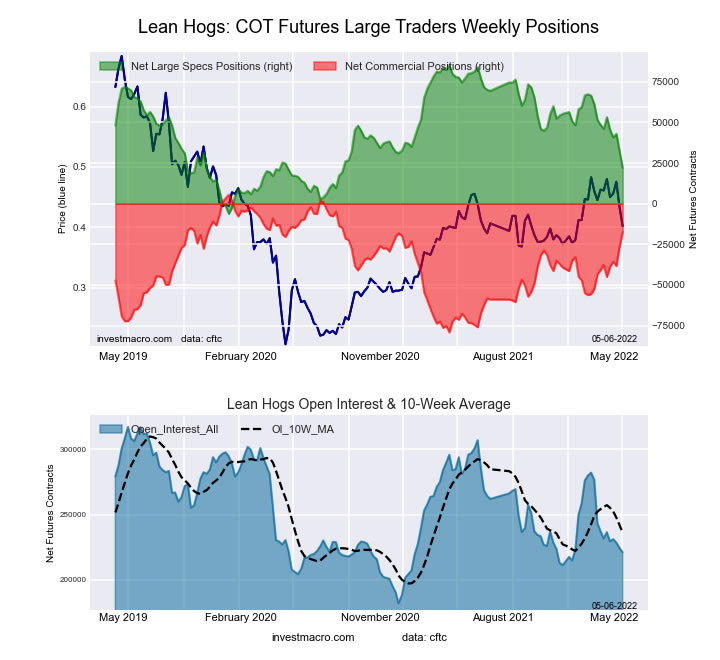
The LEAN HOGS large speculator standing this week recorded a net position of 22,031 contracts in the data reported through Tuesday. This was a weekly lowering of -10,305 contracts from the previous week which had a total of 32,336 net contracts.
This week’s current strength score (the trader positioning range over the past three years, measured from 0 to 100) shows the speculators are currently Bearish with a score of 30.7 percent. The commercials are Bullish with a score of 73.0 percent and the small traders (not shown in chart) are Bullish with a score of 72.3 percent.
| LEAN HOGS Futures Statistics | SPECULATORS | COMMERCIALS | SMALL TRADERS |
| – Percent of Open Interest Longs: | 32.1 | 37.2 | 10.0 |
| – Percent of Open Interest Shorts: | 22.2 | 45.1 | 12.1 |
| – Net Position: | 22,031 | -17,357 | -4,674 |
| – Gross Longs: | 71,110 | 82,388 | 22,152 |
| – Gross Shorts: | 49,079 | 99,745 | 26,826 |
| – Long to Short Ratio: | 1.4 to 1 | 0.8 to 1 | 0.8 to 1 |
| NET POSITION TREND: | |||
| – Strength Index Score (3 Year Range Pct): | 30.7 | 73.0 | 72.3 |
| – Strength Index Reading (3 Year Range): | Bearish | Bullish | Bullish |
| NET POSITION MOVEMENT INDEX: | |||
| – 6-Week Change in Strength Index: | -26.1 | 24.2 | 18.1 |
COTTON Futures:
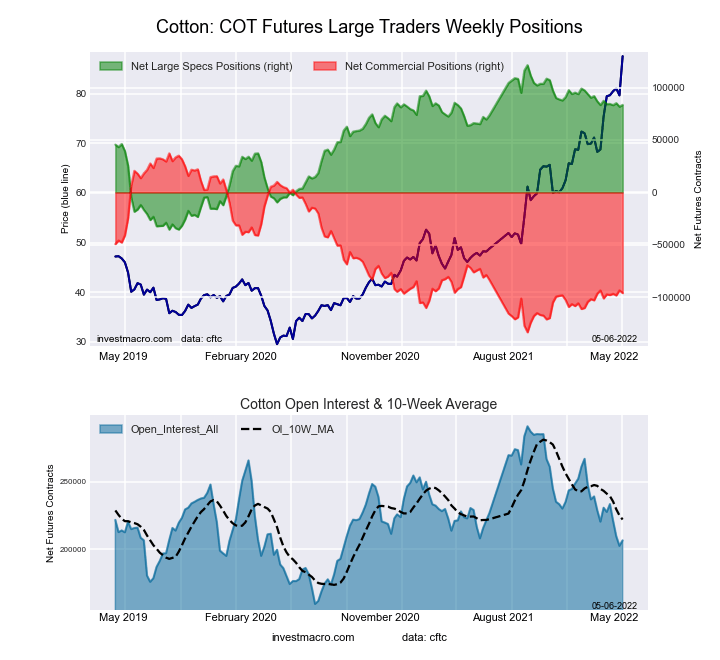 The COTTON large speculator standing this week recorded a net position of 83,433 contracts in the data reported through Tuesday. This was a weekly boost of 1,688 contracts from the previous week which had a total of 81,745 net contracts.
This week’s current strength score (the trader positioning range over the past three years, measured from 0 to 100) shows the speculators are currently Bullish with a score of 75.8 percent. The commercials are Bearish with a score of 21.9 percent and the small traders (not shown in chart) are Bullish-Extreme with a score of 91.4 percent.
| COTTON Futures Statistics | SPECULATORS | COMMERCIALS | SMALL TRADERS |
| – Percent of Open Interest Longs: | 46.2 | 34.0 | 9.3 |
| – Percent of Open Interest Shorts: | 5.8 | 80.4 | 3.3 |
| – Net Position: | 83,433 | -95,908 | 12,475 |
| – Gross Longs: | 95,320 | 70,082 | 19,238 |
| – Gross Shorts: | 11,887 | 165,990 | 6,763 |
| – Long to Short Ratio: | 8.0 to 1 | 0.4 to 1 | 2.8 to 1 |
| NET POSITION TREND: | |||
| – Strength Index Score (3 Year Range Pct): | 75.8 | 21.9 | 91.4 |
| – Strength Index Reading (3 Year Range): | Bullish | Bearish | Bullish-Extreme |
| NET POSITION MOVEMENT INDEX: | |||
| – 6-Week Change in Strength Index: | -2.5 | 3.0 | -7.4 |
COCOA Futures:
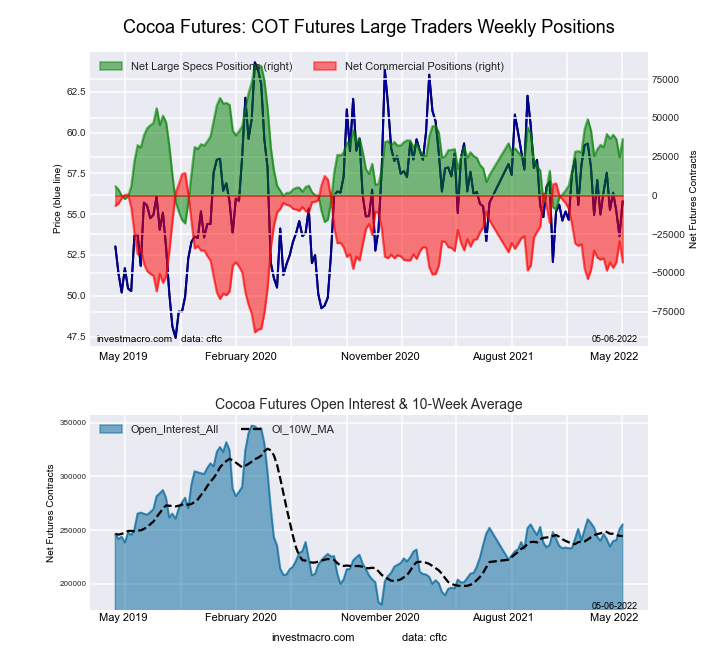 The COCOA large speculator standing this week recorded a net position of 36,559 contracts in the data reported through Tuesday. This was a weekly advance of 11,905 contracts from the previous week which had a total of 24,654 net contracts.
This week’s current strength score (the trader positioning range over the past three years, measured from 0 to 100) shows the speculators are currently Bullish with a score of 53.5 percent. The commercials are Bearish with a score of 43.8 percent and the small traders (not shown in chart) are Bullish with a score of 63.8 percent.
| COCOA Futures Statistics | SPECULATORS | COMMERCIALS | SMALL TRADERS |
| – Percent of Open Interest Longs: | 33.5 | 42.2 | 6.1 |
| – Percent of Open Interest Shorts: | 19.2 | 59.2 | 3.5 |
| – Net Position: | 36,559 | -43,277 | 6,718 |
| – Gross Longs: | 85,562 | 107,815 | 15,602 |
| – Gross Shorts: | 49,003 | 151,092 | 8,884 |
| – Long to Short Ratio: | 1.7 to 1 | 0.7 to 1 | 1.8 to 1 |
| NET POSITION TREND: | |||
| – Strength Index Score (3 Year Range Pct): | 53.5 | 43.8 | 63.8 |
| – Strength Index Reading (3 Year Range): | Bullish | Bearish | Bullish |
| NET POSITION MOVEMENT INDEX: | |||
| – 6-Week Change in Strength Index: | 5.2 | -2.7 | -26.2 |
WHEAT Futures:
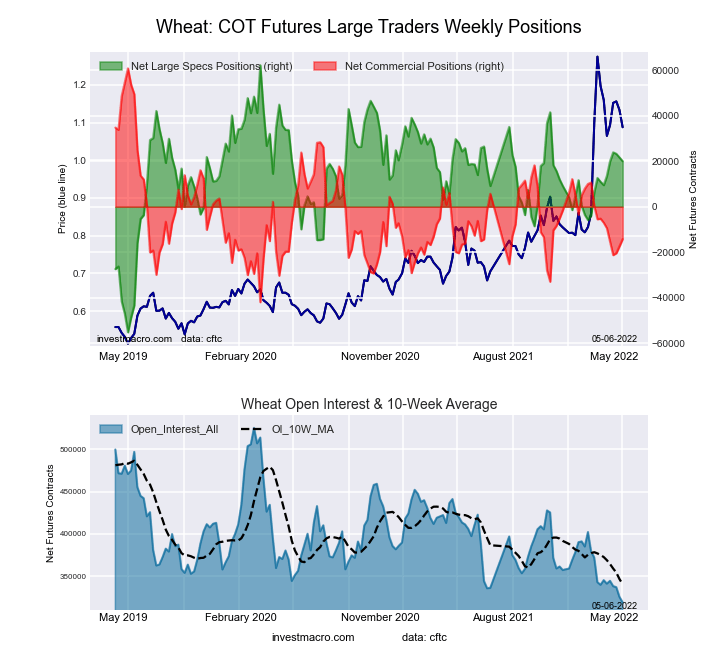 The WHEAT large speculator standing this week recorded a net position of 20,012 contracts in the data reported through Tuesday. This was a weekly reduction of -1,638 contracts from the previous week which had a total of 21,650 net contracts.
This week’s current strength score (the trader positioning range over the past three years, measured from 0 to 100) shows the speculators are currently Bullish with a score of 60.0 percent. The commercials are Bearish with a score of 30.3 percent and the small traders (not shown in chart) are Bullish-Extreme with a score of 82.3 percent.
| WHEAT Futures Statistics | SPECULATORS | COMMERCIALS | SMALL TRADERS |
| – Percent of Open Interest Longs: | 34.9 | 38.8 | 8.6 |
| – Percent of Open Interest Shorts: | 28.6 | 43.3 | 10.4 |
| – Net Position: | 20,012 | -14,225 | -5,787 |
| – Gross Longs: | 111,438 | 124,006 | 27,445 |
| – Gross Shorts: | 91,426 | 138,231 | 33,232 |
| – Long to Short Ratio: | 1.2 to 1 | 0.9 to 1 | 0.8 to 1 |
| NET POSITION TREND: | |||
| – Strength Index Score (3 Year Range Pct): | 60.0 | 30.3 | 82.3 |
| – Strength Index Reading (3 Year Range): | Bullish | Bearish | Bullish-Extreme |
| NET POSITION MOVEMENT INDEX: | |||
| – 6-Week Change in Strength Index: | 10.0 | -7.9 | -17.7 |
Article By InvestMacro – Receive our weekly COT Reports by Email
*COT Report: The COT data, released weekly to the public each Friday, is updated through the most recent Tuesday (data is 3 days old) and shows a quick view of how large speculators or non-commercials (for-profit traders) were positioned in the futures markets.
The CFTC categorizes trader positions according to commercial hedgers (traders who use futures contracts for hedging as part of the business), non-commercials (large traders who speculate to realize trading profits) and nonreportable traders (usually small traders/speculators) as well as their open interest (contracts open in the market at time of reporting).See CFTC criteria here.

- Oil prices reached a 6‑week high. The AUD strengthened on the back of a strong labor‑market report Jul 23, 2026
- EUR/USD Recovers as Dollar Weakens Jul 23, 2026
- Bitcoin rose to $66,000. The New Zealand dollar continues to strengthen Jul 22, 2026
- Inflationary pressure is easing in Canada. In New Zealand, on the contrary, inflation is rising Jul 21, 2026
- GBP/USD Falls After Cabinet Changes Jul 21, 2026
- Geopolitical and macroeconomic conditions continue to pressure market sentiment Jul 20, 2026
- USD/JPY Poised to Continue Gains as Expensive Oil and Lack of Support Weigh on Yen Jul 20, 2026
- COT Metals Charts: Weekly Speculator Bets led by Copper & Steel Jul 18, 2026
- COT Bonds Charts: Weekly Speculator Bets led by 2-Year, SOFR 3M & 5-Year Bonds Jul 18, 2026
- COT Energy Charts: Weekly Speculator Bets led by Brent Oil & Heating Oil Jul 18, 2026