
By InvestMacro | COT | Data Tables | COT Leaders | Downloads | COT Newsletter
Here are the latest charts and statistics for the Commitment of Traders (COT) data published by the Commodities Futures Trading Commission (CFTC).
The latest COT data is updated through Tuesday May 3rd 2022 and shows a quick view of how large traders (for-profit speculators and commercial entities) were positioned in the futures markets.
The bond markets with higher speculator bets this week were the Eurodollar (85,554 contracts) and the Ultra US Bond (24,875 contracts).
The bond markets with lower speculator bets this week were the 2-Year Bond (-39,648 contracts), 10-Year Bond (-29,720 contracts), Ultra 10-Year (-40,831 contracts), Long US Bond (-6,588 contracts), Fed Funds (-94,206 contracts) and the 5-Year Bond (-44,787 contracts).
Free Reports:
 Sign Up for Our Stock Market Newsletter – Get updated on News, Charts & Rankings of Public Companies when you join our Stocks Newsletter
 Get our Weekly Commitment of Traders Reports - See where the biggest traders (Hedge Funds and Commercial Hedgers) are positioned in the futures markets on a weekly basis.
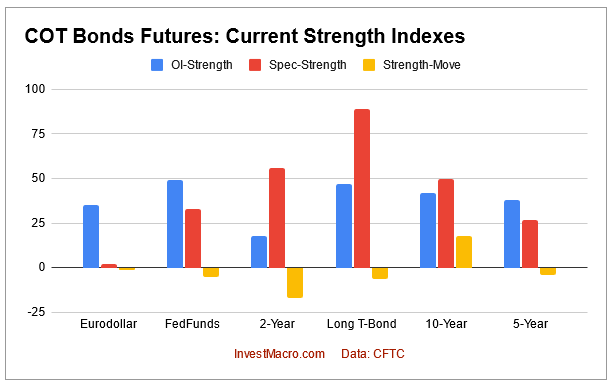
Speculator strength standings for each Bond where strength index is current net position compared to past three years, above 80 is bullish extreme, below 20 is bearish extreme OI Strength = Current Open Interest level compared to last 3 years range Spec Strength = Current Net Speculator level compared to last 3 years range Strength Move = Six week change of Spec Strength
| May-03-2022 | OI | OI-Index | Spec-Net | Spec-Index | Com-Net | COM-Index | Smalls-Net | Smalls-Index |
|---|---|---|---|---|---|---|---|---|
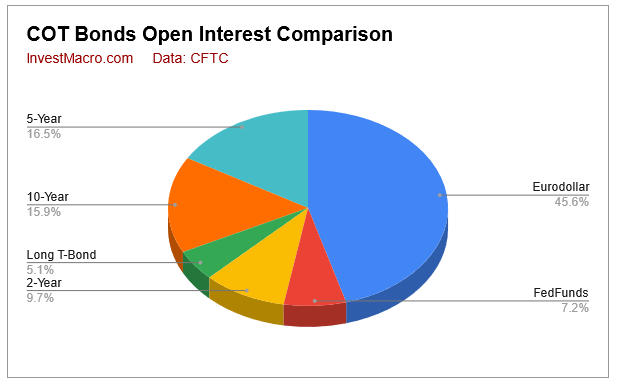
| Eurodollar | 10,548,844 | 35 | -2,688,108 | 2 | 3,107,103 | 98 | -418,995 | 12 |
| FedFunds | 1,662,069 | 49 | -55,253 | 33 | 60,532 | 67 | -5,279 | 46 |
| 2-Year | 2,232,148 | 18 | -129,171 | 56 | 245,745 | 74 | -116,574 | 0 |
| Long T-Bond | 1,187,151 | 47 | 13,511 | 89 | 5,068 | 22 | -18,579 | 38 |
| 10-Year | 3,680,764 | 42 | -147,537 | 50 | 313,344 | 59 | -165,807 | 40 |
| 5-Year | 3,818,836 | 38 | -318,936 | 27 | 509,720 | 75 | -190,784 | 29 |
3-Month Eurodollars Futures:
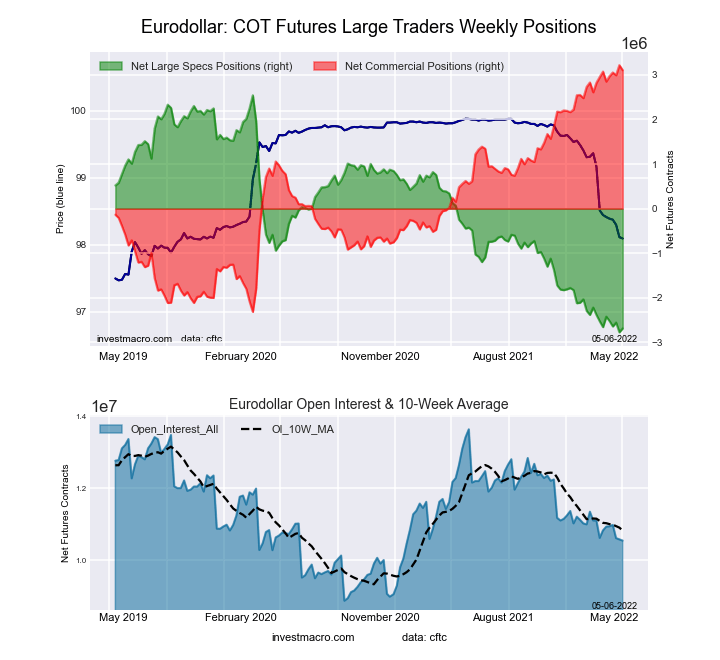
The 3-Month Eurodollars large speculator standing this week totaled a net position of -2,688,108 contracts in the data reported through Tuesday. This was a weekly gain of 85,554 contracts from the previous week which had a total of -2,773,662 net contracts.
This week’s current strength score (the trader positioning range over the past three years, measured from 0 to 100) shows the speculators are currently Bearish-Extreme with a score of 1.6 percent. The commercials are Bullish-Extreme with a score of 98.0 percent and the small traders (not shown in chart) are Bearish-Extreme with a score of 12.2 percent.
| 3-Month Eurodollars Statistics | SPECULATORS | COMMERCIALS | SMALL TRADERS |
| – Percent of Open Interest Longs: | 3.4 | 74.6 | 4.0 |
| – Percent of Open Interest Shorts: | 28.9 | 45.1 | 8.0 |
| – Net Position: | -2,688,108 | 3,107,103 | -418,995 |
| – Gross Longs: | 357,697 | 7,864,603 | 420,867 |
| – Gross Shorts: | 3,045,805 | 4,757,500 | 839,862 |
| – Long to Short Ratio: | 0.1 to 1 | 1.7 to 1 | 0.5 to 1 |
| NET POSITION TREND: | |||
| – Strength Index Score (3 Year Range Pct): | 1.6 | 98.0 | 12.2 |
| – Strength Index Reading (3 Year Range): | Bearish-Extreme | Bullish-Extreme | Bearish-Extreme |
| NET POSITION MOVEMENT INDEX: | |||
| – 6-Week Change in Strength Index: | -0.6 | 0.6 | -0.3 |
30-Day Federal Funds Futures:
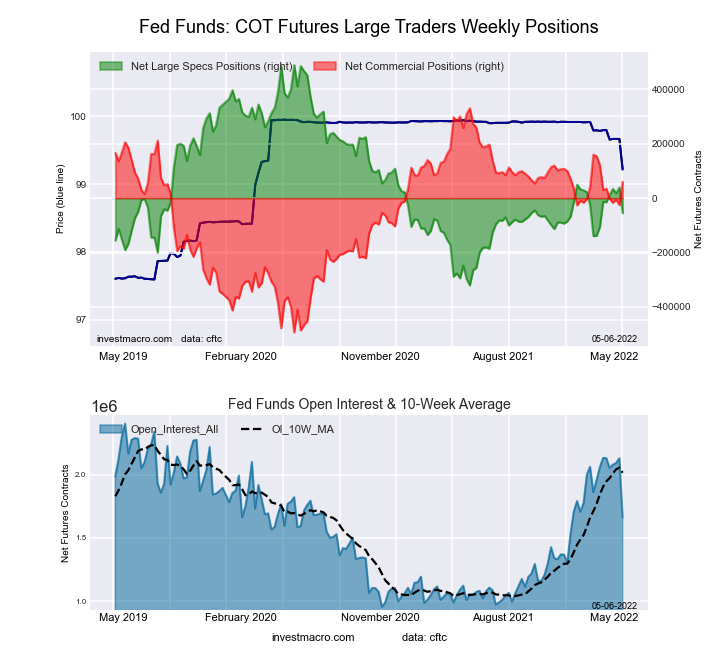 The 30-Day Federal Funds large speculator standing this week totaled a net position of -55,253 contracts in the data reported through Tuesday. This was a weekly fall of -94,206 contracts from the previous week which had a total of 38,953 net contracts.
This week’s current strength score (the trader positioning range over the past three years, measured from 0 to 100) shows the speculators are currently Bearish with a score of 32.8 percent. The commercials are Bullish with a score of 67.2 percent and the small traders (not shown in chart) are Bearish with a score of 46.3 percent.
| 30-Day Federal Funds Statistics | SPECULATORS | COMMERCIALS | SMALL TRADERS |
| – Percent of Open Interest Longs: | 1.5 | 80.2 | 2.0 |
| – Percent of Open Interest Shorts: | 4.8 | 76.5 | 2.3 |
| – Net Position: | -55,253 | 60,532 | -5,279 |
| – Gross Longs: | 24,608 | 1,332,707 | 32,724 |
| – Gross Shorts: | 79,861 | 1,272,175 | 38,003 |
| – Long to Short Ratio: | 0.3 to 1 | 1.0 to 1 | 0.9 to 1 |
| NET POSITION TREND: | |||
| – Strength Index Score (3 Year Range Pct): | 32.8 | 67.2 | 46.3 |
| – Strength Index Reading (3 Year Range): | Bearish | Bullish | Bearish |
| NET POSITION MOVEMENT INDEX: | |||
| – 6-Week Change in Strength Index: | -5.2 | 3.7 | 28.0 |
2-Year Treasury Note Futures:
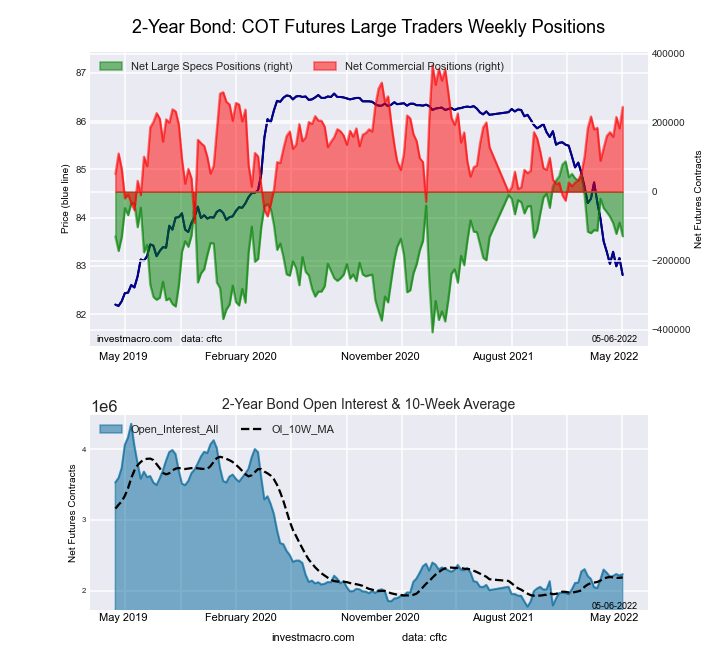 The 2-Year Treasury Note large speculator standing this week totaled a net position of -129,171 contracts in the data reported through Tuesday. This was a weekly decrease of -39,648 contracts from the previous week which had a total of -89,523 net contracts.
This week’s current strength score (the trader positioning range over the past three years, measured from 0 to 100) shows the speculators are currently Bullish with a score of 56.2 percent. The commercials are Bullish with a score of 73.6 percent and the small traders (not shown in chart) are Bearish-Extreme with a score of 0.0 percent.
| 2-Year Treasury Note Statistics | SPECULATORS | COMMERCIALS | SMALL TRADERS |
| – Percent of Open Interest Longs: | 13.5 | 76.5 | 6.0 |
| – Percent of Open Interest Shorts: | 19.3 | 65.5 | 11.2 |
| – Net Position: | -129,171 | 245,745 | -116,574 |
| – Gross Longs: | 301,359 | 1,708,203 | 133,733 |
| – Gross Shorts: | 430,530 | 1,462,458 | 250,307 |
| – Long to Short Ratio: | 0.7 to 1 | 1.2 to 1 | 0.5 to 1 |
| NET POSITION TREND: | |||
| – Strength Index Score (3 Year Range Pct): | 56.2 | 73.6 | 0.0 |
| – Strength Index Reading (3 Year Range): | Bullish | Bullish | Bearish-Extreme |
| NET POSITION MOVEMENT INDEX: | |||
| – 6-Week Change in Strength Index: | -16.5 | 26.1 | -15.6 |
5-Year Treasury Note Futures:
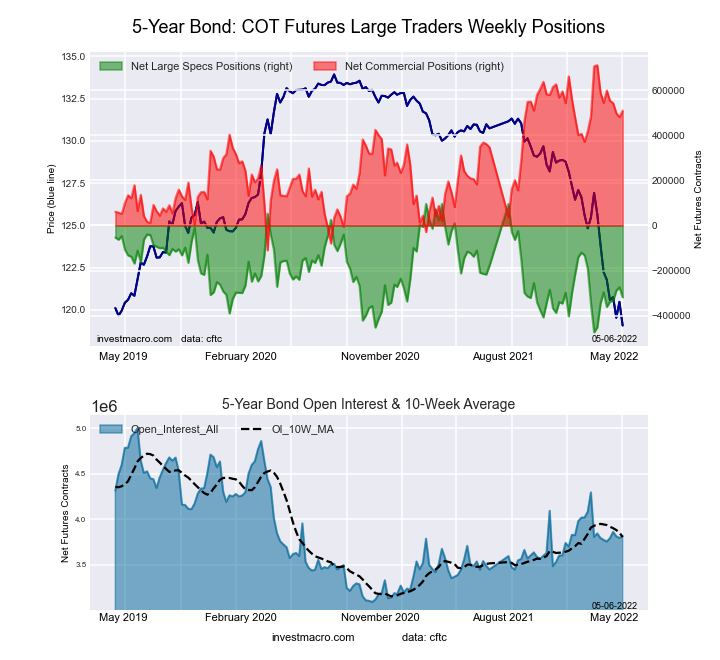 The 5-Year Treasury Note large speculator standing this week totaled a net position of -318,936 contracts in the data reported through Tuesday. This was a weekly decrease of -44,787 contracts from the previous week which had a total of -274,149 net contracts.
This week’s current strength score (the trader positioning range over the past three years, measured from 0 to 100) shows the speculators are currently Bearish with a score of 27.2 percent. The commercials are Bullish with a score of 75.4 percent and the small traders (not shown in chart) are Bearish with a score of 28.6 percent.
| 5-Year Treasury Note Statistics | SPECULATORS | COMMERCIALS | SMALL TRADERS |
| – Percent of Open Interest Longs: | 7.7 | 83.2 | 6.9 |
| – Percent of Open Interest Shorts: | 16.0 | 69.9 | 11.9 |
| – Net Position: | -318,936 | 509,720 | -190,784 |
| – Gross Longs: | 293,082 | 3,178,614 | 262,964 |
| – Gross Shorts: | 612,018 | 2,668,894 | 453,748 |
| – Long to Short Ratio: | 0.5 to 1 | 1.2 to 1 | 0.6 to 1 |
| NET POSITION TREND: | |||
| – Strength Index Score (3 Year Range Pct): | 27.2 | 75.4 | 28.6 |
| – Strength Index Reading (3 Year Range): | Bearish | Bullish | Bearish |
| NET POSITION MOVEMENT INDEX: | |||
| – 6-Week Change in Strength Index: | -4.0 | -4.2 | 15.7 |
10-Year Treasury Note Futures:
 The 10-Year Treasury Note large speculator standing this week totaled a net position of -147,537 contracts in the data reported through Tuesday. This was a weekly lowering of -29,720 contracts from the previous week which had a total of -117,817 net contracts.
This week’s current strength score (the trader positioning range over the past three years, measured from 0 to 100) shows the speculators are currently Bullish with a score of 50.0 percent. The commercials are Bullish with a score of 59.1 percent and the small traders (not shown in chart) are Bearish with a score of 40.0 percent.
| 10-Year Treasury Note Statistics | SPECULATORS | COMMERCIALS | SMALL TRADERS |
| – Percent of Open Interest Longs: | 10.6 | 77.5 | 8.9 |
| – Percent of Open Interest Shorts: | 14.6 | 69.0 | 13.4 |
| – Net Position: | -147,537 | 313,344 | -165,807 |
| – Gross Longs: | 391,455 | 2,853,366 | 325,869 |
| – Gross Shorts: | 538,992 | 2,540,022 | 491,676 |
| – Long to Short Ratio: | 0.7 to 1 | 1.1 to 1 | 0.7 to 1 |
| NET POSITION TREND: | |||
| – Strength Index Score (3 Year Range Pct): | 50.0 | 59.1 | 40.0 |
| – Strength Index Reading (3 Year Range): | Bullish | Bullish | Bearish |
| NET POSITION MOVEMENT INDEX: | |||
| – 6-Week Change in Strength Index: | 17.7 | -17.9 | 8.1 |
Ultra 10-Year Notes Futures:
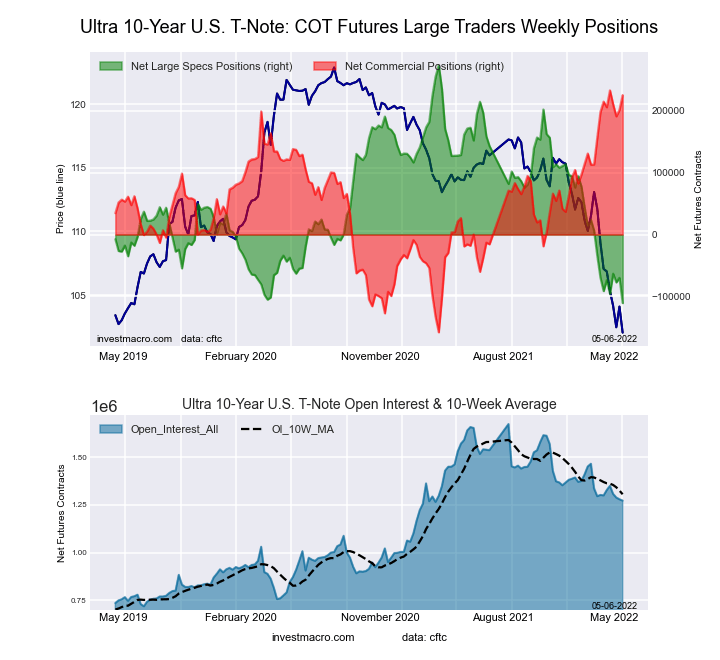 The Ultra 10-Year Notes large speculator standing this week totaled a net position of -110,718 contracts in the data reported through Tuesday. This was a weekly decrease of -40,831 contracts from the previous week which had a total of -69,887 net contracts.
This week’s current strength score (the trader positioning range over the past three years, measured from 0 to 100) shows the speculators are currently Bearish-Extreme with a score of 0.0 percent. The commercials are Bullish-Extreme with a score of 98.1 percent and the small traders (not shown in chart) are Bearish with a score of 46.9 percent.
| Ultra 10-Year Notes Statistics | SPECULATORS | COMMERCIALS | SMALL TRADERS |
| – Percent of Open Interest Longs: | 4.8 | 83.3 | 10.8 |
| – Percent of Open Interest Shorts: | 13.5 | 65.6 | 19.8 |
| – Net Position: | -110,718 | 225,309 | -114,591 |
| – Gross Longs: | 60,984 | 1,060,049 | 136,897 |
| – Gross Shorts: | 171,702 | 834,740 | 251,488 |
| – Long to Short Ratio: | 0.4 to 1 | 1.3 to 1 | 0.5 to 1 |
| NET POSITION TREND: | |||
| – Strength Index Score (3 Year Range Pct): | 0.0 | 98.1 | 46.9 |
| – Strength Index Reading (3 Year Range): | Bearish-Extreme | Bullish-Extreme | Bearish |
| NET POSITION MOVEMENT INDEX: | |||
| – 6-Week Change in Strength Index: | -5.0 | 2.7 | 5.3 |
US Treasury Bonds Futures:
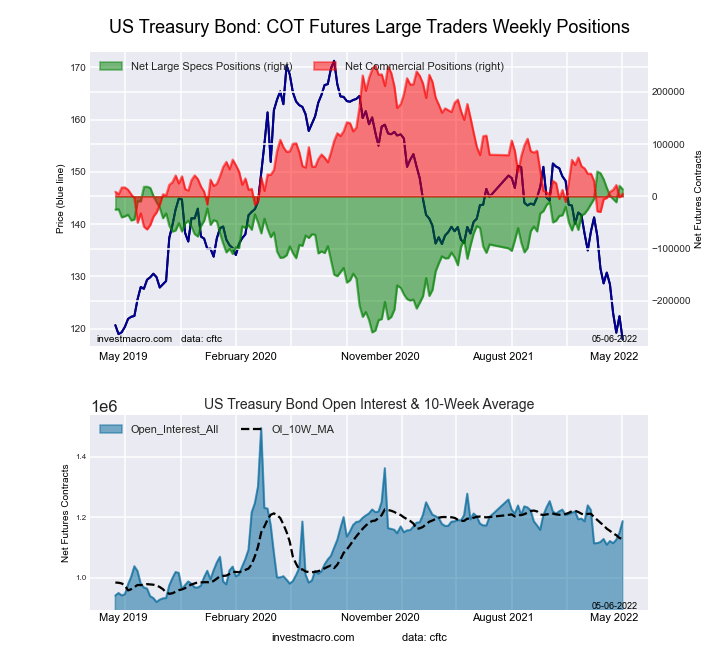 The US Treasury Bonds large speculator standing this week totaled a net position of 13,511 contracts in the data reported through Tuesday. This was a weekly decline of -6,588 contracts from the previous week which had a total of 20,099 net contracts.
This week’s current strength score (the trader positioning range over the past three years, measured from 0 to 100) shows the speculators are currently Bullish-Extreme with a score of 89.0 percent. The commercials are Bearish with a score of 21.7 percent and the small traders (not shown in chart) are Bearish with a score of 37.8 percent.
| US Treasury Bonds Statistics | SPECULATORS | COMMERCIALS | SMALL TRADERS |
| – Percent of Open Interest Longs: | 11.0 | 72.8 | 13.1 |
| – Percent of Open Interest Shorts: | 9.8 | 72.4 | 14.7 |
| – Net Position: | 13,511 | 5,068 | -18,579 |
| – Gross Longs: | 130,124 | 864,328 | 155,544 |
| – Gross Shorts: | 116,613 | 859,260 | 174,123 |
| – Long to Short Ratio: | 1.1 to 1 | 1.0 to 1 | 0.9 to 1 |
| NET POSITION TREND: | |||
| – Strength Index Score (3 Year Range Pct): | 89.0 | 21.7 | 37.8 |
| – Strength Index Reading (3 Year Range): | Bullish-Extreme | Bearish | Bearish |
| NET POSITION MOVEMENT INDEX: | |||
| – 6-Week Change in Strength Index: | -6.2 | 3.3 | 6.8 |
Ultra US Treasury Bonds Futures:
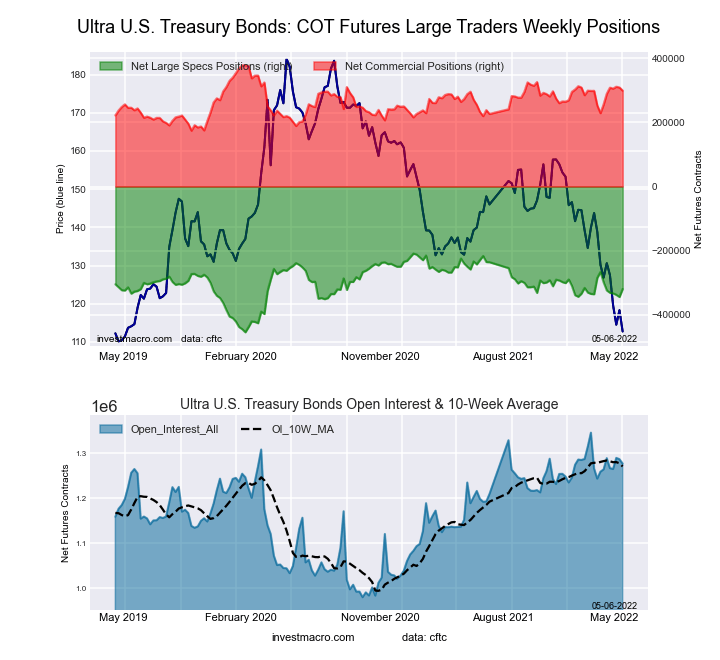 The Ultra US Treasury Bonds large speculator standing this week totaled a net position of -319,179 contracts in the data reported through Tuesday. This was a weekly lift of 24,875 contracts from the previous week which had a total of -344,054 net contracts.
This week’s current strength score (the trader positioning range over the past three years, measured from 0 to 100) shows the speculators are currently Bullish with a score of 55.0 percent. The commercials are Bullish with a score of 61.2 percent and the small traders (not shown in chart) are Bearish with a score of 42.9 percent.
| Ultra US Treasury Bonds Statistics | SPECULATORS | COMMERCIALS | SMALL TRADERS |
| – Percent of Open Interest Longs: | 3.4 | 84.1 | 11.7 |
| – Percent of Open Interest Shorts: | 28.4 | 60.7 | 10.1 |
| – Net Position: | -319,179 | 298,805 | 20,374 |
| – Gross Longs: | 43,517 | 1,073,810 | 148,944 |
| – Gross Shorts: | 362,696 | 775,005 | 128,570 |
| – Long to Short Ratio: | 0.1 to 1 | 1.4 to 1 | 1.2 to 1 |
| NET POSITION TREND: | |||
| – Strength Index Score (3 Year Range Pct): | 55.0 | 61.2 | 42.9 |
| – Strength Index Reading (3 Year Range): | Bullish | Bullish | Bearish |
| NET POSITION MOVEMENT INDEX: | |||
| – 6-Week Change in Strength Index: | -8.4 | 21.2 | -16.2 |
Article By InvestMacro – Receive our weekly COT Reports by Email
*COT Report: The COT data, released weekly to the public each Friday, is updated through the most recent Tuesday (data is 3 days old) and shows a quick view of how large speculators or non-commercials (for-profit traders) were positioned in the futures markets.
The CFTC categorizes trader positions according to commercial hedgers (traders who use futures contracts for hedging as part of the business), non-commercials (large traders who speculate to realize trading profits) and nonreportable traders (usually small traders/speculators) as well as their open interest (contracts open in the market at time of reporting).See CFTC criteria here.

- Geopolitical and macroeconomic conditions continue to pressure market sentiment Jul 20, 2026
- USD/JPY Poised to Continue Gains as Expensive Oil and Lack of Support Weigh on Yen Jul 20, 2026
- COT Metals Charts: Weekly Speculator Bets led by Copper & Steel Jul 18, 2026
- COT Bonds Charts: Weekly Speculator Bets led by 2-Year, SOFR 3M & 5-Year Bonds Jul 18, 2026
- COT Energy Charts: Weekly Speculator Bets led by Brent Oil & Heating Oil Jul 18, 2026
- COT Soft Commodities Charts: Weekly Speculator Bets led by Wheat, Corn & Soybean Meal Jul 18, 2026
- The Bank of Canada kept its interest rate unchanged. Platinum prices reached a three‑week high Jul 16, 2026
- Stock indices rose after the release of US inflation data. China’s GDP slowed sharply Jul 15, 2026
- GBP/USD Awaits Political News: What Will Happen Next Jul 15, 2026
- USD/JPY Holds at Highs: Pressure Lingers on Yen Jul 14, 2026