
By InvestMacro | COT | Data Tables | COT Leaders | Downloads | COT Newsletter
Here are the latest charts and statistics for the Commitment of Traders (COT) data published by the Commodities Futures Trading Commission (CFTC).
The latest COT data is updated through Tuesday March 29th and shows a quick view of how large traders (for-profit speculators and commercial entities) were positioned in the futures markets.
Highlighting the COT metals data is the recent gains in the Copper futures bets. The speculative net position in the Copper futures has risen for two consecutive weeks and three times in the past four weeks with a total increase by +8,488 contracts over the past four weeks. The recent strength in speculator bets has pushed the current speculator standing back over the +30,000 net contract level for the third time in the past seven weeks following fourteen weeks where spec bets remained below that threshold. Copper bets had hit an 81-week low in late December and had four weeks with speculator bets below the +10,000 contract level at that time. The new year has seen speculators start to increase their sentiment in favor of the red metal and Copper speculator position has now averaged over +23,500 net contracts each week since January 1st. This is down from the 2021 average of 33,688 weekly contracts but above the 2020 average of 20,214 weekly contracts. The Copper price has also had a bullish start to the year with Copper futures currently trading at 4.68 compared to the 4.46 price to start the year.
The metals markets that saw higher speculator bets this week were Silver (293 contracts), Gold (9,564 contracts) and Copper (3,769 contracts).
The metals markets that saw lower speculator bets this week were Platinum (-5,814 contracts) and Palladium (-803 contracts).
Free Reports:
 Get our Weekly Commitment of Traders Reports - See where the biggest traders (Hedge Funds and Commercial Hedgers) are positioned in the futures markets on a weekly basis.
 Sign Up for Our Stock Market Newsletter – Get updated on News, Charts & Rankings of Public Companies when you join our Stocks Newsletter
| Mar-29-2022 | OI | OI-Index | Spec-Net | Spec-Index | Com-Net | COM-Index | Smalls-Net | Smalls-Index |
|---|---|---|---|---|---|---|---|---|
| WTI Crude | 1,795,929 | 1 | 318,731 | 0 | -360,162 | 99 | 41,431 | 73 |
| Gold | 574,521 | 39 | 257,596 | 70 | -285,937 | 30 | 28,341 | 45 |
| Silver | 147,370 | 14 | 48,240 | 70 | -61,372 | 39 | 13,132 | 19 |
| Copper | 203,692 | 29 | 30,581 | 64 | -37,333 | 34 | 6,752 | 64 |
| Palladium | 6,720 | 1 | -2,011 | 10 | 1,364 | 84 | 647 | 81 |
| Platinum | 61,807 | 25 | 14,001 | 22 | -20,754 | 79 | 6,753 | 56 |
| Natural Gas | 1,100,690 | 4 | -137,411 | 37 | 92,762 | 60 | 44,649 | 92 |
| Brent | 188,542 | 30 | -25,220 | 69 | 21,609 | 29 | 3,611 | 58 |
| Heating Oil | 349,618 | 31 | 6,455 | 52 | -32,434 | 37 | 25,979 | 88 |
| Soybeans | 755,139 | 34 | 206,469 | 81 | -178,764 | 24 | -27,705 | 24 |
| Corn | 1,515,106 | 24 | 482,092 | 92 | -424,699 | 11 | -57,393 | 10 |
| Coffee | 227,547 | 6 | 38,689 | 77 | -42,092 | 27 | 3,403 | 12 |
| Sugar | 819,459 | 1 | 161,581 | 70 | -202,758 | 30 | 41,177 | 59 |
| Wheat | 341,224 | 3 | 13,559 | 59 | -9,435 | 32 | -4,124 | 91 |
Gold Comex Futures:
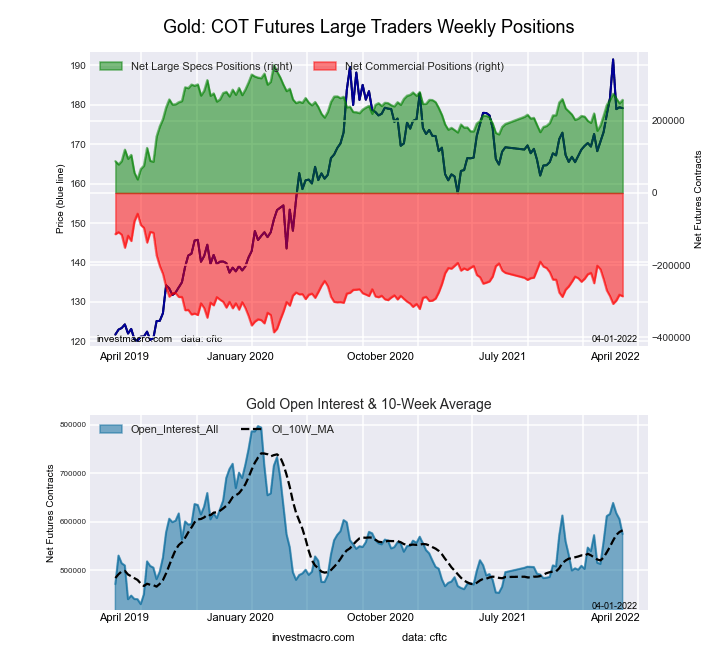 The Gold Comex Futures large speculator standing this week resulted in a net position of 257,596 contracts in the data reported through Tuesday. This was a weekly rise of 9,564 contracts from the previous week which had a total of 248,032 net contracts.
This week’s current strength score (the trader positioning range over the past three years, measured from 0 to 100) shows the speculators are currently Bullish with a score of 69.6 percent. The commercials are Bearish with a score of 30.4 percent and the small traders (not shown in chart) are Bearish with a score of 44.6 percent.
| Gold Futures Statistics | SPECULATORS | COMMERCIALS | SMALL TRADERS |
| – Percent of Open Interest Longs: | 57.0 | 23.2 | 8.5 |
| – Percent of Open Interest Shorts: | 12.2 | 72.9 | 3.6 |
| – Net Position: | 257,596 | -285,937 | 28,341 |
| – Gross Longs: | 327,632 | 133,050 | 49,022 |
| – Gross Shorts: | 70,036 | 418,987 | 20,681 |
| – Long to Short Ratio: | 4.7 to 1 | 0.3 to 1 | 2.4 to 1 |
| NET POSITION TREND: | |||
| – Strength Index Score (3 Year Range Pct): | 69.6 | 30.4 | 44.6 |
| – Strength Index Reading (3 Year Range): | Bullish | Bearish | Bearish |
| NET POSITION MOVEMENT INDEX: | |||
| – 6-Week Change in Strength Index: | 13.9 | -14.3 | 8.8 |
Silver Comex Futures:
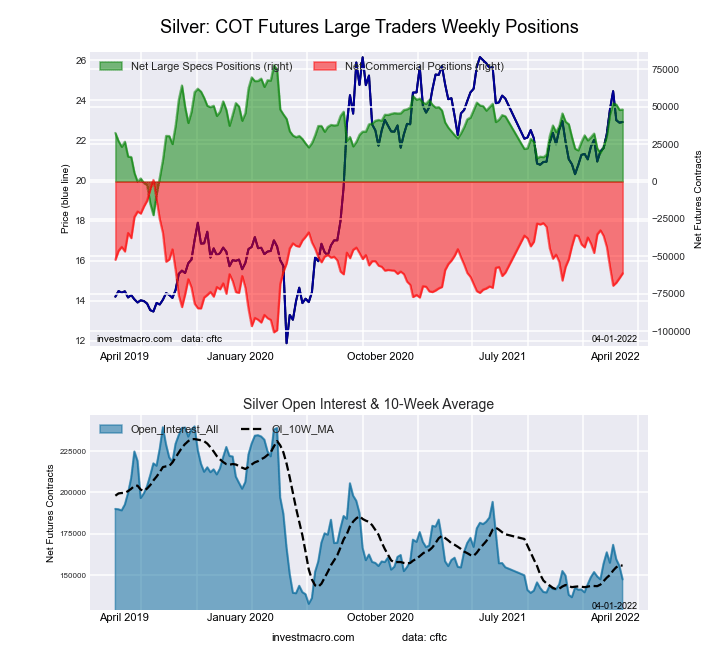 The Silver Comex Futures large speculator standing this week resulted in a net position of 48,240 contracts in the data reported through Tuesday. This was a weekly gain of 293 contracts from the previous week which had a total of 47,947 net contracts.
This week’s current strength score (the trader positioning range over the past three years, measured from 0 to 100) shows the speculators are currently Bullish with a score of 70.4 percent. The commercials are Bearish with a score of 38.7 percent and the small traders (not shown in chart) are Bearish-Extreme with a score of 19.3 percent.
| Silver Futures Statistics | SPECULATORS | COMMERCIALS | SMALL TRADERS |
| – Percent of Open Interest Longs: | 44.7 | 30.3 | 17.1 |
| – Percent of Open Interest Shorts: | 12.0 | 71.9 | 8.2 |
| – Net Position: | 48,240 | -61,372 | 13,132 |
| – Gross Longs: | 65,917 | 44,589 | 25,145 |
| – Gross Shorts: | 17,677 | 105,961 | 12,013 |
| – Long to Short Ratio: | 3.7 to 1 | 0.4 to 1 | 2.1 to 1 |
| NET POSITION TREND: | |||
| – Strength Index Score (3 Year Range Pct): | 70.4 | 38.7 | 19.3 |
| – Strength Index Reading (3 Year Range): | Bullish | Bearish | Bearish-Extreme |
| NET POSITION MOVEMENT INDEX: | |||
| – 6-Week Change in Strength Index: | 24.6 | -24.6 | 2.0 |
Copper Grade #1 Futures:
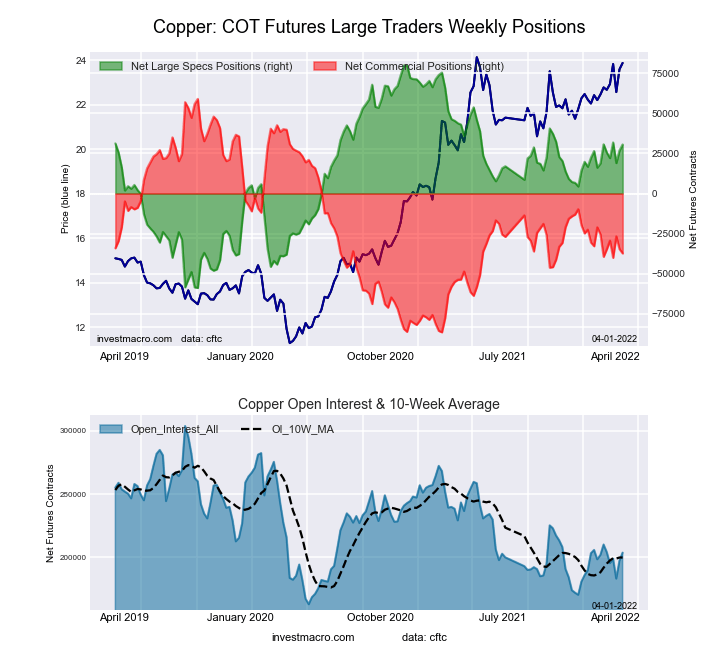 The Copper Grade #1 Futures large speculator standing this week resulted in a net position of 30,581 contracts in the data reported through Tuesday. This was a weekly gain of 3,769 contracts from the previous week which had a total of 26,812 net contracts.
This week’s current strength score (the trader positioning range over the past three years, measured from 0 to 100) shows the speculators are currently Bullish with a score of 64.4 percent. The commercials are Bearish with a score of 33.8 percent and the small traders (not shown in chart) are Bullish with a score of 64.3 percent.
| Copper Futures Statistics | SPECULATORS | COMMERCIALS | SMALL TRADERS |
| – Percent of Open Interest Longs: | 42.5 | 40.8 | 8.8 |
| – Percent of Open Interest Shorts: | 27.5 | 59.1 | 5.5 |
| – Net Position: | 30,581 | -37,333 | 6,752 |
| – Gross Longs: | 86,553 | 83,024 | 17,961 |
| – Gross Shorts: | 55,972 | 120,357 | 11,209 |
| – Long to Short Ratio: | 1.5 to 1 | 0.7 to 1 | 1.6 to 1 |
| NET POSITION TREND: | |||
| – Strength Index Score (3 Year Range Pct): | 64.4 | 33.8 | 64.3 |
| – Strength Index Reading (3 Year Range): | Bullish | Bearish | Bullish |
| NET POSITION MOVEMENT INDEX: | |||
| – 6-Week Change in Strength Index: | -0.1 | 1.4 | -11.4 |
Platinum Futures:
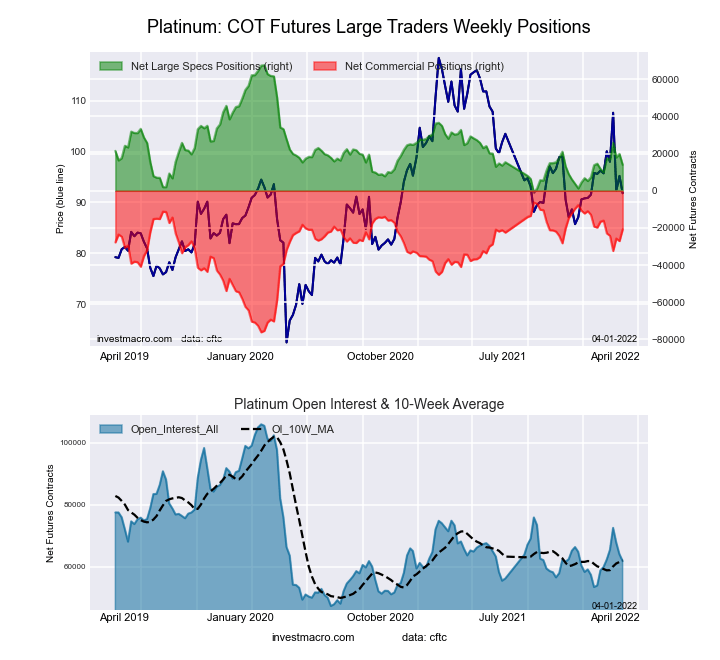 The Platinum Futures large speculator standing this week resulted in a net position of 14,001 contracts in the data reported through Tuesday. This was a weekly lowering of -5,814 contracts from the previous week which had a total of 19,815 net contracts.
This week’s current strength score (the trader positioning range over the past three years, measured from 0 to 100) shows the speculators are currently Bearish with a score of 21.9 percent. The commercials are Bullish with a score of 79.4 percent and the small traders (not shown in chart) are Bullish with a score of 56.2 percent.
| Platinum Futures Statistics | SPECULATORS | COMMERCIALS | SMALL TRADERS |
| – Percent of Open Interest Longs: | 47.9 | 32.0 | 15.9 |
| – Percent of Open Interest Shorts: | 25.2 | 65.6 | 4.9 |
| – Net Position: | 14,001 | -20,754 | 6,753 |
| – Gross Longs: | 29,585 | 19,797 | 9,798 |
| – Gross Shorts: | 15,584 | 40,551 | 3,045 |
| – Long to Short Ratio: | 1.9 to 1 | 0.5 to 1 | 3.2 to 1 |
| NET POSITION TREND: | |||
| – Strength Index Score (3 Year Range Pct): | 21.9 | 79.4 | 56.2 |
| – Strength Index Reading (3 Year Range): | Bearish | Bullish | Bullish |
| NET POSITION MOVEMENT INDEX: | |||
| – 6-Week Change in Strength Index: | 5.6 | -6.8 | 12.1 |
Palladium Futures:
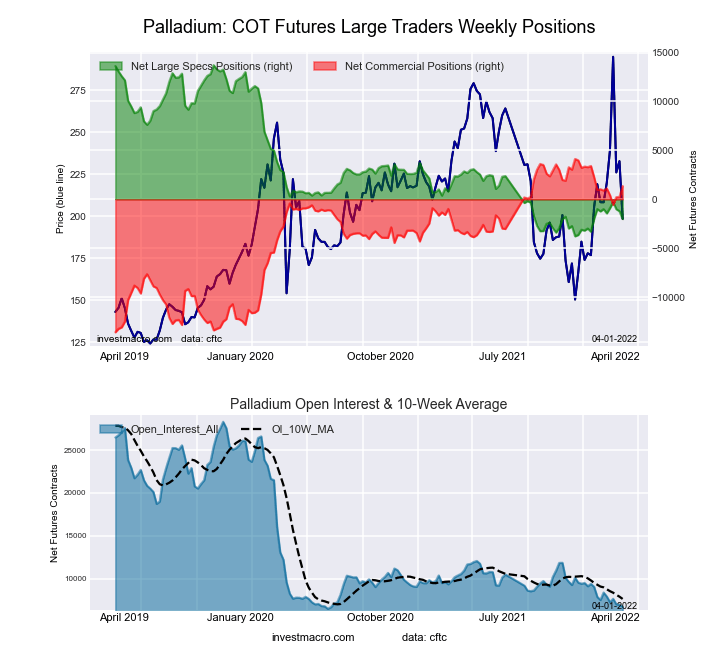 The Palladium Futures large speculator standing this week resulted in a net position of -2,011 contracts in the data reported through Tuesday. This was a weekly fall of -803 contracts from the previous week which had a total of -1,208 net contracts.
This week’s current strength score (the trader positioning range over the past three years, measured from 0 to 100) shows the speculators are currently Bearish-Extreme with a score of 10.1 percent. The commercials are Bullish-Extreme with a score of 84.2 percent and the small traders (not shown in chart) are Bullish-Extreme with a score of 81.3 percent.
| Palladium Futures Statistics | SPECULATORS | COMMERCIALS | SMALL TRADERS |
| – Percent of Open Interest Longs: | 23.3 | 53.3 | 21.8 |
| – Percent of Open Interest Shorts: | 53.2 | 33.0 | 12.2 |
| – Net Position: | -2,011 | 1,364 | 647 |
| – Gross Longs: | 1,564 | 3,581 | 1,468 |
| – Gross Shorts: | 3,575 | 2,217 | 821 |
| – Long to Short Ratio: | 0.4 to 1 | 1.6 to 1 | 1.8 to 1 |
| NET POSITION TREND: | |||
| – Strength Index Score (3 Year Range Pct): | 10.1 | 84.2 | 81.3 |
| – Strength Index Reading (3 Year Range): | Bearish-Extreme | Bullish-Extreme | Bullish-Extreme |
| NET POSITION MOVEMENT INDEX: | |||
| – 6-Week Change in Strength Index: | -5.8 | 2.6 | 31.8 |
Article By InvestMacro – Receive our weekly COT Reports by Email
*COT Report: The COT data, released weekly to the public each Friday, is updated through the most recent Tuesday (data is 3 days old) and shows a quick view of how large speculators or non-commercials (for-profit traders) were positioned in the futures markets.
The CFTC categorizes trader positions according to commercial hedgers (traders who use futures contracts for hedging as part of the business), non-commercials (large traders who speculate to realize trading profits) and nonreportable traders (usually small traders/speculators) as well as their open interest (contracts open in the market at time of reporting).See CFTC criteria here.

- COT Metals Charts: Weekly Speculator Bets led by Copper & Steel Jul 18, 2026
- COT Bonds Charts: Weekly Speculator Bets led by 2-Year, SOFR 3M & 5-Year Bonds Jul 18, 2026
- COT Energy Charts: Weekly Speculator Bets led by Brent Oil & Heating Oil Jul 18, 2026
- COT Soft Commodities Charts: Weekly Speculator Bets led by Wheat, Corn & Soybean Meal Jul 18, 2026
- The Bank of Canada kept its interest rate unchanged. Platinum prices reached a three‑week high Jul 16, 2026
- Stock indices rose after the release of US inflation data. China’s GDP slowed sharply Jul 15, 2026
- GBP/USD Awaits Political News: What Will Happen Next Jul 15, 2026
- USD/JPY Holds at Highs: Pressure Lingers on Yen Jul 14, 2026
- Oil prices jumped 4% amid a new wave of escalation between the US and Iran Jul 13, 2026
- EUR/USD: US Inflation Will Determine Everything Jul 13, 2026