
By InvestMacro | COT | Data Tables | COT Leaders | Downloads | COT Newsletter
Here are the latest charts and statistics for the Commitment of Traders (COT) data published by the Commodities Futures Trading Commission (CFTC).
The latest COT data is updated through Tuesday February 22nd and shows a quick view of how large traders (for-profit speculators and commercial entities) were positioned in the futures markets.
Highlighting the COT soft commodities data is this week’s jump in Corn futures bets. The speculative net position in the Corn futures rose sharply this week following two weeks of decline. The Corn speculator position, despite falling in the previous two weeks, have now actually gained by a total of +63,604 contracts over the past five weeks. The boost has pushed speculator positions to the highest bullish position of the past three weeks and second highest of the past eight weeks. Corn prices, meanwhile, surged upwards this week and touched the highest level since May of last year.
The soft commodities that saw higher speculator bets this week were Corn (37,250 contracts), Sugar (683 contracts), Soybeans (9,732 contracts), Soybean Oil (15,773 contracts), Soybean Meal (2,556 contracts) and Wheat (1,944 contracts).
The soft commodities that saw lower speculator bets this week were Coffee (-2,634 contracts), Cocoa (-7,301 contracts), Live Cattle (-1,324 contracts), Cotton (-3,421 contracts) and Lean Hogs (-894 contracts).
Free Reports:
 Get our Weekly Commitment of Traders Reports - See where the biggest traders (Hedge Funds and Commercial Hedgers) are positioned in the futures markets on a weekly basis.
 Sign Up for Our Stock Market Newsletter – Get updated on News, Charts & Rankings of Public Companies when you join our Stocks Newsletter
| Feb-22-2022 | OI | OI-Index | Spec-Net | Spec-Index | Com-Net | COM-Index | Smalls-Net | Smalls-Index |
|---|---|---|---|---|---|---|---|---|
| WTI Crude | 2,058,132 | 29 | 339,041 | 2 | -382,891 | 90 | 43,850 | 77 |
| Gold | 611,488 | 49 | 243,148 | 65 | -269,722 | 35 | 26,574 | 40 |
| Silver | 163,745 | 29 | 30,302 | 53 | -43,720 | 56 | 13,418 | 21 |
| Copper | 204,123 | 29 | 25,575 | 61 | -34,754 | 36 | 9,179 | 78 |
| Palladium | 7,903 | 7 | -1,429 | 13 | 1,118 | 83 | 311 | 63 |
| Platinum | 62,274 | 26 | 17,540 | 27 | -22,887 | 76 | 5,347 | 37 |
| Natural Gas | 1,107,113 | 2 | -130,629 | 39 | 95,974 | 61 | 34,655 | 67 |
| Brent | 215,908 | 52 | -26,355 | 73 | 24,478 | 31 | 1,877 | 35 |
| Heating Oil | 349,618 | 31 | 6,455 | 52 | -32,434 | 37 | 25,979 | 88 |
| Soybeans | 826,824 | 51 | 226,464 | 86 | -196,755 | 20 | -29,709 | 21 |
| Corn | 1,563,758 | 32 | 451,742 | 88 | -410,962 | 13 | -40,780 | 20 |
| Coffee | 252,688 | 24 | 67,791 | 98 | -72,509 | 3 | 4,718 | 21 |
| Sugar | 857,376 | 8 | 75,246 | 52 | -95,306 | 50 | 20,060 | 33 |
| Wheat | 379,308 | 23 | -3,902 | 44 | 10,629 | 51 | -6,727 | 69 |
CORN Futures:
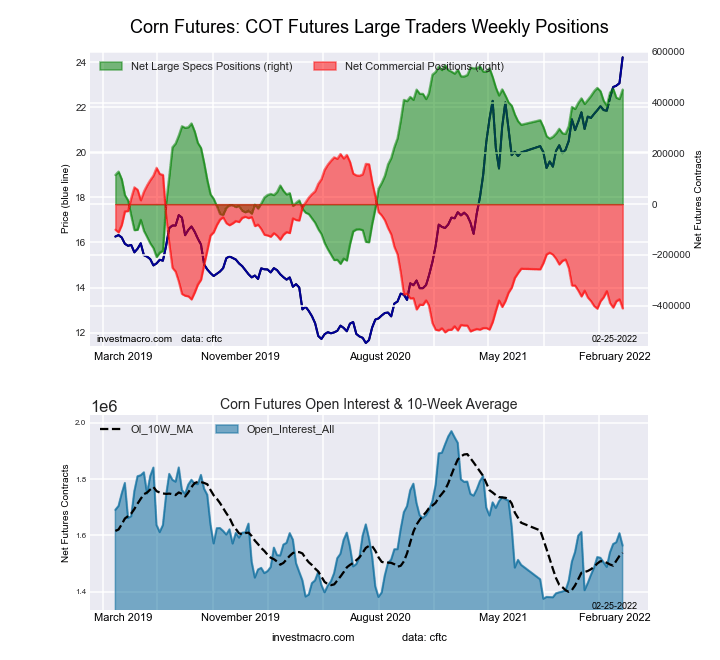 The CORN large speculator standing this week was a net position of 451,742 contracts in the data reported through Tuesday. This was a weekly lift of 37,250 contracts from the previous week which had a total of 414,492 net contracts.
This week’s current strength score (the trader positioning range over the past three years, measured from 0 to 100) shows the speculators are currently Bullish-Extreme with a score of 87.7 percent. The commercials are Bearish-Extreme with a score of 13.4 percent and the small traders (not shown in chart) are Bearish-Extreme with a score of 19.6 percent.
| CORN Futures Statistics | SPECULATORS | COMMERCIALS | SMALL TRADERS |
| – Percent of Open Interest Longs: | 34.3 | 43.5 | 9.2 |
| – Percent of Open Interest Shorts: | 5.4 | 69.8 | 11.8 |
| – Net Position: | 451,742 | -410,962 | -40,780 |
| – Gross Longs: | 536,898 | 680,211 | 144,247 |
| – Gross Shorts: | 85,156 | 1,091,173 | 185,027 |
| – Long to Short Ratio: | 6.3 to 1 | 0.6 to 1 | 0.8 to 1 |
| NET POSITION TREND: | |||
| – Strength Index Score (3 Year Range Pct): | 87.7 | 13.4 | 19.6 |
| – Strength Index Reading (3 Year Range): | Bullish-Extreme | Bearish-Extreme | Bearish-Extreme |
| NET POSITION MOVEMENT INDEX: | |||
| – 6-Week Change in Strength Index: | 5.7 | -6.3 | -0.1 |
SUGAR Futures:
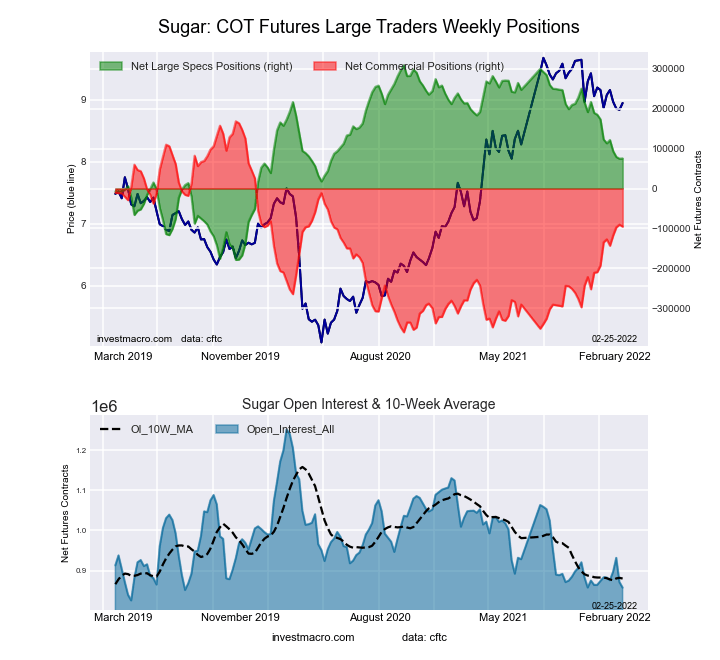 The SUGAR large speculator standing this week was a net position of 75,246 contracts in the data reported through Tuesday. This was a weekly boost of 683 contracts from the previous week which had a total of 74,563 net contracts.
This week’s current strength score (the trader positioning range over the past three years, measured from 0 to 100) shows the speculators are currently Bullish with a score of 52.1 percent. The commercials are Bullish with a score of 50.1 percent and the small traders (not shown in chart) are Bearish with a score of 32.7 percent.
| SUGAR Futures Statistics | SPECULATORS | COMMERCIALS | SMALL TRADERS |
| – Percent of Open Interest Longs: | 21.3 | 56.0 | 9.2 |
| – Percent of Open Interest Shorts: | 12.6 | 67.1 | 6.9 |
| – Net Position: | 75,246 | -95,306 | 20,060 |
| – Gross Longs: | 183,029 | 480,097 | 79,212 |
| – Gross Shorts: | 107,783 | 575,403 | 59,152 |
| – Long to Short Ratio: | 1.7 to 1 | 0.8 to 1 | 1.3 to 1 |
| NET POSITION TREND: | |||
| – Strength Index Score (3 Year Range Pct): | 52.1 | 50.1 | 32.7 |
| – Strength Index Reading (3 Year Range): | Bullish | Bullish | Bearish |
| NET POSITION MOVEMENT INDEX: | |||
| – 6-Week Change in Strength Index: | -9.8 | 7.4 | 10.5 |
COFFEE Futures:
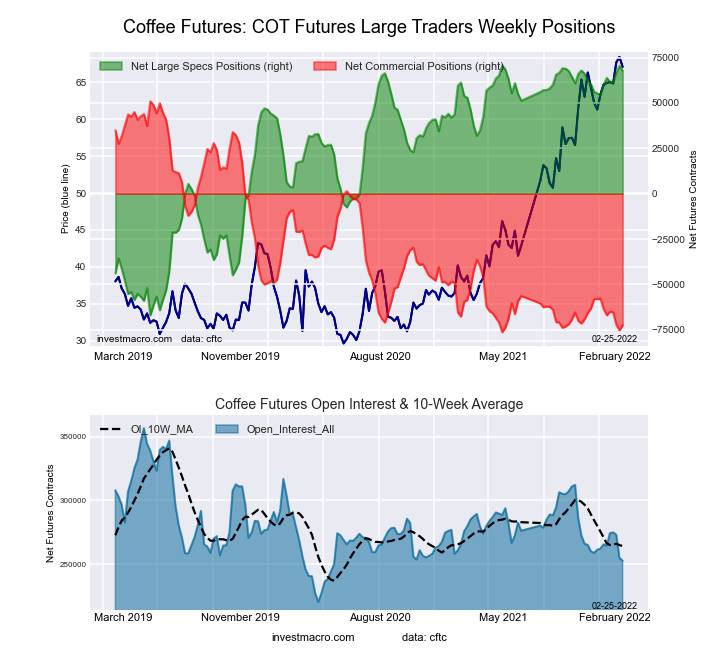 The COFFEE large speculator standing this week was a net position of 67,791 contracts in the data reported through Tuesday. This was a weekly decrease of -2,634 contracts from the previous week which had a total of 70,425 net contracts.
This week’s current strength score (the trader positioning range over the past three years, measured from 0 to 100) shows the speculators are currently Bullish-Extreme with a score of 97.8 percent. The commercials are Bearish-Extreme with a score of 3.0 percent and the small traders (not shown in chart) are Bearish with a score of 21.0 percent.
| COFFEE Futures Statistics | SPECULATORS | COMMERCIALS | SMALL TRADERS |
| – Percent of Open Interest Longs: | 30.7 | 41.8 | 4.3 |
| – Percent of Open Interest Shorts: | 3.9 | 70.5 | 2.5 |
| – Net Position: | 67,791 | -72,509 | 4,718 |
| – Gross Longs: | 77,625 | 105,619 | 10,958 |
| – Gross Shorts: | 9,834 | 178,128 | 6,240 |
| – Long to Short Ratio: | 7.9 to 1 | 0.6 to 1 | 1.8 to 1 |
| NET POSITION TREND: | |||
| – Strength Index Score (3 Year Range Pct): | 97.8 | 3.0 | 21.0 |
| – Strength Index Reading (3 Year Range): | Bullish-Extreme | Bearish-Extreme | Bearish |
| NET POSITION MOVEMENT INDEX: | |||
| – 6-Week Change in Strength Index: | 5.5 | -7.0 | 9.0 |
SOYBEANS Futures:
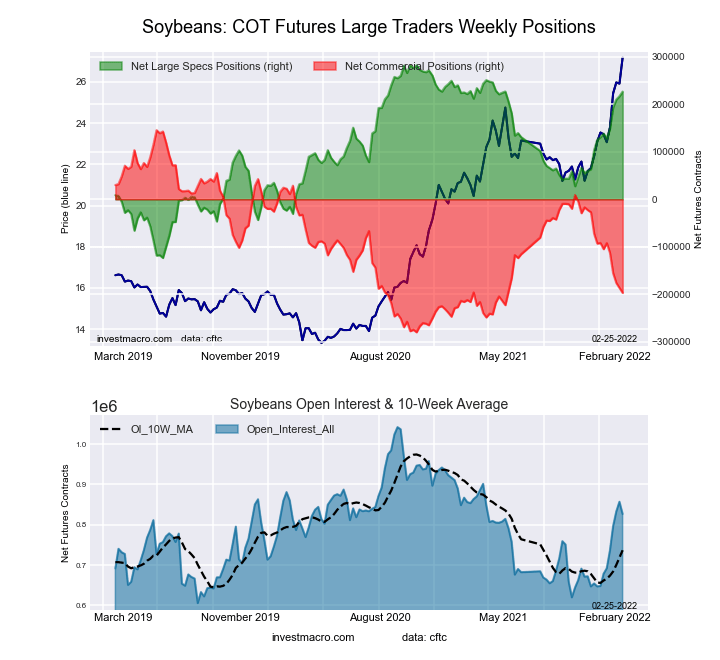 The SOYBEANS large speculator standing this week was a net position of 226,464 contracts in the data reported through Tuesday. This was a weekly rise of 9,732 contracts from the previous week which had a total of 216,732 net contracts.
This week’s current strength score (the trader positioning range over the past three years, measured from 0 to 100) shows the speculators are currently Bullish-Extreme with a score of 86.3 percent. The commercials are Bearish-Extreme with a score of 19.5 percent and the small traders (not shown in chart) are Bearish with a score of 20.8 percent.
| SOYBEANS Futures Statistics | SPECULATORS | COMMERCIALS | SMALL TRADERS |
| – Percent of Open Interest Longs: | 33.1 | 42.9 | 6.9 |
| – Percent of Open Interest Shorts: | 5.8 | 66.7 | 10.5 |
| – Net Position: | 226,464 | -196,755 | -29,709 |
| – Gross Longs: | 274,012 | 354,837 | 57,443 |
| – Gross Shorts: | 47,548 | 551,592 | 87,152 |
| – Long to Short Ratio: | 5.8 to 1 | 0.6 to 1 | 0.7 to 1 |
| NET POSITION TREND: | |||
| – Strength Index Score (3 Year Range Pct): | 86.3 | 19.5 | 20.8 |
| – Strength Index Reading (3 Year Range): | Bullish-Extreme | Bearish-Extreme | Bearish |
| NET POSITION MOVEMENT INDEX: | |||
| – 6-Week Change in Strength Index: | 21.8 | -21.6 | 6.2 |
SOYBEAN OIL Futures:
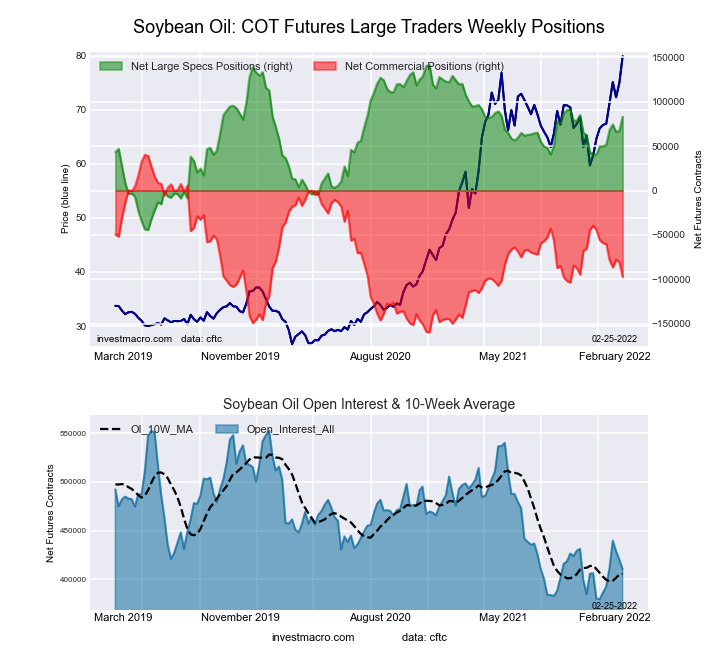 The SOYBEAN OIL large speculator standing this week was a net position of 83,093 contracts in the data reported through Tuesday. This was a weekly rise of 15,773 contracts from the previous week which had a total of 67,320 net contracts.
This week’s current strength score (the trader positioning range over the past three years, measured from 0 to 100) shows the speculators are currently Bullish with a score of 68.7 percent. The commercials are Bearish with a score of 31.1 percent and the small traders (not shown in chart) are Bullish with a score of 66.4 percent.
| SOYBEAN OIL Futures Statistics | SPECULATORS | COMMERCIALS | SMALL TRADERS |
| – Percent of Open Interest Longs: | 27.8 | 44.7 | 9.3 |
| – Percent of Open Interest Shorts: | 7.6 | 68.4 | 5.9 |
| – Net Position: | 83,093 | -97,272 | 14,179 |
| – Gross Longs: | 114,335 | 183,547 | 38,221 |
| – Gross Shorts: | 31,242 | 280,819 | 24,042 |
| – Long to Short Ratio: | 3.7 to 1 | 0.7 to 1 | 1.6 to 1 |
| NET POSITION TREND: | |||
| – Strength Index Score (3 Year Range Pct): | 68.7 | 31.1 | 66.4 |
| – Strength Index Reading (3 Year Range): | Bullish | Bearish | Bullish |
| NET POSITION MOVEMENT INDEX: | |||
| – 6-Week Change in Strength Index: | 17.9 | -19.1 | 18.5 |
SOYBEAN MEAL Futures:
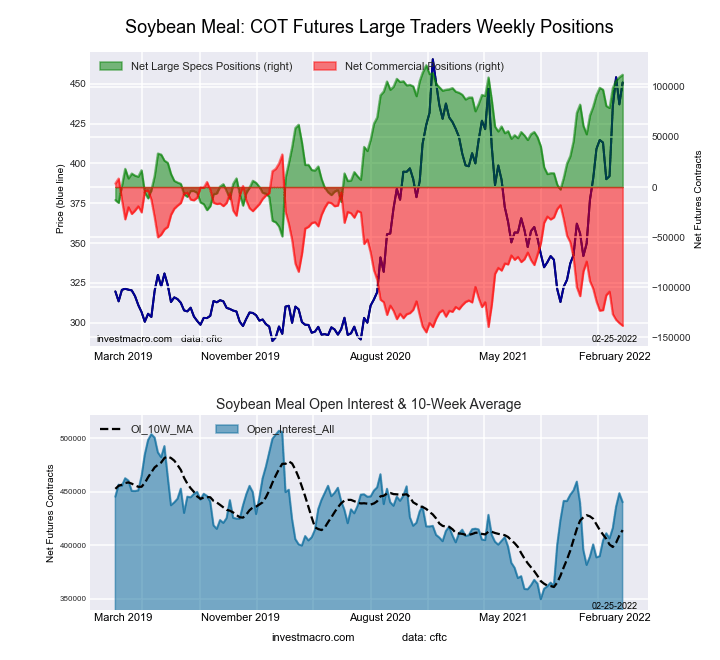 The SOYBEAN MEAL large speculator standing this week was a net position of 112,100 contracts in the data reported through Tuesday. This was a weekly lift of 2,556 contracts from the previous week which had a total of 109,544 net contracts.
This week’s current strength score (the trader positioning range over the past three years, measured from 0 to 100) shows the speculators are currently Bullish-Extreme with a score of 94.4 percent. The commercials are Bearish-Extreme with a score of 3.7 percent and the small traders (not shown in chart) are Bullish with a score of 76.4 percent.
| SOYBEAN MEAL Futures Statistics | SPECULATORS | COMMERCIALS | SMALL TRADERS |
| – Percent of Open Interest Longs: | 29.5 | 41.9 | 11.4 |
| – Percent of Open Interest Shorts: | 4.0 | 73.4 | 5.4 |
| – Net Position: | 112,100 | -138,497 | 26,397 |
| – Gross Longs: | 129,919 | 184,652 | 49,974 |
| – Gross Shorts: | 17,819 | 323,149 | 23,577 |
| – Long to Short Ratio: | 7.3 to 1 | 0.6 to 1 | 2.1 to 1 |
| NET POSITION TREND: | |||
| – Strength Index Score (3 Year Range Pct): | 94.4 | 3.7 | 76.4 |
| – Strength Index Reading (3 Year Range): | Bullish-Extreme | Bearish-Extreme | Bullish |
| NET POSITION MOVEMENT INDEX: | |||
| – 6-Week Change in Strength Index: | 8.7 | -8.8 | 3.0 |
LIVE CATTLE Futures:
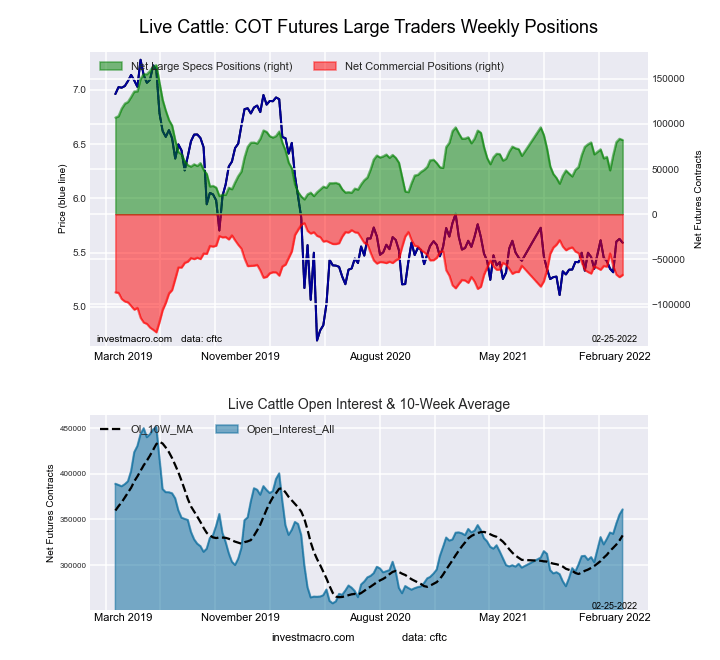 The LIVE CATTLE large speculator standing this week was a net position of 82,243 contracts in the data reported through Tuesday. This was a weekly reduction of -1,324 contracts from the previous week which had a total of 83,567 net contracts.
This week’s current strength score (the trader positioning range over the past three years, measured from 0 to 100) shows the speculators are currently Bearish with a score of 44.3 percent. The commercials are Bullish with a score of 52.5 percent and the small traders (not shown in chart) are Bullish with a score of 50.6 percent.
| LIVE CATTLE Futures Statistics | SPECULATORS | COMMERCIALS | SMALL TRADERS |
| – Percent of Open Interest Longs: | 36.4 | 36.4 | 9.0 |
| – Percent of Open Interest Shorts: | 13.7 | 55.1 | 13.2 |
| – Net Position: | 82,243 | -67,284 | -14,959 |
| – Gross Longs: | 131,540 | 131,571 | 32,596 |
| – Gross Shorts: | 49,297 | 198,855 | 47,555 |
| – Long to Short Ratio: | 2.7 to 1 | 0.7 to 1 | 0.7 to 1 |
| NET POSITION TREND: | |||
| – Strength Index Score (3 Year Range Pct): | 44.3 | 52.5 | 50.6 |
| – Strength Index Reading (3 Year Range): | Bearish | Bullish | Bullish |
| NET POSITION MOVEMENT INDEX: | |||
| – 6-Week Change in Strength Index: | 13.7 | -8.2 | -25.5 |
LEAN HOGS Futures:
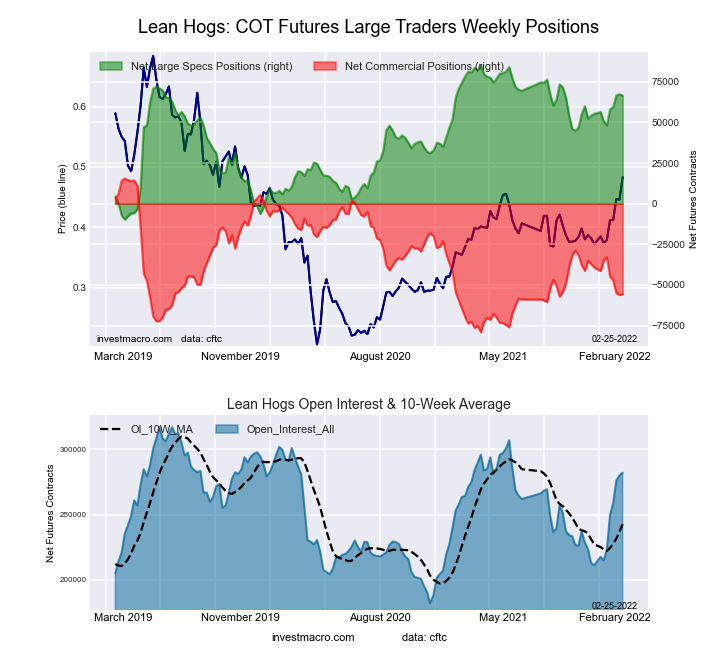 The LEAN HOGS large speculator standing this week was a net position of 66,438 contracts in the data reported through Tuesday. This was a weekly lowering of -894 contracts from the previous week which had a total of 67,332 net contracts.
This week’s current strength score (the trader positioning range over the past three years, measured from 0 to 100) shows the speculators are currently Bullish with a score of 79.1 percent. The commercials are Bearish with a score of 25.1 percent and the small traders (not shown in chart) are Bearish with a score of 33.4 percent.
| LEAN HOGS Futures Statistics | SPECULATORS | COMMERCIALS | SMALL TRADERS |
| – Percent of Open Interest Longs: | 39.3 | 32.5 | 8.2 |
| – Percent of Open Interest Shorts: | 15.8 | 52.2 | 12.0 |
| – Net Position: | 66,438 | -55,639 | -10,799 |
| – Gross Longs: | 111,021 | 91,697 | 23,034 |
| – Gross Shorts: | 44,583 | 147,336 | 33,833 |
| – Long to Short Ratio: | 2.5 to 1 | 0.6 to 1 | 0.7 to 1 |
| NET POSITION TREND: | |||
| – Strength Index Score (3 Year Range Pct): | 79.1 | 25.1 | 33.4 |
| – Strength Index Reading (3 Year Range): | Bullish | Bearish | Bearish |
| NET POSITION MOVEMENT INDEX: | |||
| – 6-Week Change in Strength Index: | 17.2 | -22.2 | 21.1 |
COTTON Futures:
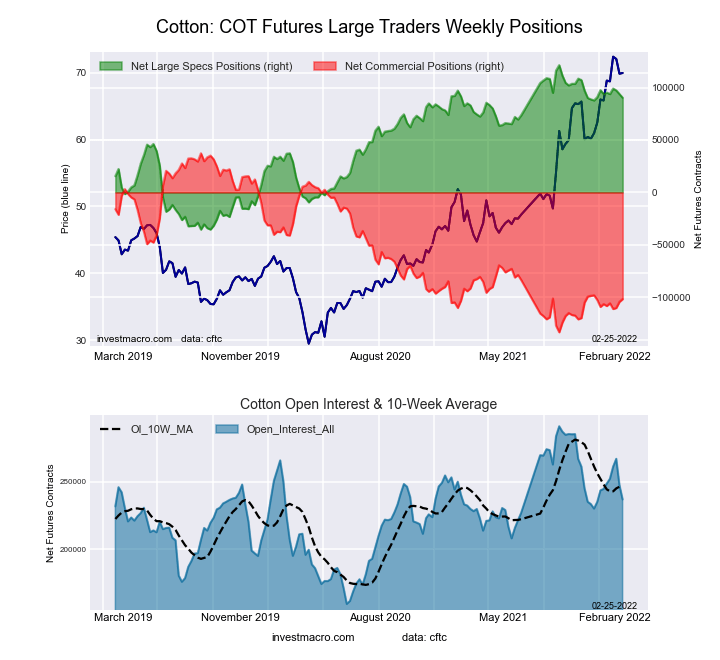 The COTTON large speculator standing this week was a net position of 90,302 contracts in the data reported through Tuesday. This was a weekly decrease of -3,421 contracts from the previous week which had a total of 93,723 net contracts.
This week’s current strength score (the trader positioning range over the past three years, measured from 0 to 100) shows the speculators are currently Bullish-Extreme with a score of 80.2 percent. The commercials are Bearish-Extreme with a score of 18.5 percent and the small traders (not shown in chart) are Bullish-Extreme with a score of 84.9 percent.
| COTTON Futures Statistics | SPECULATORS | COMMERCIALS | SMALL TRADERS |
| – Percent of Open Interest Longs: | 43.4 | 38.3 | 8.2 |
| – Percent of Open Interest Shorts: | 5.3 | 81.2 | 3.4 |
| – Net Position: | 90,302 | -101,731 | 11,429 |
| – Gross Longs: | 102,764 | 90,576 | 19,371 |
| – Gross Shorts: | 12,462 | 192,307 | 7,942 |
| – Long to Short Ratio: | 8.2 to 1 | 0.5 to 1 | 2.4 to 1 |
| NET POSITION TREND: | |||
| – Strength Index Score (3 Year Range Pct): | 80.2 | 18.5 | 84.9 |
| – Strength Index Reading (3 Year Range): | Bullish-Extreme | Bearish-Extreme | Bullish-Extreme |
| NET POSITION MOVEMENT INDEX: | |||
| – 6-Week Change in Strength Index: | -2.2 | 2.8 | -7.6 |
COCOA Futures:
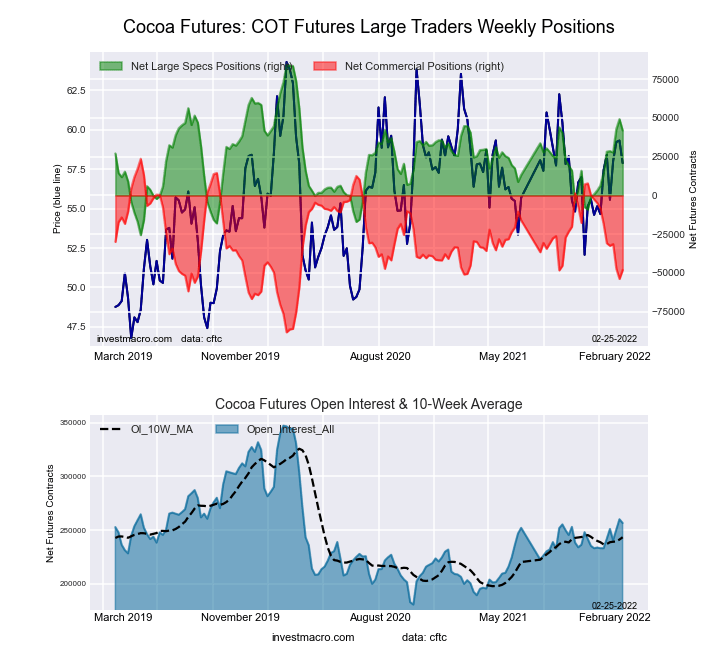 The COCOA large speculator standing this week was a net position of 41,915 contracts in the data reported through Tuesday. This was a weekly decrease of -7,301 contracts from the previous week which had a total of 49,216 net contracts.
This week’s current strength score (the trader positioning range over the past three years, measured from 0 to 100) shows the speculators are currently Bullish with a score of 61.6 percent. The commercials are Bearish with a score of 35.9 percent and the small traders (not shown in chart) are Bullish with a score of 78.5 percent.
| COCOA Futures Statistics | SPECULATORS | COMMERCIALS | SMALL TRADERS |
| – Percent of Open Interest Longs: | 32.7 | 42.7 | 5.5 |
| – Percent of Open Interest Shorts: | 16.4 | 61.4 | 3.1 |
| – Net Position: | 41,915 | -48,066 | 6,151 |
| – Gross Longs: | 83,987 | 109,435 | 14,151 |
| – Gross Shorts: | 42,072 | 157,501 | 8,000 |
| – Long to Short Ratio: | 2.0 to 1 | 0.7 to 1 | 1.8 to 1 |
| NET POSITION TREND: | |||
| – Strength Index Score (3 Year Range Pct): | 61.6 | 35.9 | 78.5 |
| – Strength Index Reading (3 Year Range): | Bullish | Bearish | Bullish |
| NET POSITION MOVEMENT INDEX: | |||
| – 6-Week Change in Strength Index: | 24.6 | -26.5 | 30.1 |
WHEAT Futures:
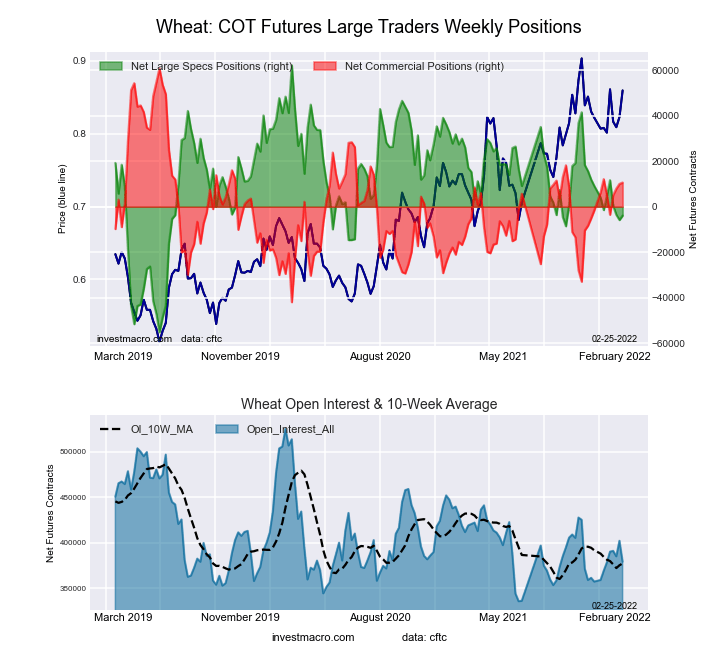 The WHEAT large speculator standing this week was a net position of -3,902 contracts in the data reported through Tuesday. This was a weekly rise of 1,944 contracts from the previous week which had a total of -5,846 net contracts.
This week’s current strength score (the trader positioning range over the past three years, measured from 0 to 100) shows the speculators are currently Bearish with a score of 43.7 percent. The commercials are Bullish with a score of 51.2 percent and the small traders (not shown in chart) are Bullish with a score of 69.4 percent.
| WHEAT Futures Statistics | SPECULATORS | COMMERCIALS | SMALL TRADERS |
| – Percent of Open Interest Longs: | 25.8 | 40.8 | 8.9 |
| – Percent of Open Interest Shorts: | 26.8 | 38.0 | 10.7 |
| – Net Position: | -3,902 | 10,629 | -6,727 |
| – Gross Longs: | 97,675 | 154,648 | 33,795 |
| – Gross Shorts: | 101,577 | 144,019 | 40,522 |
| – Long to Short Ratio: | 1.0 to 1 | 1.1 to 1 | 0.8 to 1 |
| NET POSITION TREND: | |||
| – Strength Index Score (3 Year Range Pct): | 43.7 | 51.2 | 69.4 |
| – Strength Index Reading (3 Year Range): | Bearish | Bullish | Bullish |
| NET POSITION MOVEMENT INDEX: | |||
| – 6-Week Change in Strength Index: | -2.1 | -1.4 | 18.7 |
Article By InvestMacro – Receive our weekly COT Reports by Email
*COT Report: The COT data, released weekly to the public each Friday, is updated through the most recent Tuesday (data is 3 days old) and shows a quick view of how large speculators or non-commercials (for-profit traders) were positioned in the futures markets.
The CFTC categorizes trader positions according to commercial hedgers (traders who use futures contracts for hedging as part of the business), non-commercials (large traders who speculate to realize trading profits) and nonreportable traders (usually small traders/speculators) as well as their open interest (contracts open in the market at time of reporting).See CFTC criteria here.

- This week will be one of the most crowded for central‑bank meetings Jul 27, 2026
- EUR/USD Ahead of a Key Week: Holding Near Lows Jul 27, 2026
- COT Metals Charts: Weekly Speculator Changes led by Copper Jul 26, 2026
- COT Bonds Charts: Speculator Bets led by SOFR 3-Months & 5-Year Bonds Jul 26, 2026
- COT Energy Charts: Weekly Speculator Bets led by WTI Crude & Natural Gas Jul 26, 2026
- COT Soft Commodities Charts: Weekly Speculator Bets led by Corn & Soybeans Jul 26, 2026
- The US introduces new import tariffs for 60 countries. Brent crude surpasses $100 per barrel Jul 24, 2026
- USD/JPY Breaks Records: Nothing Slows the Yen’s Decline Jul 24, 2026
- Oil prices reached a 6‑week high. The AUD strengthened on the back of a strong labor‑market report Jul 23, 2026
- EUR/USD Recovers as Dollar Weakens Jul 23, 2026