
By InvestMacro | COT | Data Tables | COT Leaders | Downloads | COT Newsletter
Here are the latest charts and statistics for the Commitment of Traders (COT) data published by the Commodities Futures Trading Commission (CFTC).
The latest COT data is updated through Tuesday February 22nd and shows a quick view of how large traders (for-profit speculators and commercial entities) were positioned in the futures markets.
Highlighting the COT energy data is the continued decline in the WTI Crude Oil futures bets. The speculative net position in the WTI Crude Oil futures has decreased for five consecutive weeks and in thirteen out of the past fifteen weeks. The spec crude position has dropped by a total of -82,271 contracts over the past fifteen weeks and speculators have now pushed their current net positioning to the lowest level of the past seven weeks. These declines in speculator sentiment has brought the current speculator strength score level into a bearish-extreme standing of just 2.4 percent where the strength score measures the current speculator standing compared to past three years where above 80 is bullish-extreme and below 20 is bearish-extreme. Despite the speculator weakness, crude oil prices have shot up on the Russian invasion of Ukraine with WTI crude touching slightly above $100 per barrel late this week.
Joining WTI Crude Oil (-9,052 contracts) with falling speculator bets this week were Brent Crude Oil (-30 contracts) and Heating Oil (-9,228 contracts) while Natural Gas (795 contracts), Gasoline (991 contracts) and the Bloomberg Commodity Index (4,874 contracts) saw higher speculator positions on the week.
| Feb-22-2022 | OI | OI-Index | Spec-Net | Spec-Index | Com-Net | COM-Index | Smalls-Net | Smalls-Index |
|---|---|---|---|---|---|---|---|---|
| WTI Crude | 2,058,132 | 29 | 339,041 | 2 | -382,891 | 90 | 43,850 | 77 |
| Gold | 611,488 | 49 | 243,148 | 65 | -269,722 | 35 | 26,574 | 40 |
| Silver | 163,745 | 29 | 30,302 | 53 | -43,720 | 56 | 13,418 | 21 |
| Copper | 204,123 | 29 | 25,575 | 61 | -34,754 | 36 | 9,179 | 78 |
| Palladium | 7,903 | 7 | -1,429 | 13 | 1,118 | 83 | 311 | 63 |
| Platinum | 62,274 | 26 | 17,540 | 27 | -22,887 | 76 | 5,347 | 37 |
| Natural Gas | 1,107,113 | 2 | -130,629 | 39 | 95,974 | 61 | 34,655 | 67 |
| Brent | 215,908 | 52 | -26,355 | 73 | 24,478 | 31 | 1,877 | 35 |
| Heating Oil | 349,618 | 31 | 6,455 | 52 | -32,434 | 37 | 25,979 | 88 |
| Soybeans | 826,824 | 51 | 226,464 | 86 | -196,755 | 20 | -29,709 | 21 |
| Corn | 1,563,758 | 32 | 451,742 | 88 | -410,962 | 13 | -40,780 | 20 |
| Coffee | 252,688 | 24 | 67,791 | 98 | -72,509 | 3 | 4,718 | 21 |
| Sugar | 857,376 | 8 | 75,246 | 52 | -95,306 | 50 | 20,060 | 33 |
| Wheat | 379,308 | 23 | -3,902 | 44 | 10,629 | 51 | -6,727 | 69 |
Free Reports:
 Download Our Metatrader 4 Indicators – Put Our Free MetaTrader 4 Custom Indicators on your charts when you join our Weekly Newsletter
 Get our Weekly Commitment of Traders Reports - See where the biggest traders (Hedge Funds and Commercial Hedgers) are positioned in the futures markets on a weekly basis.
WTI Crude Oil Futures:
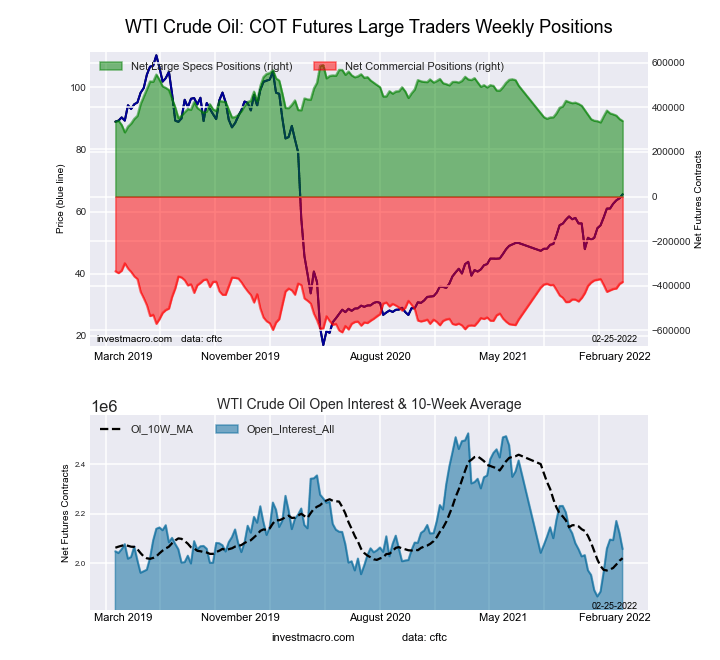 The WTI Crude Oil Futures large speculator standing this week came in at a net position of 339,041 contracts in the data reported through Tuesday. This was a weekly lowering of -9,052 contracts from the previous week which had a total of 348,093 net contracts.
This week’s current strength score (the trader positioning range over the past three years, measured from 0 to 100) shows the speculators are currently Bearish-Extreme with a score of 2.4 percent. The commercials are Bullish-Extreme with a score of 89.9 percent and the small traders (not shown in chart) are Bullish with a score of 76.8 percent.
| WTI Crude Oil Futures Statistics | SPECULATORS | COMMERCIALS | SMALL TRADERS |
| – Percent of Open Interest Longs: | 21.5 | 36.1 | 4.9 |
| – Percent of Open Interest Shorts: | 5.0 | 54.7 | 2.8 |
| – Net Position: | 339,041 | -382,891 | 43,850 |
| – Gross Longs: | 442,102 | 743,113 | 100,987 |
| – Gross Shorts: | 103,061 | 1,126,004 | 57,137 |
| – Long to Short Ratio: | 4.3 to 1 | 0.7 to 1 | 1.8 to 1 |
| NET POSITION TREND: | |||
| – Strength Index Score (3 Year Range Pct): | 2.4 | 89.9 | 76.8 |
| – Strength Index Reading (3 Year Range): | Bearish-Extreme | Bullish-Extreme | Bullish |
| NET POSITION MOVEMENT INDEX: | |||
| – 6-Week Change in Strength Index: | -8.4 | 5.6 | 10.5 |
Brent Crude Oil Futures:
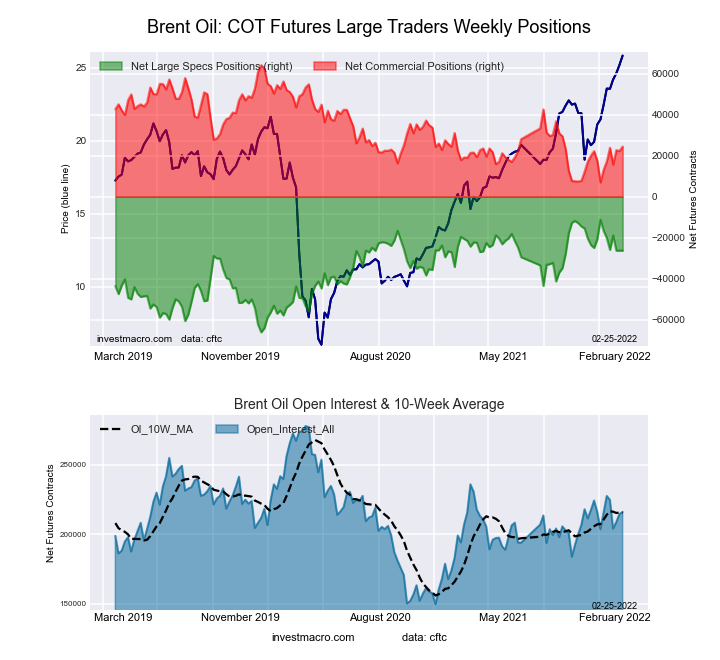 The Brent Crude Oil Futures large speculator standing this week came in at a net position of -26,355 contracts in the data reported through Tuesday. This was a weekly reduction of -30 contracts from the previous week which had a total of -26,325 net contracts.
This week’s current strength score (the trader positioning range over the past three years, measured from 0 to 100) shows the speculators are currently Bullish with a score of 72.5 percent. The commercials are Bearish with a score of 30.6 percent and the small traders (not shown in chart) are Bearish with a score of 34.6 percent.
| Brent Crude Oil Futures Statistics | SPECULATORS | COMMERCIALS | SMALL TRADERS |
| – Percent of Open Interest Longs: | 17.3 | 46.9 | 4.2 |
| – Percent of Open Interest Shorts: | 29.5 | 35.6 | 3.4 |
| – Net Position: | -26,355 | 24,478 | 1,877 |
| – Gross Longs: | 37,283 | 101,361 | 9,173 |
| – Gross Shorts: | 63,638 | 76,883 | 7,296 |
| – Long to Short Ratio: | 0.6 to 1 | 1.3 to 1 | 1.3 to 1 |
| NET POSITION TREND: | |||
| – Strength Index Score (3 Year Range Pct): | 72.5 | 30.6 | 34.6 |
| – Strength Index Reading (3 Year Range): | Bullish | Bearish | Bearish |
| NET POSITION MOVEMENT INDEX: | |||
| – 6-Week Change in Strength Index: | -17.6 | 19.9 | -23.2 |
Natural Gas Futures:
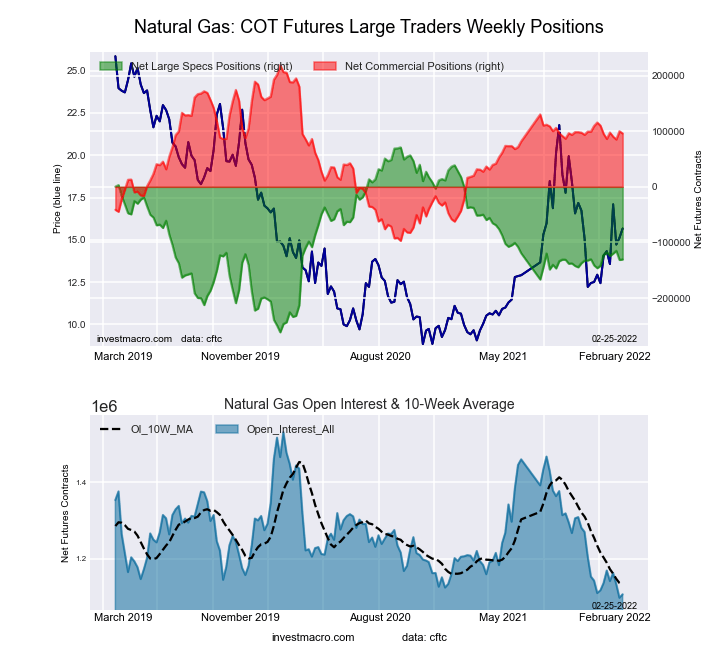 The Natural Gas Futures large speculator standing this week came in at a net position of -130,629 contracts in the data reported through Tuesday. This was a weekly boost of 795 contracts from the previous week which had a total of -131,424 net contracts.
This week’s current strength score (the trader positioning range over the past three years, measured from 0 to 100) shows the speculators are currently Bearish with a score of 39.4 percent. The commercials are Bullish with a score of 61.1 percent and the small traders (not shown in chart) are Bullish with a score of 66.7 percent.
| Natural Gas Futures Statistics | SPECULATORS | COMMERCIALS | SMALL TRADERS |
| – Percent of Open Interest Longs: | 21.9 | 43.8 | 5.4 |
| – Percent of Open Interest Shorts: | 33.6 | 35.1 | 2.3 |
| – Net Position: | -130,629 | 95,974 | 34,655 |
| – Gross Longs: | 241,913 | 484,856 | 60,026 |
| – Gross Shorts: | 372,542 | 388,882 | 25,371 |
| – Long to Short Ratio: | 0.6 to 1 | 1.2 to 1 | 2.4 to 1 |
| NET POSITION TREND: | |||
| – Strength Index Score (3 Year Range Pct): | 39.4 | 61.1 | 66.7 |
| – Strength Index Reading (3 Year Range): | Bearish | Bullish | Bullish |
| NET POSITION MOVEMENT INDEX: | |||
| – 6-Week Change in Strength Index: | -2.4 | 0.3 | 18.3 |
Gasoline Blendstock Futures:
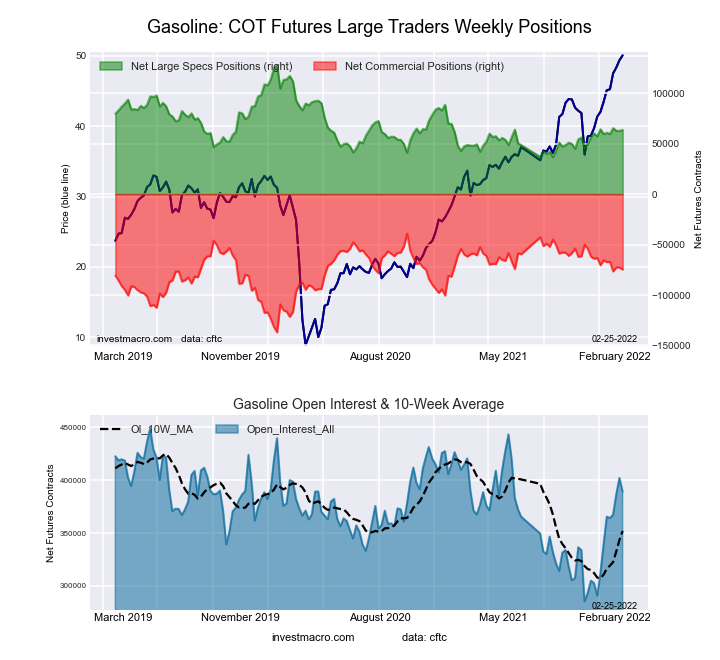 The Gasoline Blendstock Futures large speculator standing this week came in at a net position of 63,587 contracts in the data reported through Tuesday. This was a weekly gain of 991 contracts from the previous week which had a total of 62,596 net contracts.
This week’s current strength score (the trader positioning range over the past three years, measured from 0 to 100) shows the speculators are currently Bearish with a score of 34.8 percent. The commercials are Bullish with a score of 62.3 percent and the small traders (not shown in chart) are Bullish with a score of 78.0 percent.
| Nasdaq Mini Futures Statistics | SPECULATORS | COMMERCIALS | SMALL TRADERS |
| – Percent of Open Interest Longs: | 27.3 | 50.1 | 6.1 |
| – Percent of Open Interest Shorts: | 11.0 | 69.3 | 3.3 |
| – Net Position: | 63,587 | -74,709 | 11,122 |
| – Gross Longs: | 106,356 | 194,978 | 23,947 |
| – Gross Shorts: | 42,769 | 269,687 | 12,825 |
| – Long to Short Ratio: | 2.5 to 1 | 0.7 to 1 | 1.9 to 1 |
| NET POSITION TREND: | |||
| – Strength Index Score (3 Year Range Pct): | 34.8 | 62.3 | 78.0 |
| – Strength Index Reading (3 Year Range): | Bearish | Bullish | Bullish |
| NET POSITION MOVEMENT INDEX: | |||
| – 6-Week Change in Strength Index: | 4.2 | -9.2 | 30.3 |
#2 Heating Oil NY-Harbor Futures:
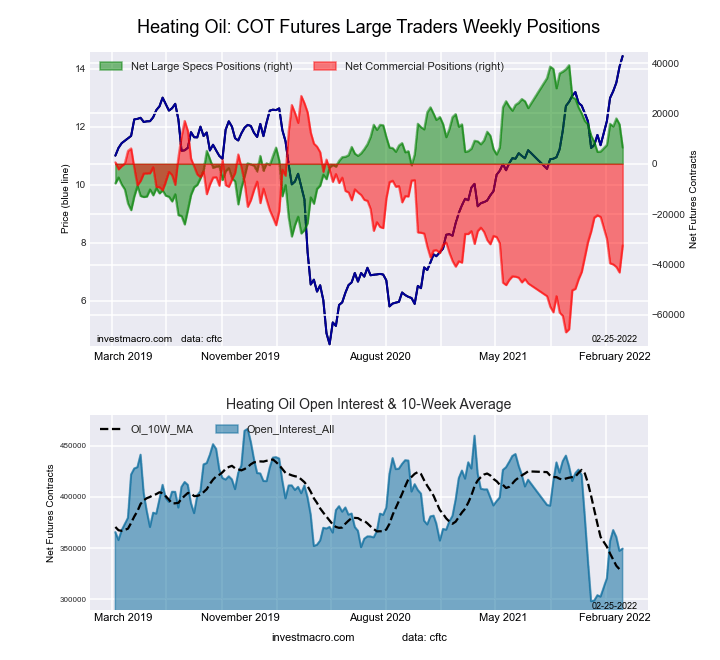 The #2 Heating Oil NY-Harbor Futures large speculator standing this week came in at a net position of 6,455 contracts in the data reported through Tuesday. This was a weekly fall of -9,228 contracts from the previous week which had a total of 15,683 net contracts.
This week’s current strength score (the trader positioning range over the past three years, measured from 0 to 100) shows the speculators are currently Bullish with a score of 51.9 percent. The commercials are Bearish with a score of 36.7 percent and the small traders (not shown in chart) are Bullish-Extreme with a score of 88.4 percent.
| Heating Oil Futures Statistics | SPECULATORS | COMMERCIALS | SMALL TRADERS |
| – Percent of Open Interest Longs: | 17.0 | 50.8 | 14.4 |
| – Percent of Open Interest Shorts: | 15.1 | 60.1 | 6.9 |
| – Net Position: | 6,455 | -32,434 | 25,979 |
| – Gross Longs: | 59,340 | 177,626 | 50,210 |
| – Gross Shorts: | 52,885 | 210,060 | 24,231 |
| – Long to Short Ratio: | 1.1 to 1 | 0.8 to 1 | 2.1 to 1 |
| NET POSITION TREND: | |||
| – Strength Index Score (3 Year Range Pct): | 51.9 | 36.7 | 88.4 |
| – Strength Index Reading (3 Year Range): | Bullish | Bearish | Bullish-Extreme |
| NET POSITION MOVEMENT INDEX: | |||
| – 6-Week Change in Strength Index: | 4.2 | -10.3 | 23.6 |
Bloomberg Commodity Index Futures:
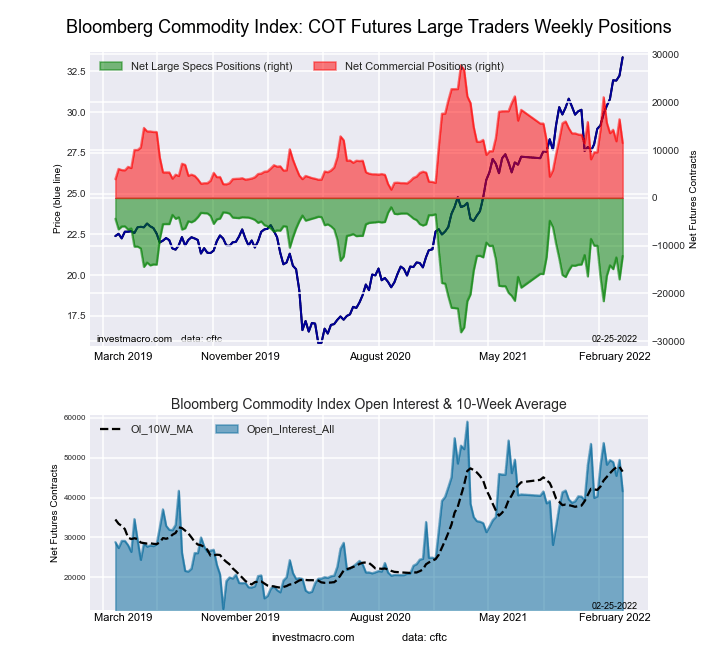 The Bloomberg Commodity Index Futures large speculator standing this week came in at a net position of -12,167 contracts in the data reported through Tuesday. This was a weekly lift of 4,874 contracts from the previous week which had a total of -17,041 net contracts.
This week’s current strength score (the trader positioning range over the past three years, measured from 0 to 100) shows the speculators are currently Bullish with a score of 60.9 percent. The commercials are Bearish with a score of 37.4 percent and the small traders (not shown in chart) are Bearish with a score of 44.3 percent.
| Bloomberg Index Futures Statistics | SPECULATORS | COMMERCIALS | SMALL TRADERS |
| – Percent of Open Interest Longs: | 65.4 | 29.1 | 1.9 |
| – Percent of Open Interest Shorts: | 94.6 | 1.5 | 0.2 |
| – Net Position: | -12,167 | 11,468 | 699 |
| – Gross Longs: | 27,191 | 12,091 | 770 |
| – Gross Shorts: | 39,358 | 623 | 71 |
| – Long to Short Ratio: | 0.7 to 1 | 19.4 to 1 | 10.8 to 1 |
| NET POSITION TREND: | |||
| – Strength Index Score (3 Year Range Pct): | 60.9 | 37.4 | 44.3 |
| – Strength Index Reading (3 Year Range): | Bullish | Bearish | Bearish |
| NET POSITION MOVEMENT INDEX: | |||
| – 6-Week Change in Strength Index: | 36.1 | -36.8 | 5.0 |
Article By InvestMacro – Receive our weekly COT Reports by Email
*COT Report: The COT data, released weekly to the public each Friday, is updated through the most recent Tuesday (data is 3 days old) and shows a quick view of how large speculators or non-commercials (for-profit traders) were positioned in the futures markets.
The CFTC categorizes trader positions according to commercial hedgers (traders who use futures contracts for hedging as part of the business), non-commercials (large traders who speculate to realize trading profits) and nonreportable traders (usually small traders/speculators) as well as their open interest (contracts open in the market at time of reporting).See CFTC criteria here.

- Bitcoin rose to $66,000. The New Zealand dollar continues to strengthen Jul 22, 2026
- Inflationary pressure is easing in Canada. In New Zealand, on the contrary, inflation is rising Jul 21, 2026
- GBP/USD Falls After Cabinet Changes Jul 21, 2026
- Geopolitical and macroeconomic conditions continue to pressure market sentiment Jul 20, 2026
- USD/JPY Poised to Continue Gains as Expensive Oil and Lack of Support Weigh on Yen Jul 20, 2026
- COT Metals Charts: Weekly Speculator Bets led by Copper & Steel Jul 18, 2026
- COT Bonds Charts: Weekly Speculator Bets led by 2-Year, SOFR 3M & 5-Year Bonds Jul 18, 2026
- COT Energy Charts: Weekly Speculator Bets led by Brent Oil & Heating Oil Jul 18, 2026
- COT Soft Commodities Charts: Weekly Speculator Bets led by Wheat, Corn & Soybean Meal Jul 18, 2026
- The Bank of Canada kept its interest rate unchanged. Platinum prices reached a three‑week high Jul 16, 2026