
By InvestMacro | COT | Data Tables | COT Leaders | Downloads | COT Newsletter
Here are the latest charts and statistics for the Commitment of Traders (COT) data published by the Commodities Futures Trading Commission (CFTC).
The latest COT data is updated through Tuesday February 22nd and shows a quick view of how large traders (for-profit speculators and commercial entities) were positioned in the futures markets.
Highlighting the COT metals data is the sharp jump in the Gold futures bets. The speculative net position in the Gold futures has gained strongly for three consecutive weeks and by a total of +71,006 contracts over that time-frame. This week’s rise by +29,535 contracts marked the largest one-week gain of the past fifteen weeks and has brought the overall Gold speculator standing to the highest standing of the past fourteen weeks, dating back to November 16th. The Gold spot price rose sharply as well this week with a spike on Thursday (on the Russian invasion of Ukraine) that brought the spot price to the $1,976 price level before settling lower back below $1,900 as the week ended.
Joining Gold (29,535 contracts) with rising speculator positions this week were Silver (6,746 contracts) and Platinum (7,408 contracts) while Copper (-5,117 contracts) and Palladium (-429 contracts) saw lower speculator bets on the week.
| Feb-22-2022 | OI | OI-Index | Spec-Net | Spec-Index | Com-Net | COM-Index | Smalls-Net | Smalls-Index |
|---|---|---|---|---|---|---|---|---|
| WTI Crude | 2,058,132 | 29 | 339,041 | 2 | -382,891 | 90 | 43,850 | 77 |
| Gold | 611,488 | 49 | 243,148 | 65 | -269,722 | 35 | 26,574 | 40 |
| Silver | 163,745 | 29 | 30,302 | 53 | -43,720 | 56 | 13,418 | 21 |
| Copper | 204,123 | 29 | 25,575 | 61 | -34,754 | 36 | 9,179 | 78 |
| Palladium | 7,903 | 7 | -1,429 | 13 | 1,118 | 83 | 311 | 63 |
| Platinum | 62,274 | 26 | 17,540 | 27 | -22,887 | 76 | 5,347 | 37 |
| Natural Gas | 1,107,113 | 2 | -130,629 | 39 | 95,974 | 61 | 34,655 | 67 |
| Brent | 215,908 | 52 | -26,355 | 73 | 24,478 | 31 | 1,877 | 35 |
| Heating Oil | 349,618 | 31 | 6,455 | 52 | -32,434 | 37 | 25,979 | 88 |
| Soybeans | 826,824 | 51 | 226,464 | 86 | -196,755 | 20 | -29,709 | 21 |
| Corn | 1,563,758 | 32 | 451,742 | 88 | -410,962 | 13 | -40,780 | 20 |
| Coffee | 252,688 | 24 | 67,791 | 98 | -72,509 | 3 | 4,718 | 21 |
| Sugar | 857,376 | 8 | 75,246 | 52 | -95,306 | 50 | 20,060 | 33 |
| Wheat | 379,308 | 23 | -3,902 | 44 | 10,629 | 51 | -6,727 | 69 |
Free Reports:
 Download Our Metatrader 4 Indicators – Put Our Free MetaTrader 4 Custom Indicators on your charts when you join our Weekly Newsletter
 Get our Weekly Commitment of Traders Reports - See where the biggest traders (Hedge Funds and Commercial Hedgers) are positioned in the futures markets on a weekly basis.
Gold Comex Futures:
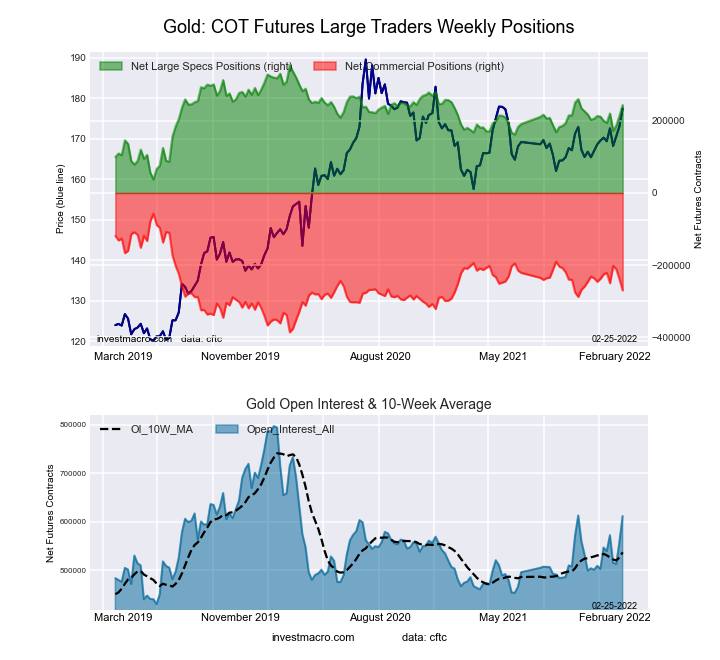 The Gold Comex Futures large speculator standing this week came in at a net position of 243,148 contracts in the data reported through Tuesday. This was a weekly boost of 29,535 contracts from the previous week which had a total of 213,613 net contracts.
This week’s current strength score (the trader positioning range over the past three years, measured from 0 to 100) shows the speculators are currently Bullish with a score of 65.1 percent. The commercials are Bearish with a score of 35.3 percent and the small traders (not shown in chart) are Bearish with a score of 39.6 percent.
| Gold Futures Statistics | SPECULATORS | COMMERCIALS | SMALL TRADERS |
| – Percent of Open Interest Longs: | 57.3 | 21.2 | 8.0 |
| – Percent of Open Interest Shorts: | 17.5 | 65.3 | 3.7 |
| – Net Position: | 243,148 | -269,722 | 26,574 |
| – Gross Longs: | 350,096 | 129,682 | 49,090 |
| – Gross Shorts: | 106,948 | 399,404 | 22,516 |
| – Long to Short Ratio: | 3.3 to 1 | 0.3 to 1 | 2.2 to 1 |
| NET POSITION TREND: | |||
| – Strength Index Score (3 Year Range Pct): | 65.1 | 35.3 | 39.6 |
| – Strength Index Reading (3 Year Range): | Bullish | Bearish | Bearish |
| NET POSITION MOVEMENT INDEX: | |||
| – 6-Week Change in Strength Index: | 13.7 | -13.6 | 3.5 |
Silver Comex Futures:
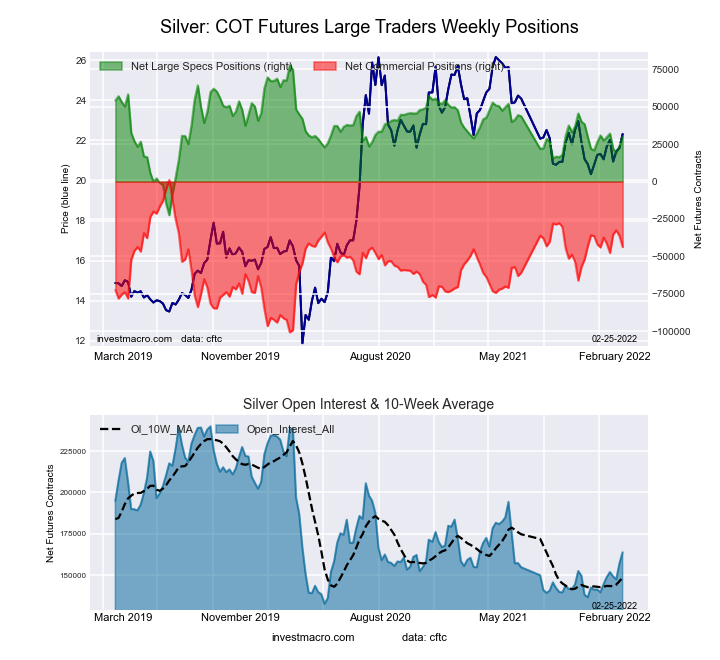 The Silver Comex Futures large speculator standing this week came in at a net position of 30,302 contracts in the data reported through Tuesday. This was a weekly boost of 6,746 contracts from the previous week which had a total of 23,556 net contracts.
This week’s current strength score (the trader positioning range over the past three years, measured from 0 to 100) shows the speculators are currently Bullish with a score of 52.6 percent. The commercials are Bullish with a score of 56.0 percent and the small traders (not shown in chart) are Bearish with a score of 21.0 percent.
| Silver Futures Statistics | SPECULATORS | COMMERCIALS | SMALL TRADERS |
| – Percent of Open Interest Longs: | 35.9 | 34.0 | 16.2 |
| – Percent of Open Interest Shorts: | 17.4 | 60.7 | 8.0 |
| – Net Position: | 30,302 | -43,720 | 13,418 |
| – Gross Longs: | 58,830 | 55,747 | 26,556 |
| – Gross Shorts: | 28,528 | 99,467 | 13,138 |
| – Long to Short Ratio: | 2.1 to 1 | 0.6 to 1 | 2.0 to 1 |
| NET POSITION TREND: | |||
| – Strength Index Score (3 Year Range Pct): | 52.6 | 56.0 | 21.0 |
| – Strength Index Reading (3 Year Range): | Bullish | Bullish | Bearish |
| NET POSITION MOVEMENT INDEX: | |||
| – 6-Week Change in Strength Index: | 2.7 | -6.2 | 21.0 |
Copper Grade #1 Futures:
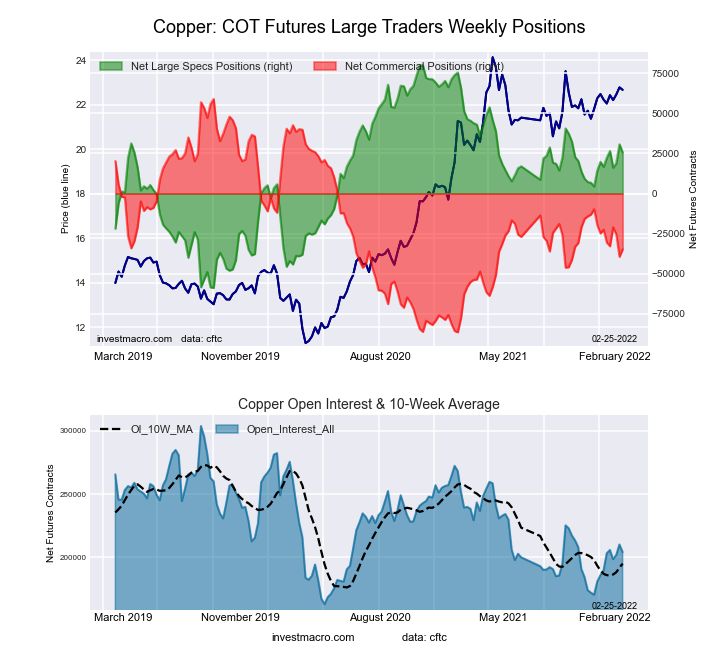 The Copper Grade #1 Futures large speculator standing this week came in at a net position of 25,575 contracts in the data reported through Tuesday. This was a weekly decrease of -5,117 contracts from the previous week which had a total of 30,692 net contracts.
This week’s current strength score (the trader positioning range over the past three years, measured from 0 to 100) shows the speculators are currently Bullish with a score of 60.8 percent. The commercials are Bearish with a score of 35.6 percent and the small traders (not shown in chart) are Bullish with a score of 78.4 percent.
| Copper Futures Statistics | SPECULATORS | COMMERCIALS | SMALL TRADERS |
| – Percent of Open Interest Longs: | 39.7 | 37.9 | 10.1 |
| – Percent of Open Interest Shorts: | 27.1 | 54.9 | 5.6 |
| – Net Position: | 25,575 | -34,754 | 9,179 |
| – Gross Longs: | 80,940 | 77,398 | 20,535 |
| – Gross Shorts: | 55,365 | 112,152 | 11,356 |
| – Long to Short Ratio: | 1.5 to 1 | 0.7 to 1 | 1.8 to 1 |
| NET POSITION TREND: | |||
| – Strength Index Score (3 Year Range Pct): | 60.8 | 35.6 | 78.4 |
| – Strength Index Reading (3 Year Range): | Bullish | Bearish | Bullish |
| NET POSITION MOVEMENT INDEX: | |||
| – 6-Week Change in Strength Index: | 6.4 | -8.4 | 19.3 |
Platinum Futures:
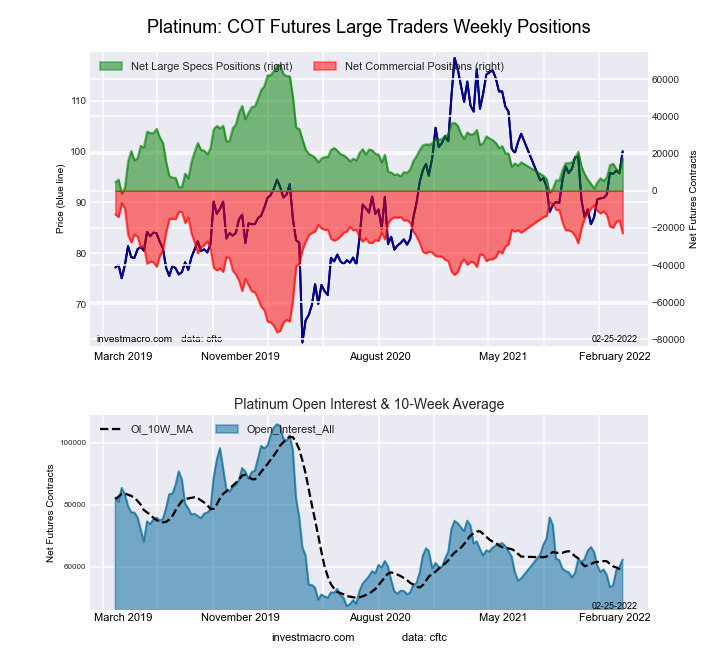 The Platinum Futures large speculator standing this week came in at a net position of 17,540 contracts in the data reported through Tuesday. This was a weekly gain of 7,408 contracts from the previous week which had a total of 10,132 net contracts.
This week’s current strength score (the trader positioning range over the past three years, measured from 0 to 100) shows the speculators are currently Bearish with a score of 27.1 percent. The commercials are Bullish with a score of 76.3 percent and the small traders (not shown in chart) are Bearish with a score of 36.6 percent.
| Platinum Futures Statistics | SPECULATORS | COMMERCIALS | SMALL TRADERS |
| – Percent of Open Interest Longs: | 52.1 | 30.6 | 13.6 |
| – Percent of Open Interest Shorts: | 24.0 | 67.4 | 5.1 |
| – Net Position: | 17,540 | -22,887 | 5,347 |
| – Gross Longs: | 32,462 | 19,079 | 8,495 |
| – Gross Shorts: | 14,922 | 41,966 | 3,148 |
| – Long to Short Ratio: | 2.2 to 1 | 0.5 to 1 | 2.7 to 1 |
| NET POSITION TREND: | |||
| – Strength Index Score (3 Year Range Pct): | 27.1 | 76.3 | 36.6 |
| – Strength Index Reading (3 Year Range): | Bearish | Bullish | Bearish |
| NET POSITION MOVEMENT INDEX: | |||
| – 6-Week Change in Strength Index: | 17.8 | -17.1 | -4.4 |
Palladium Futures:
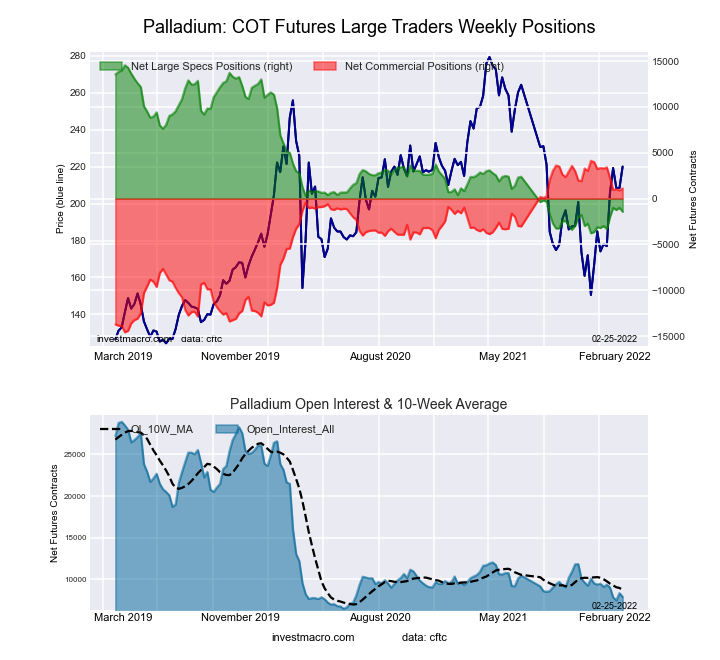 The Palladium Futures large speculator standing this week came in at a net position of -1,429 contracts in the data reported through Tuesday. This was a weekly decrease of -429 contracts from the previous week which had a total of -1,000 net contracts.
This week’s current strength score (the trader positioning range over the past three years, measured from 0 to 100) shows the speculators are currently Bearish-Extreme with a score of 13.4 percent. The commercials are Bullish-Extreme with a score of 83.0 percent and the small traders (not shown in chart) are Bullish with a score of 63.0 percent.
| Palladium Futures Statistics | SPECULATORS | COMMERCIALS | SMALL TRADERS |
| – Percent of Open Interest Longs: | 25.7 | 50.0 | 18.3 |
| – Percent of Open Interest Shorts: | 43.8 | 35.9 | 14.3 |
| – Net Position: | -1,429 | 1,118 | 311 |
| – Gross Longs: | 2,030 | 3,953 | 1,444 |
| – Gross Shorts: | 3,459 | 2,835 | 1,133 |
| – Long to Short Ratio: | 0.6 to 1 | 1.4 to 1 | 1.3 to 1 |
| NET POSITION TREND: | |||
| – Strength Index Score (3 Year Range Pct): | 13.4 | 83.0 | 63.0 |
| – Strength Index Reading (3 Year Range): | Bearish-Extreme | Bullish-Extreme | Bullish |
| NET POSITION MOVEMENT INDEX: | |||
| – 6-Week Change in Strength Index: | 8.9 | -12.3 | 36.8 |
Article By InvestMacro – Receive our weekly COT Reports by Email
*COT Report: The COT data, released weekly to the public each Friday, is updated through the most recent Tuesday (data is 3 days old) and shows a quick view of how large speculators or non-commercials (for-profit traders) were positioned in the futures markets.
The CFTC categorizes trader positions according to commercial hedgers (traders who use futures contracts for hedging as part of the business), non-commercials (large traders who speculate to realize trading profits) and nonreportable traders (usually small traders/speculators) as well as their open interest (contracts open in the market at time of reporting).See CFTC criteria here.

- Inflationary pressure is easing in Canada. In New Zealand, on the contrary, inflation is rising Jul 21, 2026
- GBP/USD Falls After Cabinet Changes Jul 21, 2026
- Geopolitical and macroeconomic conditions continue to pressure market sentiment Jul 20, 2026
- USD/JPY Poised to Continue Gains as Expensive Oil and Lack of Support Weigh on Yen Jul 20, 2026
- COT Metals Charts: Weekly Speculator Bets led by Copper & Steel Jul 18, 2026
- COT Bonds Charts: Weekly Speculator Bets led by 2-Year, SOFR 3M & 5-Year Bonds Jul 18, 2026
- COT Energy Charts: Weekly Speculator Bets led by Brent Oil & Heating Oil Jul 18, 2026
- COT Soft Commodities Charts: Weekly Speculator Bets led by Wheat, Corn & Soybean Meal Jul 18, 2026
- The Bank of Canada kept its interest rate unchanged. Platinum prices reached a three‑week high Jul 16, 2026
- Stock indices rose after the release of US inflation data. China’s GDP slowed sharply Jul 15, 2026