
By InvestMacro | COT | Data Tables | COT Leaders | Downloads | COT Newsletter
Here are the latest charts and statistics for the Commitment of Traders (COT) data published by the Commodities Futures Trading Commission (CFTC).
The latest COT data is updated through Tuesday February 15th and shows a quick view of how large traders (for-profit speculators and commercial entities) were positioned in the futures markets.
Highlighting the COT metals data is the gains in the Copper futures bets. The speculative net position in the Copper futures rose this week by the largest one-week amount of the past seventeen weeks. Copper speculator positions have risen now for two straight weeks and in four out of the past five weeks as well. Spec bullish bets had previously fallen to an eighty-one week low for Copper on December 21st but have rebounded since then with gains in six out of the next eight weeks. This positive sentiment has helped push the speculator positioning to this week to the highest bullish level of the past fifteen weeks.
Joining Copper (11,837 contracts) with rising positions this week were Gold (26,907 contracts), Silver (4,257 contracts) and Palladium (230 contracts) while Platinum (-1,627 contracts) saw lower speculator net contracts for the week.
| Feb-15-2022 | OI | OI-Index | Spec-Net | Spec-Index | Com-Net | COM-Index | Smalls-Net | Smalls-Index |
|---|---|---|---|---|---|---|---|---|
| WTI Crude | 2,122,758 | 39 | 348,093 | 8 | -392,000 | 80 | 43,907 | 77 |
| Gold | 558,645 | 35 | 213,613 | 56 | -238,875 | 45 | 25,262 | 36 |
| Silver | 156,968 | 23 | 23,556 | 46 | -36,348 | 63 | 12,792 | 17 |
| Copper | 210,089 | 34 | 30,692 | 64 | -39,421 | 32 | 8,729 | 76 |
| Palladium | 8,358 | 9 | -1,000 | 15 | 903 | 83 | 97 | 50 |
| Platinum | 59,897 | 22 | 10,132 | 16 | -16,020 | 86 | 5,888 | 44 |
| Natural Gas | 1,098,101 | 0 | -131,424 | 39 | 99,903 | 62 | 31,521 | 59 |
| Brent | 214,404 | 51 | -26,325 | 73 | 22,279 | 27 | 4,046 | 64 |
| Heating Oil | 349,618 | 31 | 6,455 | 52 | -32,434 | 37 | 25,979 | 88 |
| Soybeans | 856,917 | 58 | 216,732 | 84 | -186,438 | 22 | -30,294 | 20 |
| Corn | 1,607,591 | 39 | 414,492 | 83 | -374,969 | 19 | -39,523 | 20 |
| Coffee | 254,992 | 25 | 70,425 | 100 | -75,230 | 1 | 4,805 | 22 |
| Sugar | 871,213 | 11 | 74,563 | 52 | -90,388 | 51 | 15,825 | 27 |
| Wheat | 402,232 | 35 | -5,846 | 42 | 10,013 | 51 | -4,167 | 82 |
Free Reports:
 Get our Weekly Commitment of Traders Reports - See where the biggest traders (Hedge Funds and Commercial Hedgers) are positioned in the futures markets on a weekly basis.
 Download Our Metatrader 4 Indicators – Put Our Free MetaTrader 4 Custom Indicators on your charts when you join our Weekly Newsletter
Gold Comex Futures:
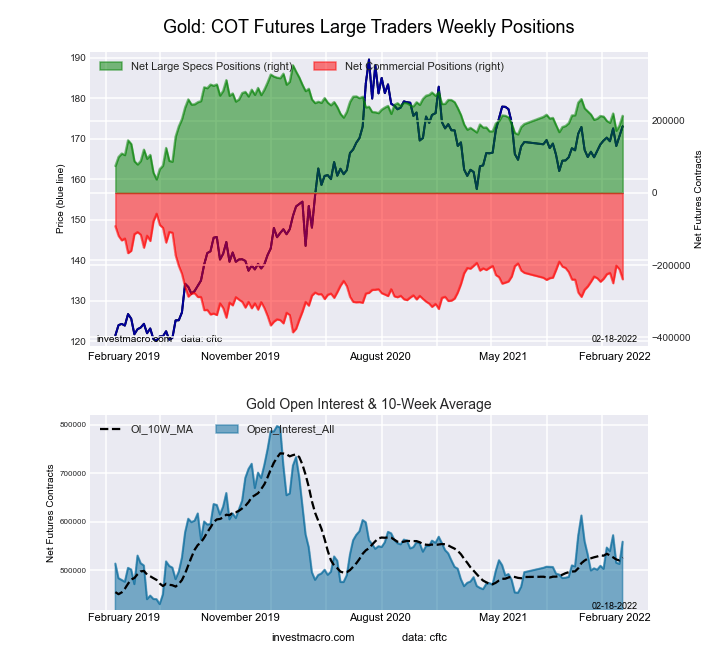 The Gold Comex Futures large speculator standing this week recorded a net position of 213,613 contracts in the data reported through Tuesday. This was a weekly advance of 26,907 contracts from the previous week which had a total of 186,706 net contracts.
This week’s current strength score (the trader positioning range over the past three years, measured from 0 to 100) shows the speculators are currently Bullish with a score of 55.7 percent. The commercials are Bearish with a score of 44.7 percent and the small traders (not shown in chart) are Bearish with a score of 35.9 percent.
| Gold Futures Statistics | SPECULATORS | COMMERCIALS | SMALL TRADERS |
| – Percent of Open Interest Longs: | 56.1 | 22.7 | 8.4 |
| – Percent of Open Interest Shorts: | 17.8 | 65.5 | 3.8 |
| – Net Position: | 213,613 | -238,875 | 25,262 |
| – Gross Longs: | 313,269 | 126,837 | 46,689 |
| – Gross Shorts: | 99,656 | 365,712 | 21,427 |
| – Long to Short Ratio: | 3.1 to 1 | 0.3 to 1 | 2.2 to 1 |
| NET POSITION TREND: | |||
| – Strength Index Score (3 Year Range Pct): | 55.7 | 44.7 | 35.9 |
| – Strength Index Reading (3 Year Range): | Bullish | Bearish | Bearish |
| NET POSITION MOVEMENT INDEX: | |||
| – 6-Week Change in Strength Index: | 0.7 | -0.4 | -2.4 |
Silver Comex Futures:
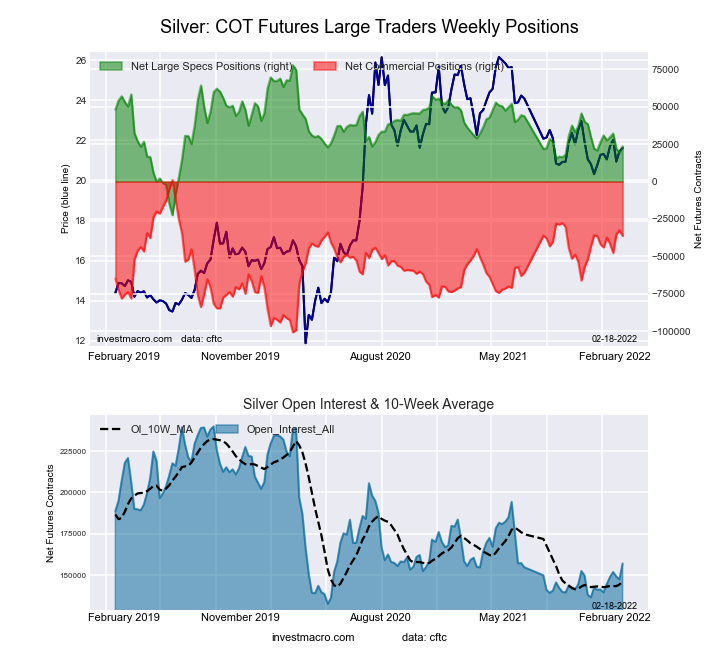 The Silver Comex Futures large speculator standing this week recorded a net position of 23,556 contracts in the data reported through Tuesday. This was a weekly rise of 4,257 contracts from the previous week which had a total of 19,299 net contracts.
This week’s current strength score (the trader positioning range over the past three years, measured from 0 to 100) shows the speculators are currently Bearish with a score of 45.8 percent. The commercials are Bullish with a score of 63.2 percent and the small traders (not shown in chart) are Bearish-Extreme with a score of 17.4 percent.
| Silver Futures Statistics | SPECULATORS | COMMERCIALS | SMALL TRADERS |
| – Percent of Open Interest Longs: | 36.3 | 35.9 | 16.0 |
| – Percent of Open Interest Shorts: | 21.2 | 59.1 | 7.8 |
| – Net Position: | 23,556 | -36,348 | 12,792 |
| – Gross Longs: | 56,911 | 56,394 | 25,107 |
| – Gross Shorts: | 33,355 | 92,742 | 12,315 |
| – Long to Short Ratio: | 1.7 to 1 | 0.6 to 1 | 2.0 to 1 |
| NET POSITION TREND: | |||
| – Strength Index Score (3 Year Range Pct): | 45.8 | 63.2 | 17.4 |
| – Strength Index Reading (3 Year Range): | Bearish | Bullish | Bearish-Extreme |
| NET POSITION MOVEMENT INDEX: | |||
| – 6-Week Change in Strength Index: | -7.3 | 7.5 | -1.5 |
Copper Grade #1 Futures:
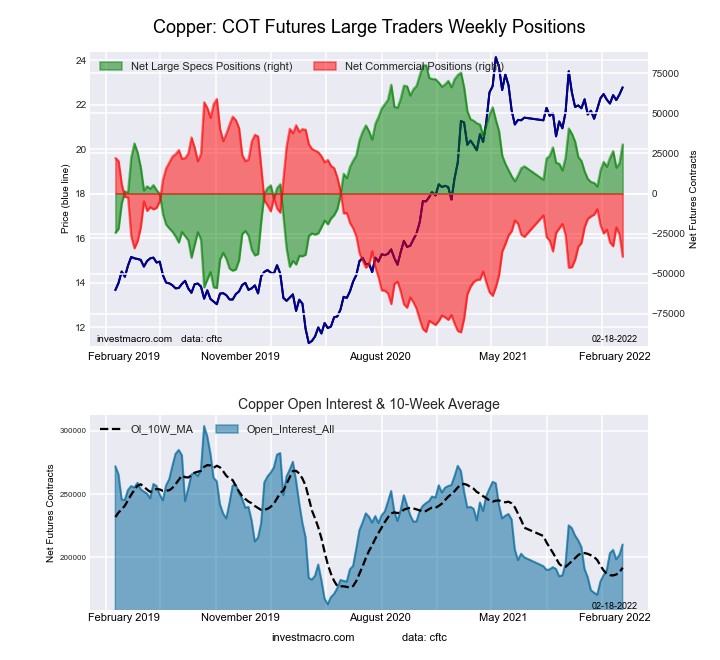 The Copper Grade #1 Futures large speculator standing this week recorded a net position of 30,692 contracts in the data reported through Tuesday. This was a weekly lift of 11,837 contracts from the previous week which had a total of 18,855 net contracts.
This week’s current strength score (the trader positioning range over the past three years, measured from 0 to 100) shows the speculators are currently Bullish with a score of 64.5 percent. The commercials are Bearish with a score of 32.4 percent and the small traders (not shown in chart) are Bullish with a score of 75.8 percent.
| Copper Futures Statistics | SPECULATORS | COMMERCIALS | SMALL TRADERS |
| – Percent of Open Interest Longs: | 40.2 | 38.6 | 9.6 |
| – Percent of Open Interest Shorts: | 25.6 | 57.3 | 5.5 |
| – Net Position: | 30,692 | -39,421 | 8,729 |
| – Gross Longs: | 84,415 | 81,004 | 20,249 |
| – Gross Shorts: | 53,723 | 120,425 | 11,520 |
| – Long to Short Ratio: | 1.6 to 1 | 0.7 to 1 | 1.8 to 1 |
| NET POSITION TREND: | |||
| – Strength Index Score (3 Year Range Pct): | 64.5 | 32.4 | 75.8 |
| – Strength Index Reading (3 Year Range): | Bullish | Bearish | Bullish |
| NET POSITION MOVEMENT INDEX: | |||
| – 6-Week Change in Strength Index: | 7.9 | -10.0 | 21.1 |
Platinum Futures:
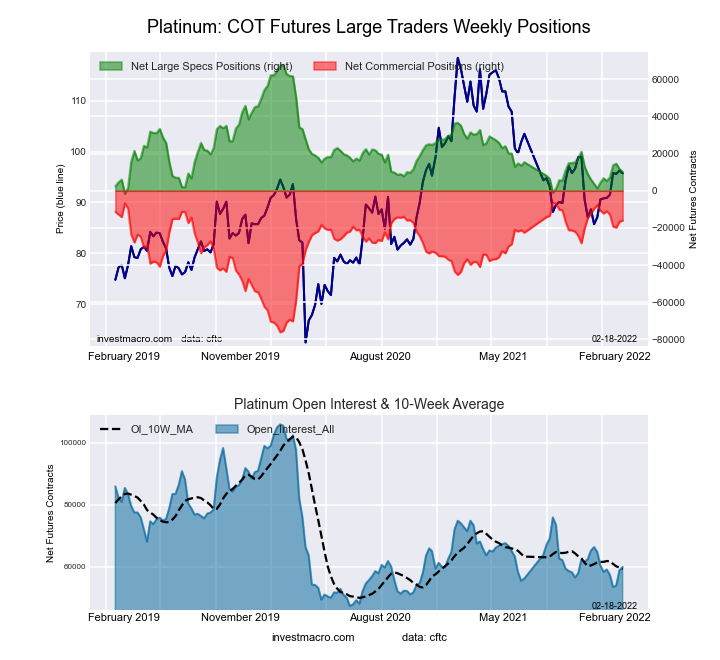 The Platinum Futures large speculator standing this week recorded a net position of 10,132 contracts in the data reported through Tuesday. This was a weekly fall of -1,627 contracts from the previous week which had a total of 11,759 net contracts.
This week’s current strength score (the trader positioning range over the past three years, measured from 0 to 100) shows the speculators are currently Bearish-Extreme with a score of 16.3 percent. The commercials are Bullish-Extreme with a score of 86.1 percent and the small traders (not shown in chart) are Bearish with a score of 44.1 percent.
| Platinum Futures Statistics | SPECULATORS | COMMERCIALS | SMALL TRADERS |
| – Percent of Open Interest Longs: | 47.1 | 35.4 | 14.5 |
| – Percent of Open Interest Shorts: | 30.2 | 62.1 | 4.6 |
| – Net Position: | 10,132 | -16,020 | 5,888 |
| – Gross Longs: | 28,217 | 21,179 | 8,661 |
| – Gross Shorts: | 18,085 | 37,199 | 2,773 |
| – Long to Short Ratio: | 1.6 to 1 | 0.6 to 1 | 3.1 to 1 |
| NET POSITION TREND: | |||
| – Strength Index Score (3 Year Range Pct): | 16.3 | 86.1 | 44.1 |
| – Strength Index Reading (3 Year Range): | Bearish-Extreme | Bullish-Extreme | Bearish |
| NET POSITION MOVEMENT INDEX: | |||
| – 6-Week Change in Strength Index: | 4.9 | -5.5 | 6.5 |
Palladium Futures:
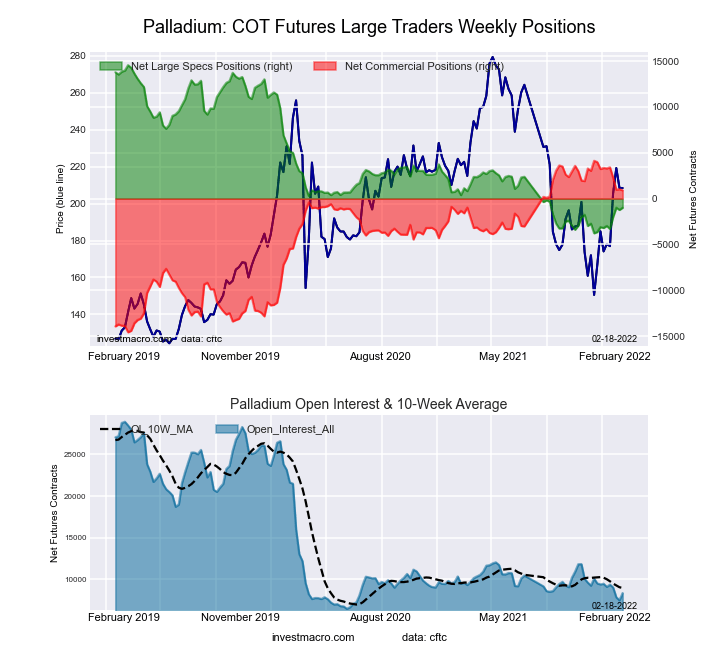 The Palladium Futures large speculator standing this week recorded a net position of -1,000 contracts in the data reported through Tuesday. This was a weekly boost of 230 contracts from the previous week which had a total of -1,230 net contracts.
This week’s current strength score (the trader positioning range over the past three years, measured from 0 to 100) shows the speculators are currently Bearish-Extreme with a score of 15.4 percent. The commercials are Bullish-Extreme with a score of 82.6 percent and the small traders (not shown in chart) are Bullish with a score of 50.4 percent.
| Palladium Futures Statistics | SPECULATORS | COMMERCIALS | SMALL TRADERS |
| – Percent of Open Interest Longs: | 25.0 | 48.1 | 17.1 |
| – Percent of Open Interest Shorts: | 36.9 | 37.3 | 16.0 |
| – Net Position: | -1,000 | 903 | 97 |
| – Gross Longs: | 2,086 | 4,018 | 1,432 |
| – Gross Shorts: | 3,086 | 3,115 | 1,335 |
| – Long to Short Ratio: | 0.7 to 1 | 1.3 to 1 | 1.1 to 1 |
| NET POSITION TREND: | |||
| – Strength Index Score (3 Year Range Pct): | 15.4 | 82.6 | 50.4 |
| – Strength Index Reading (3 Year Range): | Bearish-Extreme | Bullish-Extreme | Bullish |
| NET POSITION MOVEMENT INDEX: | |||
| – 6-Week Change in Strength Index: | 12.2 | -13.2 | 14.7 |
Article By InvestMacro – Receive our weekly COT Reports by Email
*COT Report: The COT data, released weekly to the public each Friday, is updated through the most recent Tuesday (data is 3 days old) and shows a quick view of how large speculators or non-commercials (for-profit traders) were positioned in the futures markets.
The CFTC categorizes trader positions according to commercial hedgers (traders who use futures contracts for hedging as part of the business), non-commercials (large traders who speculate to realize trading profits) and nonreportable traders (usually small traders/speculators) as well as their open interest (contracts open in the market at time of reporting).See CFTC criteria here.

- The US introduces new import tariffs for 60 countries. Brent crude surpasses $100 per barrel Jul 24, 2026
- USD/JPY Breaks Records: Nothing Slows the Yen’s Decline Jul 24, 2026
- Oil prices reached a 6‑week high. The AUD strengthened on the back of a strong labor‑market report Jul 23, 2026
- EUR/USD Recovers as Dollar Weakens Jul 23, 2026
- Bitcoin rose to $66,000. The New Zealand dollar continues to strengthen Jul 22, 2026
- Inflationary pressure is easing in Canada. In New Zealand, on the contrary, inflation is rising Jul 21, 2026
- GBP/USD Falls After Cabinet Changes Jul 21, 2026
- Geopolitical and macroeconomic conditions continue to pressure market sentiment Jul 20, 2026
- USD/JPY Poised to Continue Gains as Expensive Oil and Lack of Support Weigh on Yen Jul 20, 2026
- COT Metals Charts: Weekly Speculator Bets led by Copper & Steel Jul 18, 2026