
By InvestMacro | COT | Data Tables | COT Leaders | Downloads | COT Newsletter
Here are the latest charts and statistics for the Commitment of Traders (COT) data published by the Commodities Futures Trading Commission (CFTC).
The latest COT data is updated through Tuesday January 11th 2022 and shows a quick view of how large traders (for-profit speculators and commercial entities) were positioned in the futures markets.
Highlighting the COT metals data is the decrease in the Gold futures bets. The speculator’s net position in the Gold futures market has declined for two consecutive weeks and has also fallen in six out of the past eight weeks (by a total of -60,043 contracts in that time-frame). The overall net Gold position is now below the +200,000 contract level for the first time in twelve weeks and the open interest levels are currently very low, indicating a quiet market. The Gold futures price has remained stuck fluctuating between $1,700 and $1,900 for the past year and is currently in a triangle pattern. The breakout from this could determine the next trend direction.
Joining Silver (-3,371 contracts) in falling this week are Gold (-11,618 contracts), Copper (-3,053 contracts), Platinum (-1,473 contracts), Palladium (214 contracts).
| Jan-11-2022 | OI | OI-Index | Spec-Net | Spec-Index | Com-Net | COM-Index | Smalls-Net | Smalls-Index |
|---|---|---|---|---|---|---|---|---|
| WTI Crude | 1,966,615 | 15 | 360,505 | 24 | -396,940 | 68 | 36,435 | 66 |
| Gold | 546,516 | 32 | 199,737 | 51 | -225,073 | 49 | 25,336 | 36 |
| Silver | 144,442 | 11 | 27,548 | 50 | -37,360 | 62 | 9,812 | 0 |
| Copper | 189,678 | 19 | 16,706 | 54 | -22,541 | 44 | 5,835 | 59 |
| Palladium | 9,110 | 12 | -2,978 | 4 | 3,292 | 96 | -314 | 26 |
| Platinum | 59,061 | 20 | 5,289 | 10 | -10,952 | 93 | 5,663 | 41 |
| Natural Gas | 1,136,714 | 6 | -122,564 | 42 | 95,136 | 61 | 27,428 | 48 |
| Brent | 215,266 | 51 | -16,691 | 90 | 13,101 | 11 | 3,590 | 58 |
| Heating Oil | 356,728 | 35 | 15,875 | 66 | -39,484 | 29 | 23,609 | 80 |
| Soybeans | 678,613 | 17 | 138,272 | 65 | -104,896 | 41 | -33,376 | 16 |
| Corn | 1,504,234 | 22 | 407,492 | 82 | -366,833 | 20 | -40,659 | 20 |
| Coffee | 265,514 | 33 | 60,168 | 92 | -63,594 | 10 | 3,426 | 12 |
| Sugar | 883,009 | 14 | 122,925 | 62 | -134,491 | 43 | 11,566 | 22 |
| Wheat | 369,218 | 18 | -1,466 | 46 | 12,111 | 53 | -10,645 | 51 |
Free Reports:
 Download Our Metatrader 4 Indicators – Put Our Free MetaTrader 4 Custom Indicators on your charts when you join our Weekly Newsletter
 Get our Weekly Commitment of Traders Reports - See where the biggest traders (Hedge Funds and Commercial Hedgers) are positioned in the futures markets on a weekly basis.
Gold Comex Futures:
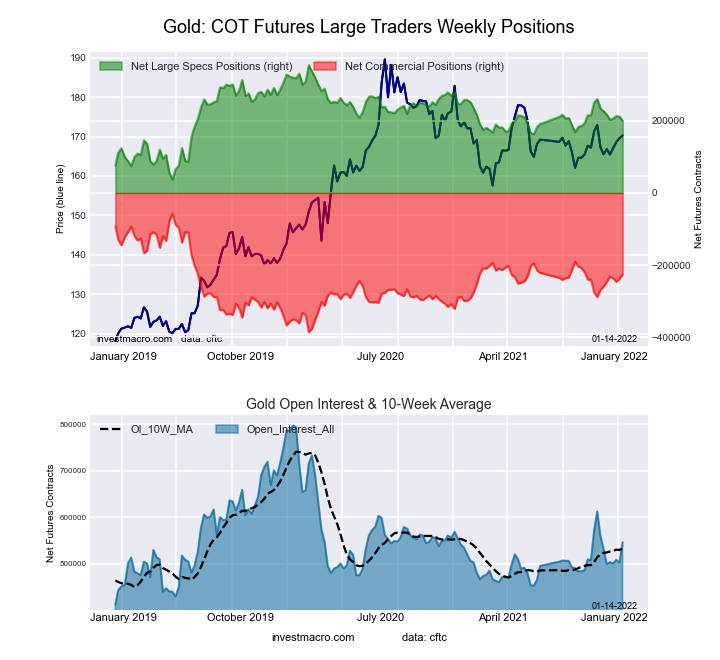 The Gold Comex Futures large speculator standing this week resulted in a net position of 199,737 contracts in the data reported through Tuesday. This was a weekly decline of -11,618 contracts from the previous week which had a total of 211,355 net contracts.
This week’s current strength score (the trader positioning range over the past three years, measured from 0 to 100) shows the speculators are currently Bullish with a score of 51.3 percent. The commercials are Bearish with a score of 48.9 percent and the small traders (not shown in chart) are Bearish with a score of 36.1 percent.
| Gold Futures Statistics | SPECULATORS | COMMERCIALS | SMALL TRADERS |
| – Percent of Open Interest Longs: | 53.1 | 21.3 | 8.8 |
| – Percent of Open Interest Shorts: | 16.5 | 62.5 | 4.2 |
| – Net Position: | 199,737 | -225,073 | 25,336 |
| – Gross Longs: | 290,102 | 116,292 | 48,323 |
| – Gross Shorts: | 90,365 | 341,365 | 22,987 |
| – Long to Short Ratio: | 3.2 to 1 | 0.3 to 1 | 2.1 to 1 |
| NET POSITION TREND: | |||
| – Strength Index Score (3 Year Range Pct): | 51.3 | 48.9 | 36.1 |
| – Strength Index Reading (3 Year Range): | Bullish | Bearish | Bearish |
| NET POSITION MOVEMENT INDEX: | |||
| – 6-Week Change in Strength Index: | -8.3 | 10.2 | -21.1 |
Silver Comex Futures:
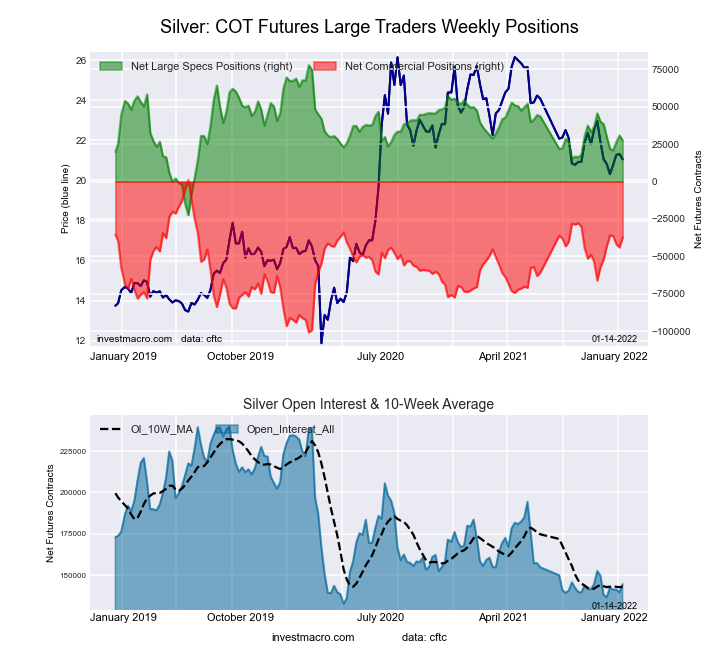 The Silver Comex Futures large speculator standing this week resulted in a net position of 27,548 contracts in the data reported through Tuesday. This was a weekly fall of -3,371 contracts from the previous week which had a total of 30,919 net contracts.
This week’s current strength score (the trader positioning range over the past three years, measured from 0 to 100) shows the speculators are currently Bearish with a score of 49.8 percent. The commercials are Bullish with a score of 62.2 percent and the small traders (not shown in chart) are Bearish-Extreme with a score of 0.0 percent.
| Silver Futures Statistics | SPECULATORS | COMMERCIALS | SMALL TRADERS |
| – Percent of Open Interest Longs: | 45.8 | 32.2 | 16.4 |
| – Percent of Open Interest Shorts: | 26.8 | 58.0 | 9.6 |
| – Net Position: | 27,548 | -37,360 | 9,812 |
| – Gross Longs: | 66,193 | 46,451 | 23,703 |
| – Gross Shorts: | 38,645 | 83,811 | 13,891 |
| – Long to Short Ratio: | 1.7 to 1 | 0.6 to 1 | 1.7 to 1 |
| NET POSITION TREND: | |||
| – Strength Index Score (3 Year Range Pct): | 49.8 | 62.2 | 0.0 |
| – Strength Index Reading (3 Year Range): | Bearish | Bullish | Bearish-Extreme |
| NET POSITION MOVEMENT INDEX: | |||
| – 6-Week Change in Strength Index: | -10.9 | 14.4 | -21.9 |
Copper Grade #1 Futures:
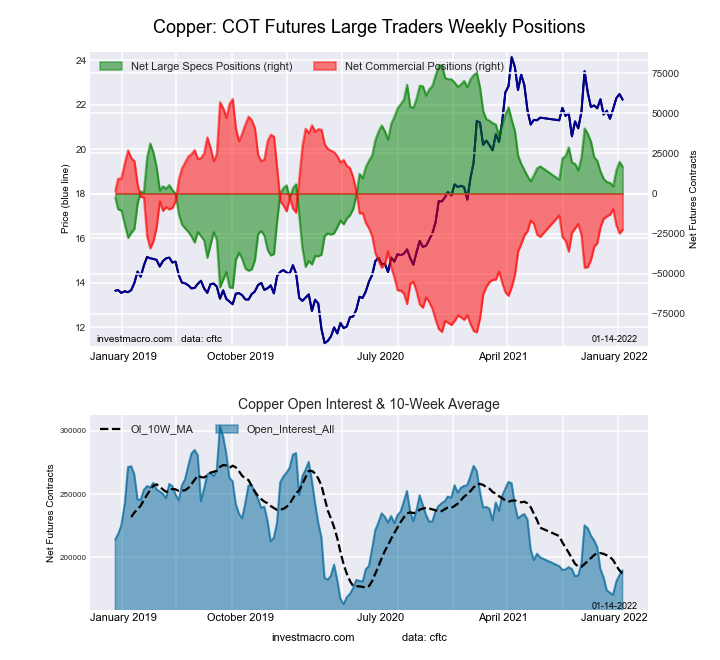 The Copper Grade #1 Futures large speculator standing this week resulted in a net position of 16,706 contracts in the data reported through Tuesday. This was a weekly reduction of -3,053 contracts from the previous week which had a total of 19,759 net contracts.
This week’s current strength score (the trader positioning range over the past three years, measured from 0 to 100) shows the speculators are currently Bullish with a score of 54.4 percent. The commercials are Bearish with a score of 44.0 percent and the small traders (not shown in chart) are Bullish with a score of 59.0 percent.
| Copper Futures Statistics | SPECULATORS | COMMERCIALS | SMALL TRADERS |
| – Percent of Open Interest Longs: | 38.9 | 40.0 | 9.2 |
| – Percent of Open Interest Shorts: | 30.1 | 51.9 | 6.1 |
| – Net Position: | 16,706 | -22,541 | 5,835 |
| – Gross Longs: | 73,808 | 75,817 | 17,477 |
| – Gross Shorts: | 57,102 | 98,358 | 11,642 |
| – Long to Short Ratio: | 1.3 to 1 | 0.8 to 1 | 1.5 to 1 |
| NET POSITION TREND: | |||
| – Strength Index Score (3 Year Range Pct): | 54.4 | 44.0 | 59.0 |
| – Strength Index Reading (3 Year Range): | Bullish | Bearish | Bullish |
| NET POSITION MOVEMENT INDEX: | |||
| – 6-Week Change in Strength Index: | 5.4 | -4.7 | -4.3 |
Platinum Futures:
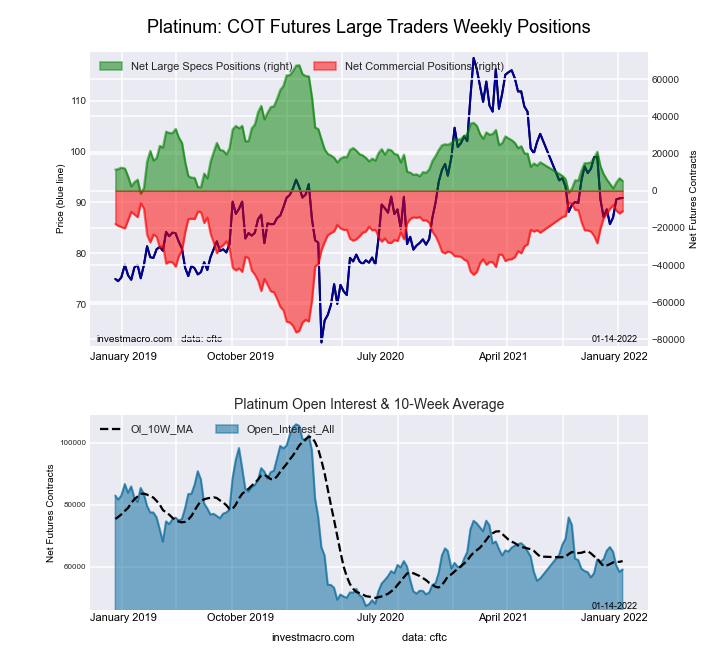 The Platinum Futures large speculator standing this week resulted in a net position of 5,289 contracts in the data reported through Tuesday. This was a weekly lowering of -1,473 contracts from the previous week which had a total of 6,762 net contracts.
This week’s current strength score (the trader positioning range over the past three years, measured from 0 to 100) shows the speculators are currently Bearish-Extreme with a score of 10.0 percent. The commercials are Bullish-Extreme with a score of 93.4 percent and the small traders (not shown in chart) are Bearish with a score of 41.0 percent.
| Platinum Futures Statistics | SPECULATORS | COMMERCIALS | SMALL TRADERS |
| – Percent of Open Interest Longs: | 47.0 | 34.2 | 15.4 |
| – Percent of Open Interest Shorts: | 38.0 | 52.8 | 5.8 |
| – Net Position: | 5,289 | -10,952 | 5,663 |
| – Gross Longs: | 27,751 | 20,228 | 9,085 |
| – Gross Shorts: | 22,462 | 31,180 | 3,422 |
| – Long to Short Ratio: | 1.2 to 1 | 0.6 to 1 | 2.7 to 1 |
| NET POSITION TREND: | |||
| – Strength Index Score (3 Year Range Pct): | 10.0 | 93.4 | 41.0 |
| – Strength Index Reading (3 Year Range): | Bearish-Extreme | Bullish-Extreme | Bearish |
| NET POSITION MOVEMENT INDEX: | |||
| – 6-Week Change in Strength Index: | -5.3 | 5.4 | -1.2 |
Palladium Futures:
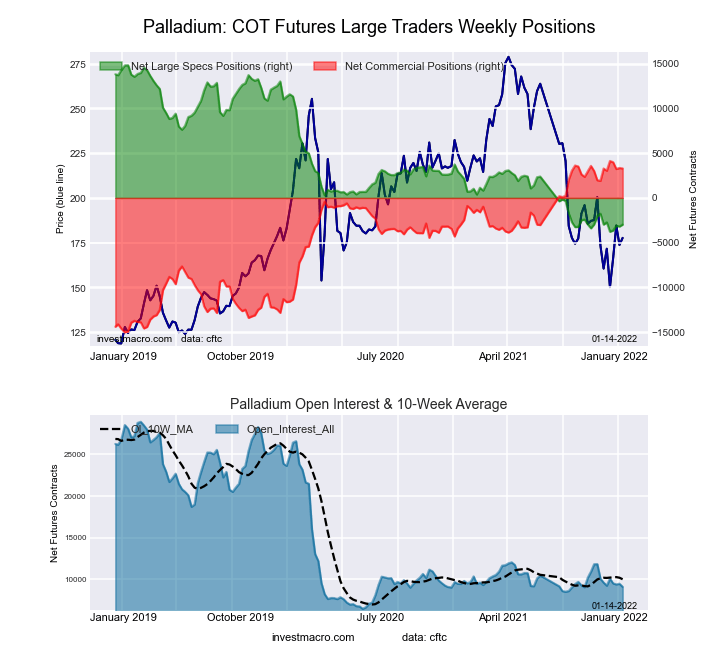 The Palladium Futures large speculator standing this week resulted in a net position of -2,978 contracts in the data reported through Tuesday. This was a weekly rise of 214 contracts from the previous week which had a total of -3,192 net contracts.
This week’s current strength score (the trader positioning range over the past three years, measured from 0 to 100) shows the speculators are currently Bearish-Extreme with a score of 4.3 percent. The commercials are Bullish-Extreme with a score of 95.5 percent and the small traders (not shown in chart) are Bearish with a score of 26.1 percent.
| Palladium Futures Statistics | SPECULATORS | COMMERCIALS | SMALL TRADERS |
| – Percent of Open Interest Longs: | 29.7 | 56.8 | 12.5 |
| – Percent of Open Interest Shorts: | 62.4 | 20.7 | 16.0 |
| – Net Position: | -2,978 | 3,292 | -314 |
| – Gross Longs: | 2,704 | 5,178 | 1,142 |
| – Gross Shorts: | 5,682 | 1,886 | 1,456 |
| – Long to Short Ratio: | 0.5 to 1 | 2.7 to 1 | 0.8 to 1 |
| NET POSITION TREND: | |||
| – Strength Index Score (3 Year Range Pct): | 4.3 | 95.5 | 26.1 |
| – Strength Index Reading (3 Year Range): | Bearish-Extreme | Bullish-Extreme | Bearish |
| NET POSITION MOVEMENT INDEX: | |||
| – 6-Week Change in Strength Index: | -0.0 | 0.1 | -0.6 |
Article By InvestMacro – Receive our weekly COT Reports by Email
*COT Report: The COT data, released weekly to the public each Friday, is updated through the most recent Tuesday (data is 3 days old) and shows a quick view of how large speculators or non-commercials (for-profit traders) were positioned in the futures markets.
The CFTC categorizes trader positions according to commercial hedgers (traders who use futures contracts for hedging as part of the business), non-commercials (large traders who speculate to realize trading profits) and nonreportable traders (usually small traders/speculators) as well as their open interest (contracts open in the market at time of reporting).See CFTC criteria here.

- The US introduces new import tariffs for 60 countries. Brent crude surpasses $100 per barrel Jul 24, 2026
- USD/JPY Breaks Records: Nothing Slows the Yen’s Decline Jul 24, 2026
- Oil prices reached a 6‑week high. The AUD strengthened on the back of a strong labor‑market report Jul 23, 2026
- EUR/USD Recovers as Dollar Weakens Jul 23, 2026
- Bitcoin rose to $66,000. The New Zealand dollar continues to strengthen Jul 22, 2026
- Inflationary pressure is easing in Canada. In New Zealand, on the contrary, inflation is rising Jul 21, 2026
- GBP/USD Falls After Cabinet Changes Jul 21, 2026
- Geopolitical and macroeconomic conditions continue to pressure market sentiment Jul 20, 2026
- USD/JPY Poised to Continue Gains as Expensive Oil and Lack of Support Weigh on Yen Jul 20, 2026
- COT Metals Charts: Weekly Speculator Bets led by Copper & Steel Jul 18, 2026